HAL Id: tel-01813559
https://tel.archives-ouvertes.fr/tel-01813559
Submitted on 12 Jun 2018HAL is a multi-disciplinary open access
archive for the deposit and dissemination of sci-entific research documents, whether they are pub-lished or not. The documents may come from teaching and research institutions in France or abroad, or from public or private research centers.
L’archive ouverte pluridisciplinaire HAL, est destinée au dépôt et à la diffusion de documents scientifiques de niveau recherche, publiés ou non, émanant des établissements d’enseignement et de recherche français ou étrangers, des laboratoires publics ou privés.
Microstructural Characterization and Micromechanical
Modeling of Oolitic Porous Rocks
Kassem Kalo
To cite this version:
Kassem Kalo. Microstructural Characterization and Micromechanical Modeling of Oolitic Porous Rocks. Civil Engineering. Université de Lorraine, 2017. English. �NNT : 2017LORR0203�. �tel-01813559�
AVERTISSEMENT
Ce document est le fruit d'un long travail approuvé par le jury de
soutenance et mis à disposition de l'ensemble de la
communauté universitaire élargie.
Il est soumis à la propriété intellectuelle de l'auteur. Ceci
implique une obligation de citation et de référencement lors de
l’utilisation de ce document.
D'autre part, toute contrefaçon, plagiat, reproduction illicite
encourt une poursuite pénale.
Contact : [email protected]
LIENS
Code de la Propriété Intellectuelle. articles L 122. 4
Code de la Propriété Intellectuelle. articles L 335.2- L 335.10
http://www.cfcopies.com/V2/leg/leg_droi.php
Thèse de DOCTORAT
Préparée à L’Université de Lorraine - Laboratoire GeoRessources –UMR7359 Présentée par
Kassem KALO
Pour obtenir le grade de
Docteur en SCIENCES
DE L’UNIVERSITE DE LORRAINE
Spécialité
Mécanique - Génie Civil
Caractérisation Microstructurale et Modélisation Micromécanique
de Roches Poreuses Oolithiques
Ph-D Thesis
Microstructural Characterization and Micromechanical Modeling
of Oolitic Porous Rocks
Soutenance prévue le 16 Octobre 2017
Jury composé de
D. HOXHA Professeur Université d’Orléans, France Rapporteur J. F. SHAO Professeur Université de Lille, France Rapporteur J. SULEM Professeur Ecole des Ponts ParisTech, France Examinateur P. BESUELLE Chargé de recherche HDR, CNRS, Grenoble, France Examinateur A. GIRAUD
M. HATTAB
Professeur ENSG, Nancy, France
Professeure, Université de Lorraine, France
Examinateur
Examinatrice
D.GRGIC Maître de conférences ENSG, Nancy, France Directeur C. AUVRAY IR, HDR, Université de Lorraine, France Co-directeur
I
Acknowledgements
Firstly, I would like to express my sincere gratitude to my advisor Dr. Dragan Grgic, my co-advisor Dr. Christophe Auvray and Prof. Albert Giraud for the continuous support of my PhD study and related research, for their patience, motivation, and immense knowledge. Their
guidance helped me in all the time of research and writing of this thesis. I could not have imagined having a better advisors and mentors for my PhD study.
I would like to thank the rest of my thesis committee: Prof. Dashnor Hoxha, Prof. Jian Fu Shao, Prof. Jean Sulem, Prof Mahdia Hattab and Dr. Pierre Besuelle to attend my final defense but also for letting my defense be an enjoyable moment, and for your brilliant comments and suggestions which incented me to widen my research from various perspectives.
My sincere thanks also goes to Mr. Christophe Morlot for sharing his experience in performing tomographic scans and to every member of GeoRessources laboratory for their kindness.
Last but not the least, a special thanks to my family. Words cannot express how grateful I am to my mother for all her sacrifices that she has made on my behalf.
III
Abstract
The aim of this work is to study the influence of the microstructure of heterogeneous porous rocks on the behavior at the macroscopic scale. Thus, we characterized the microstructure and micromechanical properties (thanks to nano-indentation tests) of two porous oolitic rocks (Lavoux limestone and iron ore) to calculate their effective mechanical and thermal properties.
Oolitic rocks are constituted by an assemblage of porous grains (oolites), pores and inter-granular crystals. Scanning electron microscopy and X-ray 3D Computed Tomography were used to identify the different components of these rocks. Particular attention was given to X-Ray computed tomography since this analytical method allows the characterization of the porous network (size, spatial distribution, and volume fraction), and the shapes of oolites and inter-oolitic crystals. The novelty of this work lies in taking into account the 3D real shape of pores. Hence, we approximated porous oolites by spheres and irregularly shaped pores by ellipsoids. This approximation was performed thanks to the principal component analysis (PCA), which provides the geometrical properties such as length of semi-axes and orientation of resulting ellipsoids. The sphericity of the approximated oolites was calculated and the values close to 1 allowed us to consider oolites as spheres.
To verify the approximation in the case of pores, we evaluated the contribution of these irregularly shaped three-dimensional pores to the overall elastic properties. Thus, compliance contribution tensors for 3D irregular pores and their ellipsoidal approximations were calculated using the finite element method (FEM). These tensors were compared and a relative error was estimated to evaluate the accuracy of the approximation. This error produces a maximum discrepancy of 4.5% between the two solutions for pores and ellipsoids which verifies the proposed approximation procedure based on PCA. The FEM numerical method was verified by comparing the numerical solution for compliance contribution tensors of ellipsoids to the analytical solution based on Eshelby’s theory. The difference between these two solutions does not exceed 3%. The same numerical method was used to calculate thermal resistivity contribution tensors.
Calculated compliance and resistivity contribution tensors were used to evaluate effective elastic properties (bulk modulus and shear coefficient) and effective thermal conductivity by considering the two-step Maxwell homogenization scheme. The results showed an important influence of the
IV
porosity on effective properties. Finally, the results obtained for irregular pores were compared to those for ellipsoidal ones and they showed a good agreement with a maximum deviation of 4% which verifies once again the approximation of irregularly shaped pores by tri-axial ellipsoids.
V
Contents
Acknowledgements ... I Abstract ... III List of Figures ... IX List of Tables ... XV Résumé de la thèse ... XVII0.1 Contexte général et problématique :... XVII 0.2 Objectifs de la thèse ... XVIII 03. Observations microscopiques et propriétés micromécaniques du calcaire de Lavoux et du minerai de fer ... XIX 04. Approximation des formes irrégulières par des ellipsoïdes ... XXII 04.1 Vérification de l’approximation des oolithes par des sphères ... XXII 04.2 Vérification de l’approximation des pores irréguliers par des ellipsoïdes ... XXIII 0.5 Estimation des propriétés effectives élastiques et thermiques du calcaire de Lavoux . XXVII 0.6 Conclusion et perspectives ... XXX
General Introduction ... XXXIII
Microscopic observations and micromechanical properties of oolitic porous rocks... 3
I.1 Introduction and description of the material ... 4
I.1.1 Description of the Lavoux limestone ... 4
I.1.2 Description of Iron ore ... 6
I.2 Nanoindentation tests: ... 8
I.2.1 Definition and background: ... 8
I.2.2 Function and equipment: ... 9
I.2.3 Mechanical properties measured by nanoindentation ... 10
I.2.4 Application of nanoindentation test on oolitic sample of Lavoux limestone ... 14
I.3 Computed X-Ray nanotomography: ... 21
I.3.1 Introduction and definition ... 21
I.3.2 Data acquisition and processing ... 22
I.3.3 Presentation of VGStudio MAX ... 23
VI
I.3.5 Porosity and representative elementary volume (REV) ... 25
Microstructural characterization of heterogeneous porous rocks (Lavoux limestone and Iron ore) ... 33
II.1 Approximation of irregular shapes by tri-axial ellipsoids ... 34
II.1.1 Introduction and theory ... 34
II.1.2 Approximation of irregularly shaped constituents using principle component analysis (PCA) ... 35
II.1.3 Surface reconstruction algorithms ... 37
II.2 Approximation of oolites by spheres: shape study and statistical analysis ... 39
II.2.1 Calculation of sphericity of oolites using selection tools ... 39
II.2.2 Calculation of sphericity of oolites using grinding process ... 42
II.3 Approximation of pores by tri-axial ellipsoids ... 48
II.3.1 Statistical data of porous network ... 48
II.3.2 Extraction of 3D irregularly shaped pores from nanotomography data ... 51
II.3.2 Application of the PCA on the extracted pores ... 56
Compliance contribution tensor of 3D irregularly shaped pores ... 61
III.1 The first and second Eshelby problems... 62
III.1.1 The first problem of Eshelby for ellipsoidal inclusion ... 62
III.1.2 The second problem of Eshelby for ellipsoidal inhomogeneities ... 63
III.2 Validation of the approximation of irregular pores by ellipsoids using compliance contribution tensors ... 66
III.2.1 Numerical method for compliance contribution tensor of irregular pore and its ellipsoidal approximation ... 66
III.2.2 Numerical integration on the inhomogeneity surface (3D modelling) ... 71
III.2.3 Analytical evaluation of compliance contribution tensor of approximated ellipsoids 74 III.2.4 Fobenius norm: relative error between numerical and analytical methods ... 77
III.3 Effect of geometrical parameters on compliance contribution tensors ... 79
III.3.1 Effect of mesh size ... 79
III.3.2 Effect of pore volume and surface area on compliance contribution tensor ... 82
Determination of effective properties with Maxwell homogenization scheme ... 91
IV.1 Estimation of the effective elastic and conductive properties of the Lavoux limestone ... 92
VII
IV.1.2 Application of Maxwell homogenization scheme to determine effective elastic
properties ... 95
IV.2 Application of Maxwell homogenization scheme to determine conductive properties .. 104
IV.2.1 Resisitivity contribution tensors of 3D irregularly shaped pores ... 104
IV.2.2 Maxwell homogenization scheme reformulated in terms of resistivity contribution tensors ... 111
Conclusion and Perspectives ... 119
References ... 123
Appendix A: Geometrical properties of 10 selected pores for iron ore material. ... 133
Appendix B: numerical integration on the surface of irregularly shaped pore ... 135
Appendix C: Analytical solution for compliance contribution tensors of ellipsoidal pores. .. 139
Appendix D: Verification of the approximation of irregularly shaped pores by tri-axial ellipsoids: Extension to iron ore material. ... 143
IX
List of Figures
Figure 0. 1: Les différents constituants du calcaire de Lavoux observés au MEB : oolithes sphériques avec des couches concentriques, pores inter-oolithiques de formes différentes et ciment inter-oolithique. ... XIX
Figure 0. 2 : Les différents constituants du minerai de fer observés au MEB : oolithes avec des couches concentriques, pores inter-oolithiques de formes différentes et ciment inter-oolithique. ... XIX Figure 0. 3: Illustration en 3D des composants du calcaire de Lavoux obtenus par analyse des images tomographiques : (a) une oolite ; (b) ciment inter-oolitique. ... XX Figure 0. 4: Illustration en 3D des composants du minerai de fer obtenus par analyse des images tomographiques : (a) une oolite ; (b) ciment inter-oolitique ... XX Figure 0. 5: Réseau de porosité d’un VER obtenu par analyse de données voxels tomographiques du calcaire de Lavoux (a) et du minerai de fer (b). ... XXI Figure 0. 6: : Répartition de la fréquence expérimentale du module élastique montrant une distribution à trois phases avec 3 pics : pic 1 : couches intérieures des oolithes ; pic 2 : couches extérieures des oolithes ; pic 3 : macro-calcite interoolithique. ... XXI Figure 0. 7: (a) Une oolithe obtenue à partir des images tomographiques ; (b) approximation de l’oolithe par une ellipsoïde par ACP. ... XXIII Figure 0. 8: Le maillage de la surface et du volume du pore irrégulier et ellipsoïdal dans un cube de référence à l'aide des éléments quadratiques pour les simulations numériques élastiques et thermiques. ... XXIV
Figure 0. 9: Modèle utilisé pour la deuxième étape d'homogénéisation basée sur le schéma d'homogénéisation de Maxwell. ... XXVII Figure 0. 10 : Illustration du module de compressibilité élastique et du coefficient de cisaillement de 10 pores de forme irrégulière en fonction de la porosité en utilisant le schéma de Maxwell : chaque courbe correspond à un modèle contenant un des pores irréguliers orienté aléatoirement. ... XXVIII Figure 0. 11: Module de compressibilité élastique et coefficient de cisaillement (schéma de Maxwell) pour un pore sélectionné: vérification de l'approximation du pore de forme irrégulière par un ellipsoïde. ... XXIX
Figure 0. 12: Gauche : Illustration de la conductivité thermique de 10 pores de forme irrégulière en fonction de la porosité en utilisant le schéma de Maxwell : chaque courbe correspond à un modèle contenant un des pores irréguliers orienté aléatoirement. Droite : La conductivité thermique pour un pore sélectionné: vérification de l'approximation du pore de forme irrégulière par un ellipsoïde. ... XXIX
X
Figure 1. 1: JSM-7600F SEM at GeoRessources Laboratory (Lorraine University, Nancy, France) ... 5 Figure 1. 2: SEM (scanning electron microscope) observations on the components of the Lavoux limestone: spherical oolites with concentric layers, interoolitic pores of different shapes and inter-oolitic cement. ... 6 Figure 1. 3: SEM observations on the components of the iron ore: oolites with concentric layers, interoolitic pores of different shapes and inter-oolitic cement. ... 7 Figure 1. 4: Berkovich indenter shape; Berkovich imprint and residual deformations after a typical nanoindentation test on the Lavoux limestone. ... 10 Figure 1. 5: Typical Load-Displacement curve. ... 11 Figure 1. 6: Schematics of the measurement head and composition of the CSM nano-indentation tester. ... 14
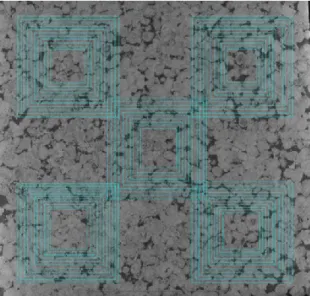
Figure 1. 7: Grid indentation on a heterogeneous system where the probed microvolume (cross-hatched regions below the indenter) is either (a) smaller or (b) larger than the characteristic length scale, D, of the phase of interest (from chen et al., 2010) ... 15 Figure 1. 8: Typical Force-Displacement curve from a nanoindentation test on Lavoux limestone ... 17 Figure 1. 9: Experimental frequency distribution of E showing the three-modal distribution with 3 peaks. ... 18
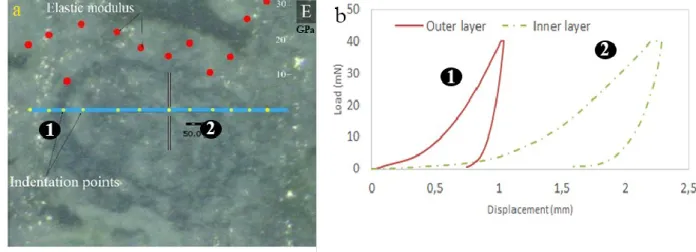
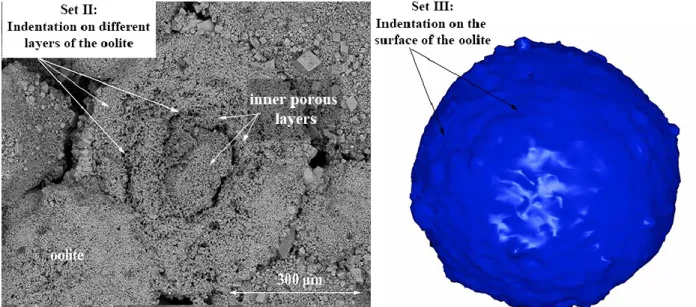
Figure 1. 10: : (a) Nanoindentation tests on oolite layers with corresponding Elastic moduli of each indentation point (b) Force-Displacement curves in: outer and inner layers. ... 20 Figure 1. 11: Illustration of the indentation points of: Set II:indentation on inner and outer layers of the oolite; ... 21 Figure 1. 12: Region of interest selected for the volumetric reconstruction of X-Ray images. ... 23 Figure 1. 13: Illustration of components of the the Lavoux limestone: (a) one example oolite; (b) Inter-oolitic cement ... 25
Figure 1. 14: Illustration of components of the Iron ore: (a) one example oolite; (b) Inter-oolitic cement. ... 25
Figure 1. 15: Histogram evaluating pixel gray values of the sample ... 26 Figure 1. 16: Porosity network of selected REV of the Lavoux limestone and the Iron ore ... 26
Figure 1. 17: Approximate location of the five subvolumes created for the determination of REV in section 2-D of the samples ... 27
Figure 1. 18: Study of porosity stability with variation of cube side length in different regions of Lavoux limestone sample. ... 28 Figure 1. 19: Study of porosity stability with variation of cube side length in different regions of Iron ore sample. ... 28
XI
Figure 1. 20 : The notion of a radius of access to the pores (Bousquié, 1979). ... 30
Figure 1. 21: Mercury porosity (1st injection): Distribution of entrance pore radii (porous spectrum for total porosity) for: ... 31
Figure 2. 1: Intuitive illustration of Poisson reconstruction in 2D (From Kazhdan, 2006). ... 38
Figure 2. 2: 2D (a) and 3D (b) views of an oolite extracted from the Lavoux limestone sample using selection tool. ... 40
Figure 2. 3: Values of sphericity ratio for 40 Lavoux limestone oolites extracted using selection tool based on gray scale values. ... 41
Figure 2. 4: 3D view of selected oolites in the sample of the Lavoux limestone. ... 41
Figure 2. 5: Classification of grinding processes according to the size of the obtained material. ... 42
Figure 2. 6: Left: Jaw crusher; Right: Gyratory crusher. ... 43
Figure 2. 7: Different levels of grinfing of Lavoux limestone in order to separate oolites from other components. ... 44
Figure 2. 8: Effect of the specific surface on sphericity ratio; S1 for smooth surface and S2 for real oolite surface. ... 44
Figure 2. 9: Tomographic 3D images of oolites inside the gel after a grinding process; (a): Lavoux limestone; (b): Iron ore. ... 45
Figure 2. 10: (a) (c) 3D view of an oolite respectively of Lavoux limestone and iron ore extracted after a grinding process from tomographic images (b) (d) Approximation of oolites by an ellipsoid using PCA to obtain a smooth surface for the calculation of sphericity ratio. ... 46
Figure 2. 11: Distribution of 40 Lavoux limestone oolites radii obtained after grinding process; Logistic distribution with a mean = 0.218 mm and a std dev = 0.0348. ... 47
Figure 2. 12: Distribution of 40 Iron ore oolites radii obtained after grinding process; Normal distribution with a mean = 0.112 mm and a std dev = 0.053. ... 47
Figure 2. 13: Sphericity ratio of oolites after approximation by ellipsoids usining PCA method; (a): Lavoux limestone (b): Iron ore. ... 48
Figure 2. 14: 3D views of the porous network of the REV of the Lavoux limestone obtained after applying a threshold algorithm ... 48
Figure 2. 15: Angle with vertical of 30 selected pores from Lavoux limestone REV data in order to study the orientation of pores inside the sample. ... 49
Figure 2. 16: Distribution of pores radius obtained after a threshold algorithm based on gray scale values: Top: Lavoux limestone; Bottom: Iron ore. ... 50
XII
Figure 2. 17: Distribution of pores volume obtained after a threshold algorithm based on gray scale
values: Top: Lavoux limestone; Bottom: Iron ore. ... 51
Figure 2. 18: Porous network of the REV of the Lavoux limestone before and after the application of the volume filter. ... 51
Figure 2. 19: (a) Pore surface point cloud generated from X-Ray tomography (b) Computed normals on every point from point cloud (c) Reconstructed surface of the pore using Poisson algorithm. ... 53
Figure 2. 20: Influence of reconstruction depth parameter on the reconstructed surface of a pore from the porous network of the Lavoux limestone. ... 55
Figure 2. 21: Influence of sample per node parameter on the reconstructed surface of a pore from the porous network of the Lavoux limestone. ... 56
Figure 2. 22: Example of ellipsoidal approximation for a selected 3D irregular pore. ... 57
Figure 3. 1: Illustration of inclusion problem. ... 62
Figure 3. 2: Illustration of a volume V containing an inhomogeneity Ω. ... 64
Figure 3. 3: Surface reconstruction and surface mesh repair of one selected irregularly shaped pore from the RVE: (a) (b) mesh surface before and after the repair; (c) Ellipsoidal approximation using PCA method of repaired pore. ... 68
Figure 3. 4: Process of preparation of pore mesh surface to be imported to Comsol workspace for model mesh generation. ... 68
Figure 3. 5: Irregularly shaped pore and approximated ellipsoid volume and surface mesh inside a reference cube using quadratic elements. ... 69
Figure 3. 6: Reference volume, pore surface mesh, coordinate plane notation and material properties values. ... 70
Figure 3. 7: Pore and ellipsoid volume mesh inside the reference cube using respectively Mesh A, B and C. ... 81
Figure 3. 8: Left: Illustration of ellipsoidal approximation of irregularly shaped pore by PCA (Red ellipsoid); Right: Illustration of ellipsoidal approximation having the same volume of the original irregular pore (Green ellipsoid). ... 83
Figure 3. 9: Left: Measurement of L, W and T values from 2D sections in VGStudio MAX of an irregular pore; Right: Ellipsoidal approximation of the irregular pore using LWT method (Magenta ellipsoid). .... 84
Figure 3. 10: Left: Illustration of ellipsoidal approximation (Red wireframe ellipsoid) of irregularly shaped pore by PCA; Right: Illustration of ellipsoidal approximation of the original irregular pore using AFM method (Yellow wireframe ellipsoid). ... 85
XIII
Figure 3. 11: Influence of approximation methods on volume of irregular pore: linear correlation between approximation values and volumes obtained from CT images. ... 86 Figure 3. 12: Influence of approximation methods on surface of irregular pore: linear correlation between approximation values and surfaces obtained from CT images. ... 87
Figure 4. 1: Three characteristic length scales involved in homogenization scheme ... 92 Figure 4. 2: Three scales on the level of the material from left to right: Macroscopic scale: scale of REV, Mesoscopic scale: scale of oolites and interoolitic pores, Microscopic scale: porous oolite, scale of intraoolite pores. ... 94 Figure 4. 3 :Proposed model for the second homogenization step based on Maxwell’s homogenization scheme. ... 95 Figure 4. 4: Scheme of Maxwell’s homogenization method. Effective properties of a composite (a) are calculated by equating effects produced by a set of inhomogeneities embedded in the matrix material (b) and by fictitious domain having yet unknown effective properties (c). ... 96 Figure 4. 5: First homogenization step: micropores inside oolite core are homogenized by using self-consistent method (2D representation of a 3D microstructure). ... 98
Figure 4. 7: Dependencies of shear coefficient of pores of irregular shape as a function of the porosity using the Maxwell scheme: each curve corresponds to a model containing one of the irregular pores randomly oriented. ... 102 Figure 4. 8: Dependencies of bulk modulus of approximated ellipsoidal pores as a function of the porosity using the Maxwell scheme: each curve corresponds to a model containing one of the irregular pores randomly oriented. ... 102 Figure 4. 9: Dependencies of shear coefficient of approximated ellipsoidal pores as a function of the porosity using the Maxwell scheme: each curve corresponds to a model containing one of the irregular pores randomly oriented. ... 103 Figure 4. 10: Bulk modulus (Maxwell scheme) for a selected pore: verification of the approximation of the irregularly shaped pore by an ellipsoid. ... 103 Figure 4. 11: Shear coefficient (Maxwell scheme) for a selected pore: verification of the approximation of the irregularly shaped pore by an ellipsoid. ... 104 Figure 4. 12: Loading case 1 and boundary conditions on mesh reference cube for numerical ... 107 Figure 4. 13: Temperature field result from loading case 1 in Kelvin. ... 108 Figure 4. 14: Effective thermal conductivity as a function of mesoporosity: each curve corresponds to one of the 10 irregular pores with random orientation. ... 115
XIV
Figure 4. 15: Effective thermal conductivity as a function of mesoporosity: each curve corresponds to one of the 10 irregular pores with random orientation. ... 115 Figure 4. 16: Effective thermal conductivity for a selected pore: verification of the approximation of one irregularly shaped pore by an ellipsoid. ... 116
XV
List of Tables
Table 1. 1: Technical specifications of nanoidenter tester ... 15
Table 1. 2: Indentation series and parameters. ... 16
Table 1. 3: Technical specifications of the nano-tomograph. ... 22
Table 1. 4: Tomographic scan settings. ... 23
Table 2. 1: Properties of 10 selected pores from the Lavoux limestone porous network. ... 52
Table 2. 2: Surface reconstruction and ellipsoidal approximation for 10 selected irregularly shaped pores. ... 57
Table 3. 1: Volumetric and surface mesh information of Cube-IrregularPore and Cube-Ellipsoid models. ... 69
Table 3. 2: The six independent loadings considered to obtain the 21 independent components of compliance contribution tensor. ... 71
Table 3. 3: Frobenius distance in % between analytical and numerical compliance contribution tensors for irregular and ellipsoidal pores compared to the analytical solution based on Eshelby’s theory. ... 78
Table 3. 4: Volumetric and surface mesh information of Cube-IrregularPore and Cube-Ellipsoid models using Mesh A. ... 80
Table 3. 5: Frobenius distance in % between numerical compliance contribution tensors for irregular pore and ellipsoidal approximations using PCA + Same volume and AFM methods. ... 88
Table 4. 1: Loadings and boundary conditions considered to obtain the components of resistivity contribution tensor ... 107
Table 4. 2: Frobenius distance in % between analytical and numerical resistivity contribution tensors ... 109
Table 4. 3: Frobenius distance in % between numerical contribution tensors for irregular and ellipsoidal pores compared to the analytical solution. ... 110
XVI
Table D. 1: Elastic problem: Frobenius distance in % between numerical compliance contribution tensors for irregular and ellipsoidal pores compared to analytical solution based on Eshelby’s theory; Conductivity problem: Frobenius distance in % between numerical resistivity contribution tensors for both irregular and ellipsoidal pores compared to analytical solution based on implicit function of the ellipsoid. ... 143
XVII
Résumé de la thèse
0.1 Contexte général et problématique :
Ce travail de thèse se place dans le cadre de l’étude de l’influence de la microstructure des roches poreuses hétérogènes sur le comportement à l’échelle macroscopique. En général, les comportements court et long terme des roches sont modélisés soit par des approches macro-mécaniques (i.e., phénoménologiques) soit par des approches micromacro-mécaniques. Les approches micromécaniques ont un avantage particulier et pratique puisqu’un nombre relativement faible d’hypothèses est nécessaire. En effet, dans ce cas la complexité du comportement macroscopique simulé ne dérive pas de la complexité du formalisme introduit, mais plutôt de quelques hypothèses sur la microstructure et de considérations statistiques sur les éléments constitutifs (grains, cristaux, pores, fissures).
Le comportement macroscopique thermomécanique des matériaux est affecté par la microstructure. La relation micro-macroscopique est décrite par le biais des modèles micromécaniques développés dans le cadre de la théorie de l’homogénéisation des milieux hétérogènes (méthode d’homogénéisation de Maxwell par exemple). Les méthodes d’homogénéisation (changement d’échelle) sont utilisées pour définir des propriétés effectives (élastiques, conductivité thermique), à l’échelle "macroscopique" où le matériau hétérogène peut être considéré comme un matériau homogène équivalent. Ces méthodes utilisent les informations microstructurales comme les propriétés physiques des constituants, l’effet de forme, la taille et la distribution pour calculer ces propriétés effectives.
Les applications envisagées dans ce travail concernent principalement les matériaux hétérogènes de type roches poreuses. On s’intéressera en particulier aux roches poreuses oolithiques comme le calcaire de Lavoux et le minerai de fer largement étudiées au laboratoire GeoRessources dans le cadre de l'étude de faisabilité du stockage géologique du dioxyde de carbone CO2 (Sterpenich et
al. 2009, Grgic 2011) et de l’étude des effondrements miniers de Lorraine (Grgic et al. 2013, Dagallier et al. 2002, Maitte et al. 2015), et donc une description détaillée des propriétés minéralogiques, pétro-physiques et hydromécaniques de ces roches existe et elle peut être utilisée comme référence dans ce travail.
XVIII
0.2 Objectifs de la thèse
L’objectif de la thèse est la caractérisation expérimentale micro/macromécanique multi-échelle des roches poreuses hétérogènes oolithiques. Deux types de roches sont étudiés : le calcaire de Lavoux et le minerai de fer. Ces roches sont composées par un assemblage de grains poreux plus ou moins sphériques (oolithes), de pores et de cristaux inter-granulaires. On s’intéresse à la caractérisation de la géométrie des constituants de la microstructure de ces roches à l’aide des techniques d’imagerie tridimensionnelles comme la microscopie électronique à balayage (MEB) et la nanotomographie 3D aux rayons X. Le MEB permet d’obtenir plusieurs informations caractéristiques du matériau comme la topographie, la morphologie et la composition chimique de la surface alors que la nanotomographie permet la caractérisation du réseau poreux (taille, répartition spatiale et fraction volumique), des oolithes et des cristaux inter-oolithiques. Les modèles micro-macroscopiques utilisés sont enrichis par les données microstructurales obtenues à partir des observations microscopiques, d’où l’originalité du travail effectué pendant cette thèse qui est due à la combinaison unique d’observations microstructurales (MEB, Nano-tomographie 3D aux rayons X), d’expériences micro-mécaniques (nanoindentation) et de modélisations micro/macroscopiques. En plus, ce travail est innovant car il s’adresse aux matériaux naturels (roches) avec des microstructures réalistes (hétérogènes) contenant des inhomogénéités (pores, inclusions) de différentes formes, orientations et propriétés.
La plupart des méthodes d’homogénéisation des milieux aléatoires se basent sur les approches d’Eshelby et donc sur la solution fondamentale de l’inhomogénéité ellipsoïdale isolée en milieu infini obtenue par Eshelby (1957, 1961). Un modèle simplifié dans le cadre de la méthode d'homogénéisation de Maxwell est considéré où les oolithes poreuses sont approximées par des sphères, et les pores de formes irrégulières sont approximés par des ellipsoïdes. Cette approximation est réalisée grâce à la méthode d'analyse en composantes principales (ACP) qui fournit les propriétés géométriques telles que la longueur des demi-axes et l'orientation des ellipsoïdes résultants. Cette approximation est ensuite vérifiée par le biais de la reformulation du modèle de Maxwell en fonction des tenseurs de contribution de souplesse et de résistivité thermique (Sevostianov and Giraud, 2013).
XIX
03. Observations microscopiques et propriétés micromécaniques du calcaire de
Lavoux et du minerai de fer
La microstructure de deux types de roches oolitiques hétérogènes, calcaire de Lavoux (Figure 0.1 ; 0.3) et minerai de fer (Figure 0.2 ; 0.4), est étudiée par le biais de la microscopie électronique à balayage (MEB) et la nano-tomographie 3D aux rayons X.
L'analyse des images fournies par ces techniques a montré que ces roches sont formées de trois constituants principaux :
• Les oolithes ayant une forme plus ou moins sphérique. • Les pores inter-oolithiques ayant des formes irrégulières. • Le ciment inter-oolithique.
Figure 0. 1: Les différents constituants du calcaire de Lavoux observés au MEB : oolithes sphériques avec des couches concentriques, pores inter-oolithiques de formes différentes et ciment inter-oolithique.
Figure 0. 2 : Les différents constituants du minerai de fer observés au MEB : oolithes avec des couches concentriques, pores inter-oolithiques de formes différentes et ciment inter-oolithique.
XX
Figure 0. 3: Illustration en 3D des composants du calcaire de Lavoux obtenus par analyse des images tomographiques : (a) une oolite ; (b) ciment inter-oolitique.
Figure 0. 4: Illustration en 3D des composants du minerai de fer obtenus par analyse des images tomographiques : (a) une oolite ; (b) ciment inter-oolitique
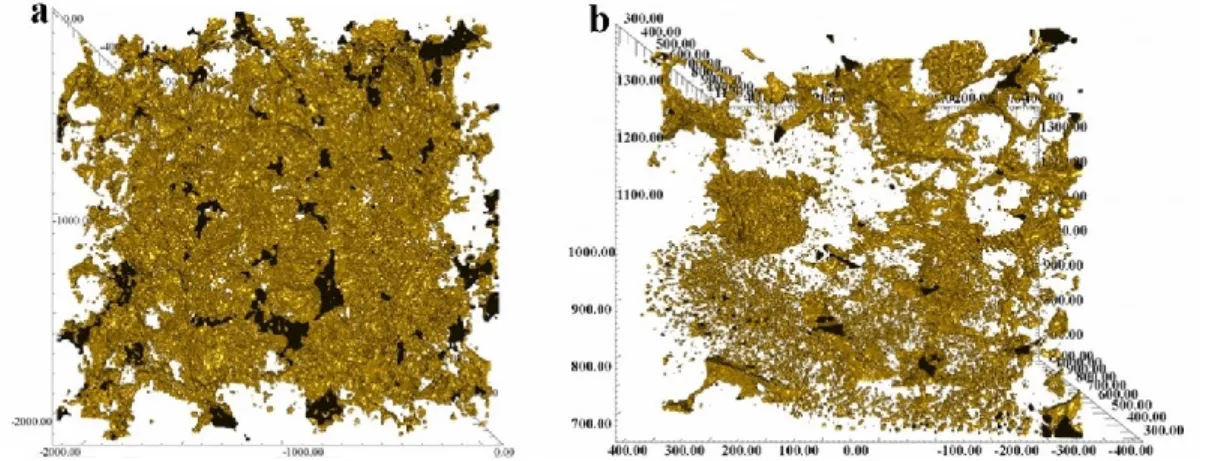
En utilisant la base de données d’un volume élémentaire représentatif (VER) fournie par nano-tomographie et un algorithme de segmentation basé sur les niveaux de gris, la structure poreuse est obtenue (Figure 0.5). La porosité calculée (6.9% pour le calcaire de Lavoux et 3% pour le minerai de fer) représente le volume des pores interoolithiques (mésopores) dans le volume total. Une deuxième partie de pores qui est la microporosité n’est pas accessible par tomographie X car la résolution des images est limitée à 5 µm pour le calcaire de Lavoux et 2.5 µm pour le minerai de fer. L’analyse du VER de l’échantillon du calcaire de Lavoux et du minerai de fer fournit aussi une base de données statistiques concernant les composants du matériau (oolithes, pores inter-oolithiques, etc…). Plusieurs paramètres sont obtenus tel que le rayon, le volume, la distribution spatiale, la surface, ….
XXI
Figure 0. 5: Réseau de porosité d’un VER obtenu par analyse de données voxels tomographiques du calcaire de Lavoux (a) et du minerai de fer (b).
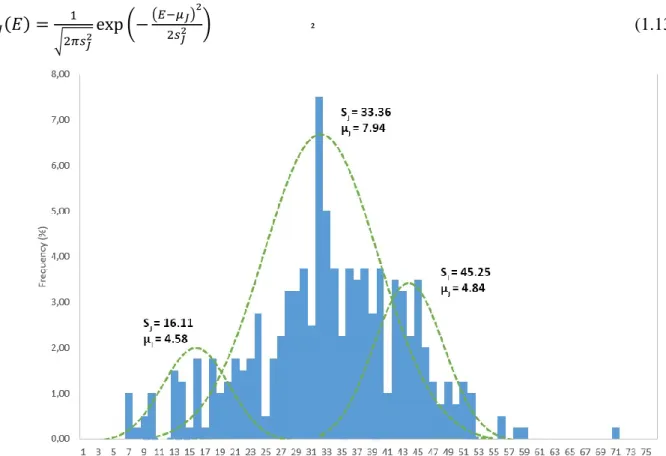
Afin de comprendre le comportement mécanique instantané des différentes familles du calcite du calcaire de Lavoux, plusieurs séries de tests de nano-indentation sont effectuées. Ces tests permettent de déterminer les propriétés micro-mécaniques de ces différents constituants. La Figure 0.6 illustre le module élastique de différentes familles du calcite: couches intérieures des oolithes (micro-calcite), couches externes des oolithes et macro-calcite du ciment interoolithique.
Figure 0. 6: : Répartition de la fréquence expérimentale du module élastique montrant une distribution à trois phases avec 3 pics : pic 1 : couches intérieures des oolithes ; pic 2 : couches extérieures des oolithes ; pic 3 : macro-calcite interoolithique.
XXII
04. Approximation des formes irrégulières par des ellipsoïdes
L’estimation des propriétés mécaniques se fait dans le cadre de la théorie d’homogénéisation des milieux poreux hétérogènes, par exemple la méthode de Maxwell (1873). Les images tomographiques montrent que les pores ont des formes irrégulières et donc les solutions analytiques basées sur la solution ellipsoïdale d’Eshelby ne peuvent pas être utilisées. Pour cela, un modèle simplifié est considéré dans le cadre de la méthode d’homogénéisation de Maxwell où les oolithes sont approximées par des sphères et les pores par des ellipsoïdes. Dans un premier temps, on s’intéresse aux phénomènes mécaniques qui exigent la conservation des moments d’inertie des formes initiales. En effet, la méthode ACP (analyse en composantes principales) est choisie. Cette méthode basée sur les moments d’inertie nous donne les longueurs et l’orientation des 3 axes principaux de l’ellipsoïde.
04.1 Vérification de l’approximation des oolithes par des sphères
L’approximation des oolithes par des sphères (Figure 0.7) est vérifiée par le calcul du rapport de sphéricité S des oolithes présentes dans le VER. Il s’agit du rapport entre la surface de l’oolithe si on la considère comme une sphère et sa surface réelle :
1/3 2/3 (6 p) p V S A (0.1)
où Vp et Ap sont respectivement le volume et la surface réels de l’oolithe.
Dans le travail d’extraction des oolithes des images tomographiques 3D, le paramètre le plus important est la surface spécifique Ap. La surestimation de ce paramètre sous-estime le rapport de sphéricité. Le calcaire de Lavoux est un calcaire monominéral, ce qui rend l’identification des vrais bords des oolithes dans les images tomographiques difficile. Les oolithes sont donc détachées des autres constituants par un processus de broyage et puis triées sous une loupe binoculaire. Afin d’obtenir une surface spécifique bien lisse, les oolithes sont approximées par des ellipsoïdes par la méthode ACP. La sphéricité des ellipsoïdes obtenus est enfin calculée. Les valeurs de sphéricité obtenues sont très proches de 1, ce qui vérifie l’approximation des oolithes par des sphères.
XXIII
Figure 0. 7: (a) Une oolithe obtenue à partir des images tomographiques ; (b) approximation de l’oolithe par une ellipsoïde par ACP.
04.2 Vérification de l’approximation des pores irréguliers par des ellipsoïdes
La meilleure technique pour vérifier mécaniquement l’approximation des pores par des ellipsoïdes est de comparer les tenseurs de contribution des pores (souplesse élastique et résistivité thermique) avec ceux des ellipsoïdes. Il s’agit là du 2ème problème d’Eshelby où une matriceélastique infinie est considérée, contenant une hétérogénéité constituée par un matériau élastique ayant des propriétés différentes, et soumise à une charge uniforme (contrainte ou déformation) aux limites infinies.
On considère deux problèmes : le problème d’élasticité et le problème de conductivité thermique. Les tenseurs de contribution (souplesse pour l’élasticité et résistivité pour la conductivité thermique) des pores irréguliers sont évalués par le biais d’une méthode numérique et deux méthodes analytiques :
• Méthode numérique
Cette méthode est utilisée dans le cas élastique et thermique pour les pores irréguliers comme pour les pores ellipsoïdaux. Elle est basée sur la méthode des éléments finis (FEM) en considérant le problème de l’inhomogénéité de forme irrégulière (ou ellipsoïdale), isolé dans une matrice infinie (Figure 0.8). Les résultats sont obtenus à partir d’une intégrale d’un produit vectoriel sur le volume de l’hétérogénéité comme suit :
1 1 2 ij n ui i u n dSi i V
(0.2)où ij représente un déplacement supplémentaire due à la présence du pore donné par :
* : ij ijkl kl V H V (0.3)
XXIV
Figure 0. 8: Le maillage de la surface et du volume du pore irrégulier et ellipsoïdal dans un cube de référence à l'aide des éléments quadratiques pour les simulations numériques élastiques et thermiques.
Pour le problème élastique, le produit vectoriel correspond au produit du vecteur de déplacement et du vecteur normal. Le vecteur de déplacement est calculé à partir des simulations numériques mécaniques et le vecteur normal est calculé à partir du produit de 2 vecteurs directeurs de la surface du pore : 1 1 2 2 3 3 s z z z z N z z (0.4)
où et sont des coordonnées curvilignes d’un plan de référence local défini.
Pour le problème de conductivité thermique, le produit vectoriel correspond au produit du vecteur de température et du vecteur normal.
• Méthode analytique basée sur la fonction explicite de l’ellipsoïde
Pour vérifier l’approximation des pores par des ellipsoïdes, on a évalué ensuite les tenseurs de contribution de souplesse et de résistivité thermique pour les ellipsoïdes avec la même procédure numérique d’une part, et en utilisant une solution analytique en calculant le vecteur normal à partir de la fonction implicite de l’ellipsoïde f z z z( ,1 2, 3) . Le vecteur normal unitaire à la surface de 0 l'inhomogénéité est alors proportionnel au gradient de la fonction scalaire.
XXV
• Méthode analytique basée sur le premier problème d’Eshelby
Une autre solution analytique peut être obtenue pour le cas élastique seulement en considérant le cas d'une inclusion ellipsoïdale intégrée dans une matrice. Par conséquent, la relation entre les tenseurs d’Eshelby et de Hill est donnée par l'équation suivante dans le cadre du premier problème Eshelby:
ℙ = 𝕊𝐸: ℂ0−1 (0.5)
où ℙ est le tenseur de Hill, 𝕊𝐸 est le tenseur d’Eshelby et ℂ est le tenseur de rigidité élastique.
L'indice «0» se réfère à la phase matricielle et l'indice «1» se réfère à la partie d'inclusion. Ainsi, l'importance du premier problème Eshelby est due à la détermination du tenseur de contribution de la souplesse en fonction des tenseurs Hill et Eshelby, c'est-à-dire pour l'inclusion ellipsoïdale, la solution des tenseurs de souplesse peut être obtenue analytiquement comme suit :
ℍ = −𝕊0 ∶ ℕ ∶ 𝕊0 (0.6)
où N est un tenseur constant de quatrième ordre dépendant de la forme et donné par: ℕ−1 = (ℂ
1− ℂ0)−1+ ℙ (0.7)
Le tableau 0.1 montre 10 pores sélectionnés dans le VER du calcaire du Lavoux, ainsi que les approximations ellipsoïdales correspondantes avec les valeurs des erreurs relatives entre les différentes valeurs des tenseurs numériques et analytiques obtenus dans les 2 cas élastique et thermique. Le calcul de l’erreur se fait par rapport à la solution analytique d’Eshelby dans le cas élastique et à la solution analytique à partir de la fonction implicite de l’ellipsoïde dans le cas thermique car ces deux solutions ne dépendent pas du maillage du modèle. Les résultats montrent un écart de 5% maximum dans le cas élastique et de 12% dans le cas thermique entre les résultats analytiques et numériques, ce qui rend l’approximation effectuée très raisonnable.
Tableau 0. 1: Les pores irréguliers étudiés avec les approximations ellipsoïdales correspondantes ; erreur relative entre les tenseurs de contribution de souplesse et de résistivité numériques des pores irréguliers et ellipsoïdaux par rapport à la solution
ellipsoïdale analytique (Eshelby pour le problème élastique et fonction implicite pour le problème thermique).
Problème élastique Problème thermique
Approximation ellipsoïdale Ellipsoïde (numérique)
Pore (numérique)
Ellipsoïde
XXVI 2.8 3.9 0.78 4.4 2.93 2.96 0.5 6.27 2.97 3.71 0.55 8.5 2.21 4.52 0.4 9.7 0.61 2.04 0.52 8.18 2.35 1.12 0.52 9.6 2.17 3.12 0.33 9.27 2.81 4.21 0.38 8.32 2.66 2.99 1.24 12.4
XXVII
2.79 1.17 0.71 9.21
0.5 Estimation des propriétés effectives élastiques et thermiques du calcaire de
Lavoux
Les propriétés effectives élastiques et thermiques sont évaluées pour un matériau contenant plusieurs pores de forme irrégulière d’une part et pour le même matériau avec de multiples pores ellipsoïdaux d’autre part. Les tenseurs de contribution de souplesse et de résistivité sont utilisés dans le cadre du schéma d'homogénéisation pour déterminer ces propriétés effectives. La phase solide du calcaire de Lavoux (grains micritiques à l'intérieur des oolites et du ciment entre les oolites) est principalement constituée de calcite pure. Par conséquent, la matière élastique de référence utilisée pour étudier la phase solide est la calcite pure.
En outre, la présence de pores dans les oolithes et dans la matrice du ciment nous permet de modéliser le calcaire de Lavoux comme suit (Giraud et al., 2015): (a) Oolite poreuse : calcite (micrite) + micro-pores (b) Matrice poreuse : calcite (sparite) + macro-pores. Une homogénéisation à deux étapes est donc appliquée (Figure 0.9). La première étape d'homogénéisation concerne les pores intra-oolithiques de forme sphérique dans les oolites en utilisant un schéma auto-cohérant (Bruggeman, 1935 ; Hill, 1965). Elle permet la transition de l'échelle microscopique à l'échelle mésoscopique.
XXVIII
La deuxième étape permet la transition de l'échelle mésoscopique à l'échelle macroscopique par le schéma d'homogénéisation de Maxwell. Le schéma d'homogénéisation de Maxwell (Maxwell, 1873) a été introduit pour la première fois dans le contexte de la conductivité électrique effective d'un matériau contenant plusieurs inhomogénéités sphériques. Maxwell a proposé une solution pour ce problème en comparant les résultats du champ lointain de la perturbation du champ électrique appliqué de l'extérieur calculé de deux façons différentes:
- Le champ lointain résultant est la somme de tous les champs lointains générés par toutes les inhomogénéités individuelles dans une région homogénéisée Ω.
- Le champ résultant à des points éloignés est égal au champ lointain généré par la grande région homogénéisée Ω avec des propriétés effectives inconnues.
A l'échelle mésoscopique, nous considérons que le milieu hétérogène est formé par trois phases : les oolites poreuses (o) approximées par des sphères, des macro-pores interoolithiques (b)
approximés par des ellipsoïdes et du ciment inter-oolithique (ou calcite syntaxiale) (c) constitué de
grains de calcite pure.
La Figure 0.10 montre les différents paramètres élastiques calculés en fonction de la porosité. Dans la Figure 0.11, les valeurs des modules de compressibilité élastique et de cisaillement pour un pore irrégulier sont comparées à la solution de l'approximation ellipsoïdale correspondante. Les propriétés élastiques effectives pour tous les autres pores et ellipsoïdes ont également été comparées. Dans tous les cas, les écarts des paramètres élastiques sont faibles et ne dépassent pas 5%.
Figure 0. 10 : Illustration du module de compressibilité élastique et du coefficient de cisaillement de 10 pores de forme irrégulière en fonction de la porosité en utilisant le schéma de Maxwell : chaque courbe correspond à un modèle contenant un des
XXIX
Figure 0. 11: Module de compressibilité élastique et coefficient de cisaillement (schéma de Maxwell) pour un pore sélectionné: vérification de l'approximation du pore de forme irrégulière par un ellipsoïde.
De la même manière, la conductivité thermique du matériau contenant des pores irréguliers en fonction de la porosité est illustrée dans la Figure 0.12 (Gauche) alors que la Figure 0.12 (Droite) illustre la comparaison de la conductivité thermique dans les deux cas : pores irréguliers et ellipsoïdes. Comme dans le cas élastique, les résultats montrent un écart de 4% maximum. En conclusion, l'approximation ACP des pores réels irréguliers est pertinente et son utilisation dans le cadre du schéma d'homogénéisation Maxwell est raisonnable.
Figure 0. 12: Gauche : Illustration de la conductivité thermique de 10 pores de forme irrégulière en fonction de la porosité en utilisant le schéma de Maxwell : chaque courbe correspond à un modèle contenant un des pores irréguliers orienté aléatoirement. Droite : La conductivité thermique pour un pore sélectionné: vérification de l'approximation du pore de forme irrégulière par un
XXX
0.6 Conclusion et perspectives
L'analyse de la microstructure des roches oolithiques hétérogènes (calcaire de Lavoux et minerai de fer) par nanotomographie 3D à rayons X a montré que ces matériaux sont composés de la calcite subdivisée en 3 familles de tailles différentes : les oolithes, les pores inter-oolithiques 3D de forme irrégulière et le ciment interoolithique.
Dans le cadre du schéma d'homogénéisation de Maxwell, nous avons considéré un modèle simplifié pour ces roches où les oolithes sont approximées par des sphères et les pores par des ellipsoïdes. La méthode d'analyse en composantes principales a été utilisée pour effectuer ces approximations. Afin de vérifier l'approximation des oolithes, leur sphéricité a été calculée et les valeurs obtenues étaient proche de 1, ce qui permet de valider l'approximation des oolithes par des sphères.
Des essais de nanoindentation qui ont pour but d’identifier les propriétés micromécaniques du matériau, ont montré que le module d’élasticité des différents composants du calcaire de Lavoux varie entre 7 et 71 GPa. Des tests sur les oolithes, un microcalcite et un macrocalcite réalisé pour la première fois ont montré que les microcalcites sont les composants les plus durs du calcaire de Lavoux alors que les microcalcites sont les composants les moins durs.
Pour vérifier l’approximation dans le cas des pores irréguliers, les tenseurs de contribution d’une hétérogénéité isolée, contribution à la souplesse d’une part (problème élastique) et à la résistivité thermique d’autre part (problème de diffusion linéaire stationnaire), sont calculés numériquement par éléments finis. Ensuite, les tenseurs de contribution pour les pores ellipsoïdaux sont calculés par une solution analytique basée sur la solution d’Eshelby. L’erreur relative entre les tenseurs calculés produit un écart de l'ordre de 4,5% dans le problème élastique et 12% dans le problème thermique, ce qui rend raisonnable l'approximation des pores irréguliers par les ellipsoïdes en utilisant la procédure présentée.
Les propriétés effectives élastiques (module de compressibilité élastique et coefficient de cisaillement) et thermiques (conductivité thermique) ont été évaluées en fonction de la porosité en utilisant les tenseurs de contribution calculés pour les deux cas : pores irréguliers et ellipsoïdes. Les résultats obtenus sont à un bon accord avec un écart maximal de 5%.
Parmi les perspectives, on cite le développement des modèles micromécaniques en introduisant des informations microstructurales supplémentaires obtenues par des essais micromécaniques (nanoindentation par exemple pour le minerai de fer). Ensuite, une autre amélioration est
XXXI
l'augmentation du nombre de pores sélectionnés et la prise en compte des pores avec des niveaux d'irrégularité plus élevés.
Il serait pratique d'étendre la méthode numérique présentée à d'autres cas limitants, par exemple le cas humide, et de comparer les résultats obtenus avec les résultats expérimentaux.
Enfin, l'utilisation et la comparaison d'autres schémas d'homogénéisation et l'étude de leurs effets sur les propriétés effectives seraient intéressantes.
XXXIII
General Introduction
In general, the short and long-term behavior of rocks is modeled either by macro-mechanical (i.e., phenomenological) approaches or by micromechanical approaches. Micromechanical approaches have a particular and practical advantage since a relatively small number of assumptions are needed. In this case, the complexity of the simulated macroscopic behavior does not derive from the complexity of the introduced formalism, but rather from a few microstructural assumptions and statistical considerations on the constitutive elements (grains, crystals, pores, cracks).
The macroscopic thermomechanical behavior of the materials is largely affected by the microstructure. The micro-macroscopic relationship is described via micromechanical models developed within the framework of the homogenization theory of heterogeneous media (Maxwell homogenization method for example). The methods of homogenization (scale change) are used to define effective properties, elastic or conductive, on the "macroscopic" scale where the heterogeneous material can be considered as an equivalent homogeneous material. The aim of this work is then to study the influence of the microstructure of heterogeneous porous rocks on the behavior at the macroscopic scale.
The micro-macroscopic models used are enriched by microstructural data obtained from microscopic observations. Hence, the originality of this work is due to the unique combination of microstructural observations (SEM, X-ray 3D nano-tomography), multi-scale mechanical experiments (nano-indentation tests) and micro / macroscopic modeling. In addition, this work is innovative because it involves the study of natural materials (rocks) with realistic (heterogeneous) microstructures containing inhomogeneities (pores, cracks, inclusions) of different shapes, orientations and properties. Particular attention will be paid to oolitic porous rocks such as Lavoux limestone and iron ore, composed of an assembly of porous grains more or less spherical (oolites), pores and inter-granular crystals. These rocks were widely studied in GeoRessources laboratory as part of the feasibility study for the geological storage of carbon dioxide CO2 and the study of
collapses of underground iron mines in Lorraine (France). Therefore, a detailed description of the mineralogical, petro-physical and hydromechanical properties of these rocks exists and it can be used as a reference in this work.
XXXIV
In Chapter I, we characterize the microstructure of the Lavoux limestone and the iron ore using three-dimensional imaging techniques such as scanning electron microscopy (SEM) and 3D computed nanotomography. X-Ray computed nanotomography allows distinguishing different components of considered rocks: porous network (size, spatial distribution and volume fraction), oolites and inter-oolite crystals. In addition, nano-indentation tests were performed to determine mechanical properties such as elastic parameters, which are necessary in homogenization models.
In Chapter II, we present statistical data describing several geometrical parameters (volume, radius, surface, sphericity, orientation…) of the components of considered rocks. We used a simplified model within the framework of Maxwell homogenization scheme where the porous oolites are approximated by spheres, and the pores of irregular shapes are approximated by ellipsoids. This approximation is performed using the Principal Component Analysis method (PCA), which provides the geometric properties such as the length of the semi-axes and the orientation of the resulting ellipsoids.
In Chapter III, we verify the approximation of irregularly shaped pores by ellipsoids by evaluating property contribution tensors of these pores. Thus, compliance contribution tensors for 3D irregular pores and their ellipsoidal approximations are calculated using the finite element method (FEM). These tensors were compared and a relative error is estimated to evaluate the accuracy of the approximation. The FEM numerical method is verified by comparing the numerical solution of compliance contribution tensors of the ellipsoids to the known analytical solution of these same shapes based on Eshelby’s theory.
In Chapter IV, the numerical method used in the elastic problem is extended to thermal conductivity problem, where the approximation of irregularly shaped pores is also verified by evaluating thermal resistivity contribution tensors. Calculated compliance and resistivity contribution tensors were used to compute effective elastic and thermal properties of a material containing irregularly shaped pores by a two-step Maxwell homogenization scheme. Finally, computed properties of a material containing irregularly shaped pores are compared to those of the same material containing ellipsoidal approximations to evaluate once again the accuracy of the approximation of irregularly shaped pores by tri-axial ellipsoids.
To conclude, some essential results that have been done in this work will be reminded and a brief perspective of the future work will be mentioned
3
Chapter I
Microscopic observations and micromechanical properties of
oolitic porous rocks
4
I.1 Introduction and description of the material
I.1.1 Description of the Lavoux limestoneIn this work, we study the microstructure of a heterogeneous oolitic rock from Lavoux, France. This rock that belongs to the formation of the dogger is located in Poitiers region, southwest of Paris basin. Dogger rocks in that region are characterized by oolitic limestone, classical rock type of the zones of reef deposits. This rock has been widely studied since a while in GeoRessources laboratory within the feasibility study of the geological storage of gases such as carbon dioxide CO2 (Sterpenich et al. 2009, Makhloufi et al. 2013, Grgic 2011), so that a detailed
description of the mineralogical, petrophysical and hydromechanical properties of this rock exists and it can be used as a reference in this work.
The Lavoux limestone is composed of quasi-spherical elements (oolites) with a size varying between 100 and 1000 μm. The study of Grgic (2011) on a Lavoux limestone has shown that this rock has a large inter-oolitic macroporosity and a strong microporosity. In addition to the oolites, the presence of grains of sparite and inter-granular pores are well marked in the rock. 2D observations of the limestone of Lavoux by Auvray (2010) showed that oolites occupy 74% of the surface and that the inter-granular porosity represents 12% of the rock. Oolites are composed of micrite and microporosity.
SEM has been used to study the microstructure of a sample of Lavoux limestone. Several characteristic information was obtained:
(i) Topography or the surface features of the material.
(ii) Morphology i.e. the shape and the size of the particles composing the material. (iii) Element composition of the material and the corresponding relative amount.
We used a JSM-7600F SEM (Figure 1.1) at GeoRessources Laboratory (University of Lorraine, Nancy, France), to visualize the sample of Lavoux limestone. This SEM combines two special technologies: an electronic column with a detection through the lens (semi-in-lens detectors) and a Schottky in-lens field effect gun for up to 400nA probe current. Thus, this SEM can achieve an ultra-high resolution with a wide range of beam current (1pA to more than 400nA).
5
Figure 1. 1: JSM-7600F SEM at GeoRessources Laboratory (Lorraine University, Nancy, France)
Furthermore, the JSM-7600F SEM has a real magnification of 106 with a resolution of 1 nm. Equipped with a set of secondary electron and backscattered electron detectors, and an energy dispersive spectrometer, this SEM has the ability to present detailed data on the morphological characteristics and the chemical composition. Coupled with the SEM, we used an Energy Dispersive X-ray Spectroscopy (EDS) detector to perform qualitative and quantitative chemical analysis of the surfaces.
Mineralogical and morphological analysis of the Lavoux limestone using scanning electron microscopy (SEM) showed that it is made of oolites made up of concentric layers of microcalcite and bound by calcite cement, with a size that varies between 100 and 1000 micrometers (Figure 1.2). Three main types of calcite crystals can be found: large syntaxial crystals of several hundreds of micrometers, small equant calcites with an average size of 10 micrometers precipitated around the oolites in vadose conditions and microcalcites with an average size of 3 micrometers in the core of oolites.
The chemical characterization performed on Lavoux limestone sample by EDS showed that the material is mainly composed of calcite and contains a very small fraction of clays and dolomite. Indeed, the nominal composition in atomic percentage is: O (75.3%), Mg (0.16%), AL (0.5%), Si (0.29%), Ca (23.42%), Fe (0.32%). Therefore, the Lavoux limestone is composed of more than 98% carbonates (calcite) and a small proportion of clays.
6
Figure 1. 2: SEM (scanning electron microscope) observations on the components of the Lavoux limestone: spherical oolites with concentric layers, interoolitic pores of different shapes and inter-oolitic cement.
I.1.2 Description of Iron ore
We studied also the microstructure of another heterogeneous oolitic rock called iron ore from the Lorraine iron basin. The iron ore basin is over 100 km long and 50 km wide, from Luxembourg in the north to Nancy (France) in the south. The iron ore layers (iron content: 30% to 35%), 3–7m thick, are separated by intercalary rocks (argillites, siltites and calcarenite). This material has been widely studied by Grgic (2001; 2005; 2013) who described this material as an assemblage of grains of goethite: ovoid or spherical grains of 0.5 to 2 mm. This assembly of grains is organized in two different ways, depending on the size of the oolite. At their maximum size, oolites are organized in the form of an intersecting structure of variable size. The result is a strong heterogeneity and anisotropy of the ore of variable dimensions in space (Pineau, 1978). In general, oolites are cemented by an assembly of calcite called inter-oolitic cement, siderite and phyllosilicates in varying proportions. The pores of a few nanometers are filled with a largely crystallized spatonic carbonate cement, siderite limestone that generally provide good cohesion to the assembly (Grgic,
7
2001). The mineralogical composition of the interoolitic cement can vary from area to area, therefore iron ore can be considered as a heterogeneous rock from this point of view (Bubenicek, 1970).
Moreover, we observed the microstructure of the iron ore under SEM (Figure 1.3). SEM observations showed that the oolites of this material are made of concentric layers with an average size of 2 mm. In addition, a calcitic cement ensures the cohesion of the oolites and less inter-oolitic pores than the Lavoux limestone were observed.
An overview of the iron ore under the MEB coupled with the EDS showed that the cement is rich in ferrous phyllosilicates and carbonates. According to the chemical composition of the carbonates, it is found that the calcium carbonate is very pure (99% calcite). In contrast, iron carbonate is a mixture of siderite (predominantly 75%), calcite and magnesite.
Figure 1. 3: SEM observations on the components of the iron ore: oolites with concentric layers, interoolitic pores of different shapes and inter-oolitic cement.
8
I.2 Nanoindentation tests:
I.2.1 Definition and background:
The hardness of a material is defined as the surface resistance presented by a material subjected to a surface penetration under the action of a given load. The choice of the indenter is made so that its deformation is neglected compared to the deformation of the tested material. After the contact of these two bodies, the indented material is affected by superficial modifications that depend not only on the intrinsic characteristics of the material but also on mode and conditions of application of the indenter. As a result, the hardness is in fact a complex property that cannot be directly related to other mechanical properties of the material.
In general, classical indentation tests are perfectly adapted to macroscopic measurement of hardness, by evaluating optically the residual imprint left by the indenter. However, an impression of a few microns in width is more difficult to measure optically. In addition, it is necessary to measure the hardness not post-test, but directly during the test, in order to determine the properties of the material under load (Tabor, 1970). Thus, it is for these two reasons that new machines were created 40 years ago. With these devices, the vertical force applied to the indenter is displaced continuously during the test. The displacement is then used to calculate the surface of the impression under load. This technique is called instrumented indentation. We used nano-indentation tests to determine the micromechanical properties of the three families of calcite of Lavoux limestone. This technique is developed in the 1970s and 1980s (Doerner and Nix, 1986; Loubet et al., 1984, 1986; Bulychev et al., 1975).
The field of application of the nanoindentation method is wide and covers a large range of materials. The method was applied to high temperature silicon by Suzuki and Ohmura (1996). Then, it was used to measure the hardness of vitreous polymers at the nanometric scale by Hochstetter et al. (1999). In addition, the physical properties (modulus of elasticity and hardness) of molten silicon, calcium glass, aluminum crystals, tungsten and quartz were also calculated from the charge-discharge curves of the test of nanoindentation by Oliver and Pharr (1992). Furthermore, several applications of this technique on geomaterials can be cited. The nanomechanical behavior of C-S-H (calciumsilicate hydrates) in cementitious materials was evaluated by Costantinides and Ulm (2007) thanks to a statistical analysis of hundreds of nanoindentation tests. In addition, nanoindentation tests have been used to present a systematic
9
approach to treat interfaces between localized (fine grained) and peripheral domains at the atomic scale of crystalline solid (Karpov et al., 2006). Similarly, this technique has recently been used to determine the properties (elastic modulus, hardness) of different constituents of partially saturated argillite (Auvray et al., 2013, 2015, 2017): a series of measurements was carried out by varying the relative humidity with a nanoindentation system placed in an air-conditioned chamber. This equipment allows testing under varying levels of saturation. Nanoindentation measurements controlled by temperature and humidity were used to determine the mechanical properties of the argillite phases. The nanoindentation tests were carried out under controlled temperature and humidity conditions where the viscoelastic properties were calculated by Vandamme and Ulm and the Fischer-Cripps models (Arnold et al., 2015).
I.2.2 Function and equipment:
The most known nanoindentation system that uses the technique of surface referencing is CSM nanoindentation system. Indeed, by controlling the relative position of the reference in real time with respect to the penetration depth of the indenter, the technique leads to several advantages: great accuracy on depth measurements, measurement in a short time and protection of examined surface against external influences e.g. acoustic disturbances.
After the nanoindentation test, it is possible to plot a force-penetration curve used to calculate the hardness of the material. The hardness is the ratio between the applied force F on the indenter and the projected contact area Ac. It is given by the following equation (Fischer-Cripps, 2002):
i c F H A (1.1)
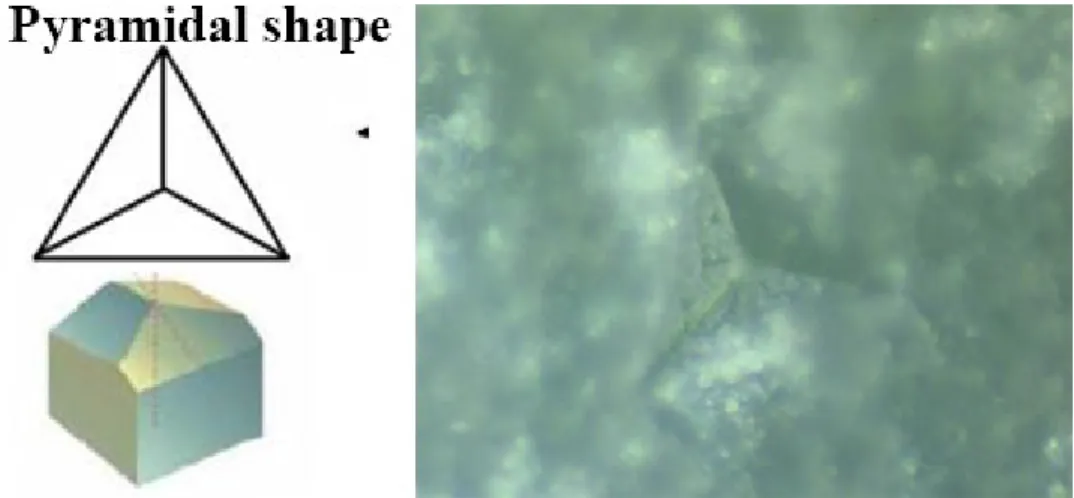
Since the hardness depends on the geometry of the indenter and the parameters of the test, then it is not an intrinsic parameter of the material. We used a Berkovich indenter with a triangular-shaped diamond pyramid (Figure 1.4).
10
Figure 1. 4: Berkovich indenter shape; Berkovich imprint and residual deformations after a typical nanoindentation test on the Lavoux limestone.
Figure 1.4 shows a Berkovich imprint and residual deformation after a typical nanoindentation test. The angle measured between an edge and the opposite face is 63.3 °. The hardness number is obtained as the ratio of the load and the impression depth:
2 (4.95 imp) F H d (1.2)
where F is the load in mN, dimp is the depth of the impression in nm and H is the hardness in GPa.
I.2.3 Mechanical properties measured by nanoindentation
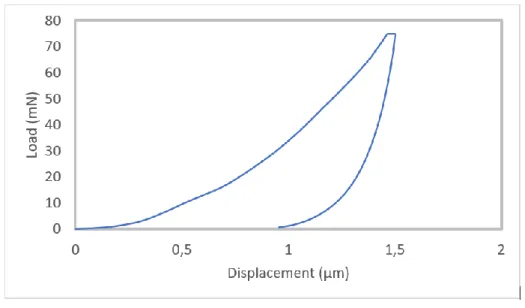
I.2.3.1 Determination of elastic modulus
The first mechanical property that may be obtained from a typical nanoindentation test is the hardness. The second mechanical property obtained from this test is the elasticity modulus. To know the expression of this modulus, we have to study and discuss the Load-Displacement curve plotted after the nanoindentation test. During an indentation test, the acquisition system records the applied load as a function of the penetration depth of the indenter. These two parameters are continuously measured during the loading and the unloading phases. The result is a load-displacement curve that must be used later to deduce the properties of the tested material (elasticity, plasticity, viscoelasticity). An example of this type of curves is shown in Figure 1.5. The displacement hm of the indenter is measured normally with a capacitive sensor. Thus, we obtain
the raw data of load and displacement. To obtain the value of penetration h, it is necessary to