Dietary Crude Lecithin Increases Systemic Availability of
Dietary Docosahexaenoic Acid with Combined Intake in Rats
The MIT Faculty has made this article openly available. Please share
how this access benefits you. Your story matters.
Citation
van Wijk, Nick et al. “Dietary Crude Lecithin Increases Systemic
Availability of Dietary Docosahexaenoic Acid with Combined Intake in
Rats.” Lipids 51.7 (2016): 833–846.
As Published
http://dx.doi.org/10.1007/s11745-016-4139-8
Publisher
Springer Berlin Heidelberg
Version
Final published version
Citable link
http://hdl.handle.net/1721.1/105189
Terms of Use
Creative Commons Attribution
DOI 10.1007/s11745-016-4139-8
ORIGINAL ARTICLE
Dietary Crude Lecithin Increases Systemic Availability of Dietary
Docosahexaenoic Acid with Combined Intake in Rats
Nick van Wijk1 · Martin Balvers1 · Mehmet Cansev2 · Timothy J. Maher3,4 · John W. C. Sijben1 · Laus M. Broersen1,5
Received: 8 November 2015 / Accepted: 29 February 2016 / Published online: 1 April 2016 © The Author(s) 2016. This article is published with open access at Springerlink.com
dietary supplementation of crude lecithin for 2–3 weeks. The aim was to provide experimental evidence for the hypothe-sized additive effects of dietary lecithin (not containing any DHA) on top of dietary DHA on PUFA levels in plasma and RBC. Dietary supplementation of DHA-containing oils, either as vegetable algae oil or as fish oil, increased DHA, eicosapentaenoic acid (EPA), and total n-3 PUFA, and decreased total omega-6 PUFA levels in plasma and RBC, while dietary lecithin supplementation alone did not affect these levels. However, combined dietary supplementation of DHA and lecithin increased the changes induced by DHA supplementation alone. Animals receiving a lecithin-con-taining diet also had a higher plasma free choline concentra-tion as compared to controls. In conclusion, dietary DHA-containing oils and crude lecithin have synergistic effects on increasing plasma and RBC n-3 PUFA levels, including DHA and EPA. By increasing the systemic availability of dietary DHA, dietary lecithin may increase the efficacy of DHA supplementation when their intake is combined.
Keywords Phospholipids · Docosahexaenoic acid ·
Plasma lipids · n-3 Fatty acids · Nutrition · Fish oil · Algal lipids
Abbreviations
DHA Docosahexaenoic acid EPA Eicosapentaenoic acid GC Gas chromatography
HPLC High performance liquid chromatography MUFA Monounsaturated fatty acid(s)
n-3 Omega-3
n-6 Omega-6
PUFA Polyunsaturated fatty acid(s) PtdCho Phosphatidylcholine PtdEtn Phosphatidylethanolamine
Abstract Crude lecithin, a mixture of mainly
phospho-lipids, potentially helps to increase the systemic availability of dietary omega-3 polyunsaturated fatty acids (n-3 PUFA), such as docosahexaenoic acid (DHA). Nevertheless, no clear data exist on the effects of prolonged combined dietary supplementation of DHA and lecithin on RBC and plasma PUFA levels. In the current experiments, levels of DHA and choline, two dietary ingredients that enhance neuronal mem-brane formation and function, were determined in plasma and red blood cells (RBC) from rats after dietary supplemen-tation of DHA-containing oils with and without concomitant
* Nick van Wijk
nick.vanwijk@nutricia.com Martin Balvers martin.balvers@nutricia.com Mehmet Cansev mcansev@uludag.edu.tr Timothy J. Maher timothy.maher@mcphs.edu John W. C. Sijben john.sijben@nutricia.com Laus M. Broersen laus.broersen@nutricia.com
1 Nutricia Research, Nutricia Advanced Medical Nutrition, PO
Box 80141, 3508 TC Utrecht, The Netherlands
2 Department of Pharmacology, Uludag University Medical
School, Gorukle, 16059 Bursa, Turkey
3 Department of Pharmaceutical Sciences, MCPHS University,
179 Longwood Avenue, Boston, MA 02115, USA
4 Department of Brain and Cognitive Sciences, Massachusetts
Institute of Technology, Cambridge, MA, USA
5 Utrecht Institute for Pharmaceutical Sciences (UIPS), Utrecht
PtdIns Phosphatidylinositol RBC Red blood cell(s) SFA Saturated fatty acid(s) Introduction
Omega-3 polyunsaturated fatty acids (n-3 PUFA), such as docosahexaenoic acid (DHA), are important structural components of neuronal membranes and are function-ally implied in various membrane-bound processes [1, 2]. Dietary supplementation of n-3 PUFA raises blood n-3 PUFA levels rapidly [3, 4] and increases their uptake into the brain and therefore their availability for incorporation into neuronal membranes [5, 6]. Thus, neuronal membrane structure and function are subject to alterations induced by nutritional compounds such as n-3 PUFA.
As a result of its biochemical and biophysical proper-ties, dietary lecithin may help to increase the availability of dietary n-3 PUFA, with subsequent effects on neuronal membrane structure and function. Crude lecithin is a mix-ture of mainly phospholipids (up to approximately 75 % for de-oiled lecithin), i.e., phosphatidylcholine (PtdCho), phosphatidylethanolamine (PtdEtn), and phosphatidylino-sitol (PtdIns), and a smaller fraction of glycolipids, neutral lipids, and carbohydrates, that can be extracted from plant or animal food substances. Lecithin has low solubility in water, but is a very good emulsifier and is also a source of active compounds, such as choline, that can be released from PtdCho. Theoretically, dietary lecithin (i.e., phos-pholipids) could increase systemic availability of dietary n-3 PUFA, since (biliary) phospholipids are required for the absorption of fat from the gut lumen into the entero-cytes and the lymph [7, 8]. Several preclinical studies have examined the potential additive effects of lecithin or phospholipids on the bioavailability of triglycerides after oral intake [9–15]. However, most of these studies inves-tigated (1) post-prandial effects of a single dose and/or (2) effects on lymphatic accretion and/or (3) effects of emul-sification, i.e., whether pre-emulsifying oil with lecithin enhances the oil’s bioavailability. For example, recently Couëdelo et al. showed in rats that the lymphatic accretion after single intra-gastric administration of an oil containing the omega-3 fatty acid alpha-linolenic acid (ALA) could be increased by pre-emulsifying the oil with lecithin [14]. No distinct data exist on the effects of prolonged combined dietary supplementation of n-3 PUFA, especially DHA, and phospholipids on plasma and red blood cell (RBC) PUFA levels. Systemic availability is functionally relevant as the availability of n-3 PUFA to tissues such as the brain is largely dependent on their levels in circulation.
The objective of the present study was to test the hypoth-esized additive effects of dietary crude lecithin (which
itself does not contain DHA) on top of dietary supplemen-tation with DHA-containing oils. Experimental diets were presented to rats for 2–3 weeks after which relative and quantitative plasma levels and relative RBC levels of DHA, eicosapentaenoic acid (EPA), total n-3 PUFA, and total omega-6 (n-6) PUFA were determined. Plasma choline was measured to confirm that dietary lecithin, being a source of PtdCho, increases plasma choline concentration.
Materials and Methods
To investigate the effects of dietary lecithin on the systemic availability of dietary DHA in adult rats, two experiments were conducted at the Centrum Kleine Proefdieren, Wagen-ingen University (WagenWagen-ingen, The Netherlands).
Animals
Twenty-four male Wistar rats (HsdCpb:WU) (Experiment A) and 24 Sprague–Dawley rats (Hsd:SD) (Experiment B) were obtained from Harlan (Harlan Nederland, Horst, The Netherlands). Animals aged 10 weeks on arrival were housed in groups in a temperature- and light-controlled room, under 12 h light–12 h dark cycles. Rats had free access to experimental diets and water. Body weight and food-intake was recorded at least once a week. All experimental proto-cols were conducted in accordance with international and national laws and institutional guidelines and approved by the local ethics committee [DEC Consult, Bilthoven, The Netherlands, protocol numbers DEC Nr. NR117 (Experi-ment A) and DEC Nr. DAN0190 (Experi(Experi-ment B)].
Diets
In Experiment A, four grain-based experimental diets with varying levels of vegetable algae DHA oil and crude leci-thin were used: (1) control; (2) lecileci-thin; (3) vegetable DHA oil; (4) vegetable DHA oil + lecithin. In Experiment B, three AIN-93M-based diets were used with varying levels of fish oil and crude lecithin: (1) control; (2) fish oil; (3) fish oil + lecithin. Within each experiment the diets were isocaloric and identical with respect to their protein, car-bohydrate, fiber, and mineral contents. The diets fulfilled minimal dietary requirements for rats and were presented to the animals as pellets. The diets differed in composition with regard to the fat blends used, as well as the amount of lecithin added. The control diets and the lecithin diet did not contain DHA or EPA and the control diets did not contain any added crude lecithin. The lecithin-containing diets in Experiment A were supplemented with 400 mg de-oiled crude soy lecithin/100 g diet (0.4 %, Emulpur IP, Cargill Texturizing Solutions, The Netherlands), whereas
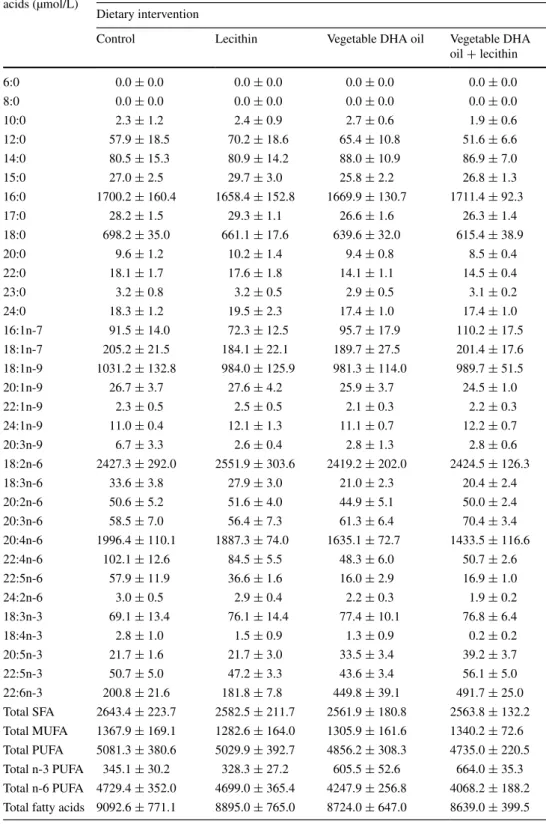
the amount of de-oiled crude lecithin added to the lecithin-containing diet in Experiment B was 1000 mg/100 g diet (1.0 %). Average daily intake of crude lecithin per body weight was calculated based on the respective measured average body weight and food intake and was approxi-mately 250 mg crude lecithin/kg BW/day (Experiment A) and 550 mg crude lecithin/kg BW/day (Experiment B). The de-oiled soy crude lecithin mainly contained phospho-lipids (77 g phosphophospho-lipids/100 g lecithin) of which mainly PtdCho (20 g/100 g lecithin), PtdIns (14 g/100 g lecithin), and PtdEtn (13 g/100 g lecithin, as provided by the sup-plier), with mainly linoleic acid (18:2n-6), palmitic acid (16:0), and oleic acid (18:1n-9), and did not contain any DHA. The total fat content of the fish oil + lecithin diet in Experiment B was corrected for the fat content of the added lecithin. In Experiment A, the amount of fat from lecithin was considered to be negligible. The DHA content of the diets containing vegetable algae DHA oil (DHASCO oil, Martek Biosciences Corporation, USA) in Experiment A and the diets containing fish oil (Tuna RoPUFA, Nu-Mega, Australia) in Experiment B was equal and moder-ate, namely 0.2 DHA g/100 g. Average daily intake of the DHA per body weight was calculated based on the respec-tive measured average body weight and food intake and was approximately 125 mg DHA/kg BW/day (Experiment A) and 110 mg DHA/kg BW/day (Experiment B). Average daily intake of the EPA per body weight was approximately 31 mg EPA/kg BW/day (Experiment A) and 27 mg EPA/ kg BW/day (Experiment B). A detailed overview of the contents of diets is presented in Table 1. Diets were man-ufactured by Research Diet Services, Wijk bij Duurstede, The Netherlands (Experiment A) and Ssniff Spezialdiäten, Soest, Germany (Experiment B) and were stored at −20 °C until use, in order to prevent oxidation of lipids. Analysis of the diets confirmed the calculated fatty acid composition and confirmed that the control diets and the lecithin diet did not contain DHA or EPA.
Experimental Design
In both experiments, all rats were provided with the respec-tive control diet for 2 weeks before starting the interven-tion. Subsequently, animals were divided into the experi-mental groups that were matched according to their body weight and food intake and were placed on one of the experimental diets for 2 weeks (Experiment A) or 3 weeks (Experiment B).
Sample Preparation
After the supplementation period, animals were food-deprived for 3–4 h and euthanized by inhalation of iso-flurane and subsequent decapitation by guillotine. Trunk
blood was collected through a funnel into EDTA-containing tubes. After centrifugation at 1300×g at 20 °C for 10 min (Experiment A) or 1750×g at 4 °C for 10 min (Experiment B), plasma and RBC (Experiment B only) were collected and analyzed for plasma fatty acid composition (Experi-ments A and B) and for RBC fatty acid composition and free choline (Experiment B only). Plasma sample prepara-tion in Experiment A was not adequate for choline analy-sis as plasma free choline is not stable at room tempera-ture and therefore these results are lacking. Based on the results of Experiment A, RBC samples were also collected in Experiment B.
Plasma Fatty Acid Composition and Plasma Free Choline Analyses
Plasma and RBC total lipid fatty acid composition was detected using gas chromatography (GC). Total lipids were extracted from plasma and RBC using a modified Bligh and Dyer protocol [16] by adding methanol, 1 % EDTA solution, and dichloromethane to 100 µL plasma or approx-imately 150 µL RBC (non-quantitative). After vortexing for 5 min, samples were centrifuged at 1750×g for 10 min and the organic phase (dichloromethane and lipids) was col-lected. The dichloromethane layer was dried using a Speed-Vac® concentrator. Next, 2.0 mL methanol and 40 μL con-centrated sulfuric acid (2 v/v %) were added to the dried extract and samples were heated at 100 °C for 60 min [17]. After cooling, 2 mL hexane and 0.5 mL 2.5 mol/L sodium hydroxide solution were added. Samples were sub-sequently vortexed and centrifuged for 5 min at 1750×g after which the upper layer was collected and dried using a SpeedVac®. Dried samples were subsequently dissolved in 125 μL iso-octane and analyzed by GC (Shimadzu Corpo-ration, Kyoto, Japan) using flame ionization detection with a CP-SIL88 column (50 m × 0.25 mm id. 0.20 μm film thickness; Agilent Technologies, Inc., Santa Clara, CA, USA). The carrier gas was hydrogen and the make-up gas was nitrogen. GC oven temperature settings were as fol-lows: initial temperature 150 °C for 3.75 min; temperature increment to 220 °C at 22 °C/min; and subsequent constant temperature of 220 °C for 14.07 min (in-house settings). Fatty acids were identified based on retention time using an external reference standard (GLC-461, Nu-Chek Prep, Inc., Elysian, MN, USA). Peak area was used as a measure of relative percent (mol%). An internal standard (1,2-dino-nadecanoyl-sn-glycero-3-phosphocholine, Avanti Polar Lipids, Inc., AL, USA) was used for absolute quantification of fatty acids (µmol/L) in plasma. RBC fatty acids were not quantitatively pipetted and were therefore not absolutely quantified.
High performance liquid chromatography (HPLC) cou-pled to electrochemical detection of plasma free choline
was performed using a commercially available choline assay HPLC method from Thermo Fisher Scientific (for-mer ESA Biosciences, Chelmsford, MA, USA). Briefly, after protein precipitation, samples were centrifuged to remove proteins. The supernatant was injected into the HPLC (Thermo Fisher Scientific, former ESA Biosciences, Chelmsford, MA, USA) using a post-column immobilized
enzyme reactor, in an on-line enzyme reaction to produce H2O2, which was detected electrochemically.
Statistical Analyses
All statistical analyses were performed using SPSS (version 19, SPSS Inc., Chicago, IL, USA). Data were expressed as
Table 1 Detailed compositions of the experimental diets used in Experiment A and Experiment B Ingredients (g/100 g diet) Diets Experiment A
Control Lecithin Vegetable DHA oil Vegetable DHA oil + lecithin
Wheat 25.87 25.87 25.87 25.87 Barley 25.00 25.00 25.00 25.00 Semolina 25.00 24.60 25.00 24.60 Soybean meal 8.50 8.50 8.50 8.50 Bentonite 1.00 1.00 1.00 1.00 Whey powder 5.00 5.00 5.00 5.00 Soy oil 1.90 1.90 1.76 1.76 Corn oil 2.20 2.20 1.90 1.90 Coconut fat 0.90 0.90 0.80 0.80
Vegetable algae DHA oil (DHASCO oil) – – 0.54 0.54
Vitamin/mineral mix (including choline) 2.20 2.20 2.20 2.20
CaCO3 1.40 1.40 1.40 1.40
Dicalcium phosphate 0.30 0.30 0.30 0.30
NaCl 0.50 0.50 0.50 0.50
l-Lysine HCl 0.18 0.18 0.18 0.18
dl-Methionine 0.05 0.05 0.05 0.05
Soy lecithin (Emulpur IP) – 0.40 – 0.40
Sum 100.00 100.00 100.00 100.00
Ingredients (g/100 g diet) Diets Experiment B
Control Fish oil Fish oil + lecithin
Cornstarch, pre-gelatinized 34.59 34.59 34.34 Maltodextrin, 10 DE 15.50 15.50 15.50 Sucrose 10.00 10.00 10.00 Dextrose 10.00 10.00 10.00 Cellulose powder 5.00 5.00 5.00 Casein 14.00 14.00 14.00 Soy oil 3.00 3.00 2.25 Corn oil 2.10 1.50 1.50 Coconut fat 0.90 0.70 0.70
Fish oil (Tuna RoPUFA) – 0.80 0.80
Mineral mix (AIN-93M-MX) 3.50 3.50 3.50
Vitamin mix (AIN-93-VX) 1.00 1.00 1.00
Choline chloride (50 %) 0.23 0.23 0.23
l-Cystine 0.18 0.18 0.18
Tert-butylhydroquinone 0.0008 0.0008 0.0008
Soy lecithin (Emulpur IP) – – 1.00
means ± SEM. P values <0.05 were considered significant. Effects of dietary treatments on body weight and food intake were analyzed using repeated-measures ANOVA with Diet (Experiment A) or dietary DHA and dietary lecithin (Experi-ment B) as the between-subject factor(s) and day as the within-subject factor. Plasma and RBC fatty acids relative and quan-titative levels (DHA, EPA, total n-3 PUFA and n-6 PUFA) and choline concentrations were compared between rats fed the different experimental diets using two-way ANOVA with dietary DHA and dietary lecithin as between-subject factors (Experiment A) or one-way ANOVA (Experiment B). Post hoc comparisons were performed where appropriate.
Results
Experiment A
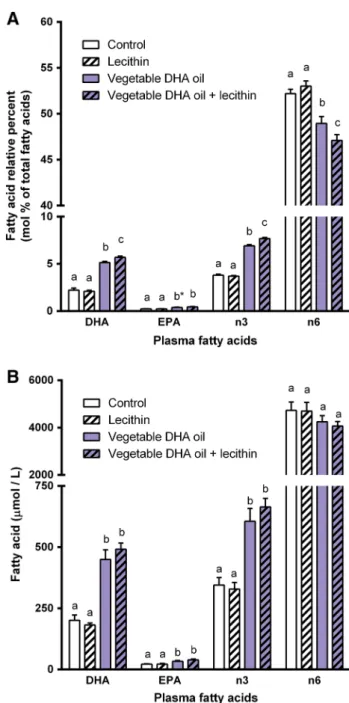
After feeding all animals the control diet for 2 weeks, they were divided into four experimental groups that were matched according to their body weight and food intake. During the supplementation period of 2 weeks body weight was neither affected by dietary DHA supplementation (P = 0.55) nor by dietary lecithin supplementation (P = 0.72). Also no effects on food intake were found (dietary DHA: P = 0.89); dietary lecithin: P = 0.99). Dietary DHA supplementation increased relative plasma levels of DHA (P < 0.001), EPA (P < 0.001), and total n-3 PUFA (P < 0.001), and decreased total n-6 PUFA (P < 0.001). Plasma levels of DHA (P = 0.20), EPA (P = 0.21), and total n-6 PUFA (P = 0.41) were not affected by dietary lecithin supplementation, whereas plasma total n-3 PUFA level (P = 0.007) was affected. Furthermore, interac-tions between dietary DHA and lecithin supplementation were found for plasma DHA (P = 0.039), total n-3 PUFA (P = 0.001), and total n-6 PUFA (P = 0.041), however not for EPA (P = 0.19). These main and interaction effects indi-cate that combined dietary supplementation of DHA oil and lecithin increased the changes induced by DHA supplemen-tation alone (Fig. 1a). Quantitative plasma concentrations of DHA (P < 0.001), EPA (P < 0.001), and total n-3 PUFA (P < 0.001) were also affected by dietary DHA supplementa-tion, whereas total n-6 PUFA (P = 0.078) was not. No effects of dietary lecithin or interactions between dietary DHA and lecithin were found when expressing the plasma fatty acid levels as quantitative concentrations, although trends were apparent (Fig. 1b). Tables 2 and 3 give a complete overview of all plasma fatty acids measured, expressed as relative per-cent levels (Table 2) and quantitative concentrations (Table 3).
Experiment B
Animals were divided into three experimental groups that were matched according to their body weights and
food intake after feeding the animals the control diet for 2 weeks. Body weight (P = 0.78) and food intake (P = 0.47) did not differ between the experimental groups over the course of the 3-week intervention period. Relative
Fig. 1 Experiment A: effects of dietary supplementation of vegeta-ble DHA oil, lecithin or the combination of both on a relative percent levels (mol%) and b quantitative concentrations (µmol/L) of DHA, EPA, total n-3 PUFA, and total n-6 PUFA in plasma of rats. Plasma DHA, EPA, total n-3 PUFA, and total n-6 PUFA levels in rats that received one of the four experimental diets (control, lecithin, veg-etable DHA oil, vegveg-etable DHA oil + lecithin) for 2 weeks. Values are means, with the SEM represented by vertical bars. Different
let-ters indicate mean values were significantly different (P < 0.05). *P = 0.077 vs. vegetable DHA oil + lecithin. n = 6 per experimental group
plasma levels of DHA (P < 0.001), EPA (P < 0.001), total n-3 PUFA (P < 0.001), and total n-6 PUFA (P = 0.023) were affected by the experimental diets (Fig. 2a). Animals fed the fish oil diet displayed increased plasma levels of DHA (P < 0.001), EPA (P < 0.001), and total n-3 PUFA
(P < 0.001), and a decreased plasma total n-6 PUFA level (P = 0.031) as compared to the control diet. The increases in plasma DHA, EPA, total n-3 PUFA were augmented by additional supplementation with lecithin, i.e., plasma DHA (P < 0.001), EPA (P < 0.001), and total n-3 PUFA
Table 2 Experiment A: effects of dietary supplementation of vegetable DHA oil, lecithin or the combination of both on plasma fatty acid composition (mol%) in rats
Values are means ± SEM Plasma fatty acids (mol% of total fatty acids)
Experiment A Dietary intervention
Control Lecithin Vegetable DHA oil Vegetable DHA oil + lecithin 6:0 0.0 ± 0.0 0.0 ± 0.0 0.0 ± 0.0 0.0 ± 0.0 8:0 0.0 ± 0.0 0.0 ± 0.0 0.0 ± 0.0 0.0 ± 0.0 10:0 0.0 ± 0.0 0.0 ± 0.0 0.0 ± 0.0 0.0 ± 0.0 12:0 0.6 ± 0.2 0.7 ± 0.1 0.7 ± 0.1 0.6 ± 0.1 14:0 0.9 ± 0.1 0.9 ± 0.1 1.0 ± 0.1 1.0 ± 0.1 15:0 0.3 ± 0.0 0.3 ± 0.0 0.3 ± 0.0 0.3 ± 0.0 16:0 18.6 ± 0.2 18.6 ± 0.2 19.1 ± 0.3 19.8 ± 0.2 17:0 0.3 ± 0.0 0.3 ± 0.0 0.3 ± 0.0 0.3 ± 0.0 18:0 7.8 ± 0.4 7.6 ± 0.5 7.4 ± 0.4 7.1 ± 0.3 20:0 0.1 ± 0.0 0.1 ± 0.0 0.1 ± 0.0 0.1 ± 0.0 22:0 0.2 ± 0.0 0.2 ± 0.0 0.2 ± 0.0 0.2 ± 0.0 23:0 0.0 ± 0.0 0.0 ± 0.0 0.0 ± 0.0 0.0 ± 0.0 24:0 0.2 ± 0.0 0.2 ± 0.0 0.2 ± 0.0 0.2 ± 0.0 16:1n-7 1.0 ± 0.1 0.8 ± 0.1 1.1 ± 0.1 1.3 ± 0.2 18:1n-7 2.2 ± 0.1 2.0 ± 0.1 2.1 ± 0.2 2.3 ± 0.2 18:1n-9 11.2 ± 0.5 10.9 ± 0.5 11.1 ± 0.5 11.5 ± 0.4 20:1n-9 0.3 ± 0.0 0.3 ± 0.0 0.3 ± 0.0 0.3 ± 0.0 22:1n-9 0.0 ± 0.0 0.0 ± 0.0 0.0 ± 0.0 0.0 ± 0.0 24:1n-9 0.1 ± 0.0 0.1 ± 0.0 0.1 ± 0.0 0.1 ± 0.0 20:3n-9 0.1 ± 0.0 0.0 ± 0.0 0.0 ± 0.0 0.0 ± 0.0 18:2n-6 26.5 ± 1.4 28.3 ± 1.0 27.6 ± 0.7 28.1 ± 0.8 18:3n-6 0.4 ± 0.0 0.3 ± 0.0 0.2 ± 0.0 0.2 ± 0.0 20:2n-6 0.6 ± 0.0 0.6 ± 0.0 0.5 ± 0.0 0.6 ± 0.0 20:3n-6 0.6 ± 0.1 0.6 ± 0.0 0.7 ± 0.0 0.8 ± 0.0 20:4n-6 22.4 ± 1.5 21.8 ± 1.5 19.1 ± 1.3 16.6 ± 1.1 22:4n-6 1.1 ± 0.1 1.0 ± 0.1 0.5 ± 0.0 0.6 ± 0.0 22:5n-6 0.6 ± 0.1 0.4 ± 0.0 0.2 ± 0.0 0.2 ± 0.0 24:2n-6 0.0 ± 0.0 0.0 ± 0.0 0.0 ± 0.0 0.0 ± 0.0 18:3n-3 0.7 ± 0.1 0.8 ± 0.1 0.9 ± 0.1 0.9 ± 0.1 18:4n-3 0.0 ± 0.0 0.0 ± 0.0 0.0 ± 0.0 0.0 ± 0.0 20:5n-3 0.2 ± 0.0 0.2 ± 0.0 0.4 ± 0.0 0.5 ± 0.0 22:5n-3 0.6 ± 0.1 0.5 ± 0.0 0.5 ± 0.0 0.6 ± 0.0 22:6n-3 2.2 ± 0.2 2.1 ± 0.1 5.1 ± 0.1 5.7 ± 0.1 Total SFA 29.1 ± 0.2 29.1 ± 0.1 29.4 ± 0.3 29.6 ± 0.2 Total MUFA 14.8 ± 0.5 14.2 ± 0.7 14.7 ± 0.8 15.5 ± 0.6 Total PUFA 56.1 ± 0.5 56.7 ± 0.6 55.9 ± 0.7 54.8 ± 0.6 Total n-3 PUFA 3.8 ± 0.1 3.7 ± 0.1 6.9 ± 0.1 7.7 ± 0.1 Total n-6 PUFA 52.2 ± 0.5 53.0 ± 0.6 49.0 ± 0.7 47.1 ± 0.6
(P = 0.001) were higher in rats fed the fish oil + lecithin diet as compared to those fed the fish oil diet. Express-ing the plasma fatty acid levels as quantitative concentra-tions revealed similar effects of the fish oil diet and the fish-oil + lecithin diet. Plasma concentrations of DHA
(P < 0.001), EPA (P < 0.001), total n-3 PUFA (P < 0.001), and total n-6 PUFA (P < 0.001) differed between rats fed one of the three experimental diets (Fig. 2b). Com-pared to animals fed the control diet or the Fish oil diet, those fed the fish oil + lecithin diet displayed increased
Table 3 Experiment A: effects of dietary supplementation of vegetable DHA oil, lecithin or the combination of both on plasma fatty acid quantitative concentrations (µmol/L) in rats
Values are means ± SEM Plasma fatty
acids (µmol/L)
Experiment A Dietary intervention
Control Lecithin Vegetable DHA oil Vegetable DHA oil + lecithin 6:0 0.0 ± 0.0 0.0 ± 0.0 0.0 ± 0.0 0.0 ± 0.0 8:0 0.0 ± 0.0 0.0 ± 0.0 0.0 ± 0.0 0.0 ± 0.0 10:0 2.3 ± 1.2 2.4 ± 0.9 2.7 ± 0.6 1.9 ± 0.6 12:0 57.9 ± 18.5 70.2 ± 18.6 65.4 ± 10.8 51.6 ± 6.6 14:0 80.5 ± 15.3 80.9 ± 14.2 88.0 ± 10.9 86.9 ± 7.0 15:0 27.0 ± 2.5 29.7 ± 3.0 25.8 ± 2.2 26.8 ± 1.3 16:0 1700.2 ± 160.4 1658.4 ± 152.8 1669.9 ± 130.7 1711.4 ± 92.3 17:0 28.2 ± 1.5 29.3 ± 1.1 26.6 ± 1.6 26.3 ± 1.4 18:0 698.2 ± 35.0 661.1 ± 17.6 639.6 ± 32.0 615.4 ± 38.9 20:0 9.6 ± 1.2 10.2 ± 1.4 9.4 ± 0.8 8.5 ± 0.4 22:0 18.1 ± 1.7 17.6 ± 1.8 14.1 ± 1.1 14.5 ± 0.4 23:0 3.2 ± 0.8 3.2 ± 0.5 2.9 ± 0.5 3.1 ± 0.2 24:0 18.3 ± 1.2 19.5 ± 2.3 17.4 ± 1.0 17.4 ± 1.0 16:1n-7 91.5 ± 14.0 72.3 ± 12.5 95.7 ± 17.9 110.2 ± 17.5 18:1n-7 205.2 ± 21.5 184.1 ± 22.1 189.7 ± 27.5 201.4 ± 17.6 18:1n-9 1031.2 ± 132.8 984.0 ± 125.9 981.3 ± 114.0 989.7 ± 51.5 20:1n-9 26.7 ± 3.7 27.6 ± 4.2 25.9 ± 3.7 24.5 ± 1.0 22:1n-9 2.3 ± 0.5 2.5 ± 0.5 2.1 ± 0.3 2.2 ± 0.3 24:1n-9 11.0 ± 0.4 12.1 ± 1.3 11.1 ± 0.7 12.2 ± 0.7 20:3n-9 6.7 ± 3.3 2.6 ± 0.4 2.8 ± 1.3 2.8 ± 0.6 18:2n-6 2427.3 ± 292.0 2551.9 ± 303.6 2419.2 ± 202.0 2424.5 ± 126.3 18:3n-6 33.6 ± 3.8 27.9 ± 3.0 21.0 ± 2.3 20.4 ± 2.4 20:2n-6 50.6 ± 5.2 51.6 ± 4.0 44.9 ± 5.1 50.0 ± 2.4 20:3n-6 58.5 ± 7.0 56.4 ± 7.3 61.3 ± 6.4 70.4 ± 3.4 20:4n-6 1996.4 ± 110.1 1887.3 ± 74.0 1635.1 ± 72.7 1433.5 ± 116.6 22:4n-6 102.1 ± 12.6 84.5 ± 5.5 48.3 ± 6.0 50.7 ± 2.6 22:5n-6 57.9 ± 11.9 36.6 ± 1.6 16.0 ± 2.9 16.9 ± 1.0 24:2n-6 3.0 ± 0.5 2.9 ± 0.4 2.2 ± 0.3 1.9 ± 0.2 18:3n-3 69.1 ± 13.4 76.1 ± 14.4 77.4 ± 10.1 76.8 ± 6.4 18:4n-3 2.8 ± 1.0 1.5 ± 0.9 1.3 ± 0.9 0.2 ± 0.2 20:5n-3 21.7 ± 1.6 21.7 ± 3.0 33.5 ± 3.4 39.2 ± 3.7 22:5n-3 50.7 ± 5.0 47.2 ± 3.3 43.6 ± 3.4 56.1 ± 5.0 22:6n-3 200.8 ± 21.6 181.8 ± 7.8 449.8 ± 39.1 491.7 ± 25.0 Total SFA 2643.4 ± 223.7 2582.5 ± 211.7 2561.9 ± 180.8 2563.8 ± 132.2 Total MUFA 1367.9 ± 169.1 1282.6 ± 164.0 1305.9 ± 161.6 1340.2 ± 72.6 Total PUFA 5081.3 ± 380.6 5029.9 ± 392.7 4856.2 ± 308.3 4735.0 ± 220.5 Total n-3 PUFA 345.1 ± 30.2 328.3 ± 27.2 605.5 ± 52.6 664.0 ± 35.3 Total n-6 PUFA 4729.4 ± 352.0 4699.0 ± 365.4 4247.9 ± 256.8 4068.2 ± 188.2 Total fatty acids 9092.6 ± 771.1 8895.0 ± 765.0 8724.0 ± 647.0 8639.0 ± 399.5
plasma concentrations of DHA (P < 0.001 vs. control diet;
P = 0.022 vs. fish oil diet) and EPA (P < 0.001 vs. con-trol diet; P = 0.028 vs. fish oil diet). Tables 4 and 5 give
a complete overview of all plasma fatty acids measured, expressed as relative percent levels (Table 4) and quantita-tive concentrations (Table 5).
Fig. 2 Experiment B: effects of dietary supplementation of fish oil or combined dietary supplementation of fish oil and lecithin on a rela-tive percent levels (mol%) and b quantitarela-tive concentrations (µmol/L) of DHA, EPA, total n-3 PUFA, and total n-6 PUFA in plasma of rats. Plasma DHA, EPA, total n-3 PUFA, and total n-6 PUFA levels in rats that received one of the three experimental diets (control, fish oil, fish oil + lecithin) for 3 weeks. Values are means, with the SEM repre-sented by vertical bars. Different letters indicate mean values were significantly different (P < 0.025). n = 7–8 per experimental group, 1 outlier was omitted from the data
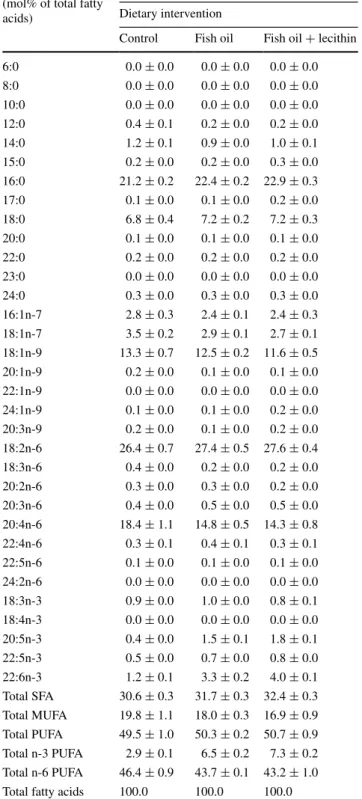
Table 4 Experiment B: effects of dietary supplementation of fish oil or combined dietary supplementation of fish oil and lecithin on plasma fatty acid composition (mol%) in rats
Values are means ± SEM Plasma fatty acids (mol% of total fatty acids)
Experiment B Dietary intervention
Control Fish oil Fish oil + lecithin 6:0 0.0 ± 0.0 0.0 ± 0.0 0.0 ± 0.0 8:0 0.0 ± 0.0 0.0 ± 0.0 0.0 ± 0.0 10:0 0.0 ± 0.0 0.0 ± 0.0 0.0 ± 0.0 12:0 0.4 ± 0.1 0.2 ± 0.0 0.2 ± 0.0 14:0 1.2 ± 0.1 0.9 ± 0.0 1.0 ± 0.1 15:0 0.2 ± 0.0 0.2 ± 0.0 0.3 ± 0.0 16:0 21.2 ± 0.2 22.4 ± 0.2 22.9 ± 0.3 17:0 0.1 ± 0.0 0.1 ± 0.0 0.2 ± 0.0 18:0 6.8 ± 0.4 7.2 ± 0.2 7.2 ± 0.3 20:0 0.1 ± 0.0 0.1 ± 0.0 0.1 ± 0.0 22:0 0.2 ± 0.0 0.2 ± 0.0 0.2 ± 0.0 23:0 0.0 ± 0.0 0.0 ± 0.0 0.0 ± 0.0 24:0 0.3 ± 0.0 0.3 ± 0.0 0.3 ± 0.0 16:1n-7 2.8 ± 0.3 2.4 ± 0.1 2.4 ± 0.3 18:1n-7 3.5 ± 0.2 2.9 ± 0.1 2.7 ± 0.1 18:1n-9 13.3 ± 0.7 12.5 ± 0.2 11.6 ± 0.5 20:1n-9 0.2 ± 0.0 0.1 ± 0.0 0.1 ± 0.0 22:1n-9 0.0 ± 0.0 0.0 ± 0.0 0.0 ± 0.0 24:1n-9 0.1 ± 0.0 0.1 ± 0.0 0.2 ± 0.0 20:3n-9 0.2 ± 0.0 0.1 ± 0.0 0.2 ± 0.0 18:2n-6 26.4 ± 0.7 27.4 ± 0.5 27.6 ± 0.4 18:3n-6 0.4 ± 0.0 0.2 ± 0.0 0.2 ± 0.0 20:2n-6 0.3 ± 0.0 0.3 ± 0.0 0.2 ± 0.0 20:3n-6 0.4 ± 0.0 0.5 ± 0.0 0.5 ± 0.0 20:4n-6 18.4 ± 1.1 14.8 ± 0.5 14.3 ± 0.8 22:4n-6 0.3 ± 0.1 0.4 ± 0.1 0.3 ± 0.1 22:5n-6 0.1 ± 0.0 0.1 ± 0.0 0.1 ± 0.0 24:2n-6 0.0 ± 0.0 0.0 ± 0.0 0.0 ± 0.0 18:3n-3 0.9 ± 0.0 1.0 ± 0.0 0.8 ± 0.1 18:4n-3 0.0 ± 0.0 0.0 ± 0.0 0.0 ± 0.0 20:5n-3 0.4 ± 0.0 1.5 ± 0.1 1.8 ± 0.1 22:5n-3 0.5 ± 0.0 0.7 ± 0.0 0.8 ± 0.0 22:6n-3 1.2 ± 0.1 3.3 ± 0.2 4.0 ± 0.1 Total SFA 30.6 ± 0.3 31.7 ± 0.3 32.4 ± 0.3 Total MUFA 19.8 ± 1.1 18.0 ± 0.3 16.9 ± 0.9 Total PUFA 49.5 ± 1.0 50.3 ± 0.2 50.7 ± 0.9 Total n-3 PUFA 2.9 ± 0.1 6.5 ± 0.2 7.3 ± 0.2 Total n-6 PUFA 46.4 ± 0.9 43.7 ± 0.1 43.2 ± 1.0 Total fatty acids 100.0 100.0 100.0
In RBC, similar differences in levels of DHA, EPA, n-3 PUFA, and n-6 PUFA between the experimental groups were found as obtained in plasma. Relative RBC levels of DHA
(P < 0.001), EPA (P < 0.001), total n-3 PUFA (P < 0.001), and total n-6 PUFA (P < 0.001) also were affected by the experimental diets (Fig. 3). Compared to animals fed the control diet or the fish oil diet, those fed the fish oil + leci-thin diet displayed increased RBC levels of DHA (P < 0.001
vs. control diet; P = 0.009 vs. fish oil diet), EPA (P < 0.001
vs. control diet; P = 0.006 vs. fish oil diet), and total n-3 PUFA (P < 0.001 vs. control diet; P = 0.004 vs. fish oil diet). Table 6 gives a complete overview of all RBC fatty acids measured, expressed as relative percent levels.
Plasma free choline concentration was also affected by the experimental diets (P = 0.030, Fig. 4). In animals receiving the lecithin-containing diet, plasma free choline concentration was higher as compared to those receiv-ing the diets without lecithin (P = 0.049 vs. control diet;
P = 0.012 vs. fish oil diet). Discussion
The present experiments indicate that dietary crude leci-thin can increase the systemic availability of dietary DHA with combined intake. Dietary supplementation of lecithin, which itself does not contain any DHA, increased levels of DHA, EPA, and total n-3 PUFA in plasma and RBC, and
Table 5 Experiment B: effects of dietary supplementation of fish oil or combined dietary supplementation of fish oil and lecithin on plasma fatty acid quantitative concentrations (µmol/L) in rats
Values are means ± SEM Plasma fatty
acids (µmol/L)
Experiment B Dietary intervention
Control Fish oil Fish oil + lecithin 6:0 0.0 ± 0.0 0.0 ± 0.0 0.0 ± 0.0 8:0 0.0 ± 0.0 0.0 ± 0.0 0.0 ± 0.0 10:0 0.0 ± 0.0 0.0 ± 0.0 0.0 ± 0.0 12:0 40.3 ± 13.8 14.9 ± 2.3 12.9 ± 2.8 14:0 104.2 ± 19.2 61.3 ± 4.5 62.7 ± 7.5 15:0 15.0 ± 1.1 16.0 ± 0.9 17.0 ± 1.4 16:0 1726.0 ± 111.3 1462.0 ± 50.1 1471.8 ± 81.1 17:0 9.0 ± 1.3 9.7 ± 2.2 11.6 ± 1.3 18:0 544.7 ± 26.4 470.0 ± 18.4 456.3 ± 13.8 20:0 6.9 ± 0.7 6.3 ± 0.4 6.7 ± 0.6 22:0 18.5 ± 1.1 14.1 ± 1.0 14.8 ± 1.0 23:0 0.0 ± 0.0 0.0 ± 0.0 0.0 ± 0.0 24:0 22.2 ± 0.7 18.5 ± 0.8 21.5 ± 1.2 16:1n-7 230.3 ± 36.0 155.7 ± 7.8 158.2 ± 23.6 18:1n-7 282.9 ± 29.9 187.8 ± 7.7 176.0 ± 16.3 18:1n-9 1101.0 ± 124.7 815.0 ± 38.0 750.9 ± 68.1 20:1n-9 12.6 ± 1.9 8.3 ± 0.5 5.9 ± 1.1 22:1n-9 0.0 ± 0.0 0.0 ± 0.0 0.0 ± 0.0 24:1n-9 9.3 ± 0.5 9.5 ± 0.2 9.8 ± 0.8 20:3n-9 17.6 ± 1.3 9.3 ± 0.8 9.6 ± 0.9 18:2n-6 2151.2 ± 165.7 1793.2 ± 85.1 1768.8 ± 96.2 18:3n-6 29.6 ± 1.2 16.0 ± 1.6 14.0 ± 1.3 20:2n-6 27.4 ± 2.4 17.4 ± 1.4 15.9 ± 1.3 20:3n-6 35.8 ± 2.2 34.2 ± 1.7 33.1 ± 2.1 20:4n-6 1463.9 ± 45.1 963.2 ± 45.5 902.7 ± 16.3 22:4n-6 28.1 ± 9.0 26.9 ± 10.4 17.0 ± 6.9 22:5n-6 9.1 ± 2.9 6.6 ± 0.4 3.7 ± 1.4 24:2n-6 0.0 ± 0.0 0.0 ± 0.0 0.0 ± 0.0 18:3n-3 71.9 ± 8.5 63.7 ± 3.9 50.6 ± 8.4 18:4n-3 0.0 ± 0.0 0.0 ± 0.0 0.0 ± 0.0 20:5n-3 33.8 ± 2.7 96.6 ± 5.0 115.0 ± 7.3 22:5n-3 37.1 ± 2.0 46.7 ± 2.8 49.2 ± 5.3 22:6n-3 92.1 ± 5.0 214.5 ± 11.2 257.7 ± 16.9 Total SFA 2486.9 ± 156.9 2072.6 ± 66.0 2075.2 ± 96.7 Total MUFA 1636.1 ± 187.7 1176.4 ± 52.0 1100.9 ± 107.6 Total PUFA 3997.7 ± 189.1 3288.2 ± 130.7 3237.4 ± 139.2 Total n-3 PUFA 234.9 ± 10.9 421.5 ± 18.7 472.5 ± 35.0 Total n-6 PUFA 3745.2 ± 178.2 2857.4 ± 115.9 2755.2 ± 106.6 Total fatty acids 8120.6 ± 510.0 6537.3 ± 243.6 6413.5 ± 327.5
Fig. 3 Experiment B: effects of dietary supplementation of fish oil or combined dietary supplementation of fish oil and lecithin on relative percent levels (mol%) of DHA, EPA, total n-3 PUFA, and total n-6 PUFA in RBC of rats. RBC DHA, EPA, total n-3 PUFA, and total n-6 PUFA levels in rats that received one of the three experimental diets (control, fish oil, fish oil + lecithin) for 3 weeks. Values are means, with the SEM represented by vertical bars. Different letters indicate mean values were significantly different (P < 0.025). n = 8 per exper-imental group
decreased levels of total n-6 PUFA in plasma of rats fed DHA oil-containing diets. Thus, while dietary lecithin sup-plementation alone did not affect DHA levels in plasma and RBC, lecithin further increased the rise in DHA induced by dietary DHA supplementation (vs. control diets) with up to 61 % (relative levels) and 47 % (quantitative concentration)
in plasma, and with 18 % (relative level) in RBC. Further-more, dietary lecithin, being a source of PtdCho, increased plasma choline concentration with 11 %.
Dietary supplementation of moderate levels of DHA (i.e., 0.2 %), either as vegetable algae oil or as fish oil, affected relative and quantitative plasma levels and relative RBC fatty
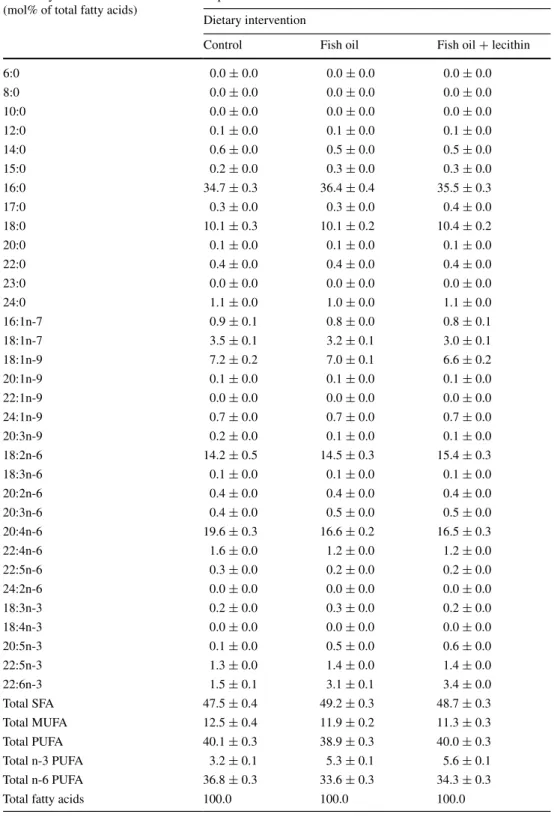
Table 6 Experiment B: effects of dietary supplementation of fish oil or combined dietary supplementation of fish oil and lecithin on RBC fatty acid composition (mol%) in rats
Values are means ± SEM RBC fatty acids (mol% of total fatty acids)
Experiment B Dietary intervention
Control Fish oil Fish oil + lecithin
6:0 0.0 ± 0.0 0.0 ± 0.0 0.0 ± 0.0 8:0 0.0 ± 0.0 0.0 ± 0.0 0.0 ± 0.0 10:0 0.0 ± 0.0 0.0 ± 0.0 0.0 ± 0.0 12:0 0.1 ± 0.0 0.1 ± 0.0 0.1 ± 0.0 14:0 0.6 ± 0.0 0.5 ± 0.0 0.5 ± 0.0 15:0 0.2 ± 0.0 0.3 ± 0.0 0.3 ± 0.0 16:0 34.7 ± 0.3 36.4 ± 0.4 35.5 ± 0.3 17:0 0.3 ± 0.0 0.3 ± 0.0 0.4 ± 0.0 18:0 10.1 ± 0.3 10.1 ± 0.2 10.4 ± 0.2 20:0 0.1 ± 0.0 0.1 ± 0.0 0.1 ± 0.0 22:0 0.4 ± 0.0 0.4 ± 0.0 0.4 ± 0.0 23:0 0.0 ± 0.0 0.0 ± 0.0 0.0 ± 0.0 24:0 1.1 ± 0.0 1.0 ± 0.0 1.1 ± 0.0 16:1n-7 0.9 ± 0.1 0.8 ± 0.0 0.8 ± 0.1 18:1n-7 3.5 ± 0.1 3.2 ± 0.1 3.0 ± 0.1 18:1n-9 7.2 ± 0.2 7.0 ± 0.1 6.6 ± 0.2 20:1n-9 0.1 ± 0.0 0.1 ± 0.0 0.1 ± 0.0 22:1n-9 0.0 ± 0.0 0.0 ± 0.0 0.0 ± 0.0 24:1n-9 0.7 ± 0.0 0.7 ± 0.0 0.7 ± 0.0 20:3n-9 0.2 ± 0.0 0.1 ± 0.0 0.1 ± 0.0 18:2n-6 14.2 ± 0.5 14.5 ± 0.3 15.4 ± 0.3 18:3n-6 0.1 ± 0.0 0.1 ± 0.0 0.1 ± 0.0 20:2n-6 0.4 ± 0.0 0.4 ± 0.0 0.4 ± 0.0 20:3n-6 0.4 ± 0.0 0.5 ± 0.0 0.5 ± 0.0 20:4n-6 19.6 ± 0.3 16.6 ± 0.2 16.5 ± 0.3 22:4n-6 1.6 ± 0.0 1.2 ± 0.0 1.2 ± 0.0 22:5n-6 0.3 ± 0.0 0.2 ± 0.0 0.2 ± 0.0 24:2n-6 0.0 ± 0.0 0.0 ± 0.0 0.0 ± 0.0 18:3n-3 0.2 ± 0.0 0.3 ± 0.0 0.2 ± 0.0 18:4n-3 0.0 ± 0.0 0.0 ± 0.0 0.0 ± 0.0 20:5n-3 0.1 ± 0.0 0.5 ± 0.0 0.6 ± 0.0 22:5n-3 1.3 ± 0.0 1.4 ± 0.0 1.4 ± 0.0 22:6n-3 1.5 ± 0.1 3.1 ± 0.1 3.4 ± 0.0 Total SFA 47.5 ± 0.4 49.2 ± 0.3 48.7 ± 0.3 Total MUFA 12.5 ± 0.4 11.9 ± 0.2 11.3 ± 0.3 Total PUFA 40.1 ± 0.3 38.9 ± 0.3 40.0 ± 0.3 Total n-3 PUFA 3.2 ± 0.1 5.3 ± 0.1 5.6 ± 0.1 Total n-6 PUFA 36.8 ± 0.3 33.6 ± 0.3 34.3 ± 0.3
acid levels as expected. Previous studies, both experimental [4, 5, 18–21] and clinical [3, 22, 23], repeatedly demonstrated that plasma and RBC levels of DHA increase relatively fast in a dose-dependent manner after oral administration of DHA. In human, steady state plasma concentrations of DHA after supplementation is reached within 1 week up to 1 month, whereas for RBC this takes several months [3, 22]. In rats, fatty acid levels in plasma and RBC represents dietary intake of fats over a relatively short-term period of 1–4 weeks [24]. Hence, the plasma and RBC samples from the rats in the cur-rent study reflect the effects of the changes in dietary pattern (i.e., changes dietary DHA-containing oils and lecithin con-tent) over the weeks of the applied supplementation period.
Dietary crude lecithin is a source of active compounds as it is digested into fatty acids, lysophospholipids, phospha-tidic acid, glycerol, monoglycerides, and other compounds, including choline and ethanolamine. These digestion prod-ucts are subsequently absorbed and further metabolized. For example, the intake of lecithin has been shown to increase serum levels of choline in humans [25] and rats [26]. In Experiment B, it was confirmed that lecithin supplementa-tion increases plasma choline concentrasupplementa-tion in rats.
Systemic DHA is known to be transferred across the blood–brain barrier, as shown in both experimental [27, 28] and clinical studies [6, 29, 30]. In fact, dietary supplemen-tation with DHA (in various formulas) has repeatedly been
shown to affect membrane composition [5, 18, 31–39], thereby influencing its biophysical properties. A high level of n-3 PUFA in neuronal membranes is associated with favorable effects on numerous membrane-dependent pro-cesses and thus neuronal functioning [1, 2]. Likewise, small increases in plasma choline can exert significant effects on brain choline levels [40], and in fact, lecithin intake has been shown to increase both plasma and brain choline lev-els in the rat [26]. Brain choline levels in turn control the rates at which it is utilized to form acetylcholine [41, 42]. In addition, DHA, EPA and choline [43–45] are known pre-cursors for phospholipid synthesis needed for membrane formation and integrity. By increasing the systemic avail-ability of dietary DHA and by increasing the systemic lev-els of choline, dietary lecithin putatively leads to increased uptake of DHA and choline into the brain, with subsequent effects on neuronal membrane formation and function.
Fig. 4 Experiment B: effects of dietary supplementation of fish oil or combined dietary supplementation of fish oil and lecithin on rat plasma free choline concentration (µmol/L). Plasma free choline con-centration in rats that received one of the three experimental diets for 3 weeks (control, fish oil, fish oil + lecithin). Values are means, with the SEM represented by vertical bars. Different letters indicate mean values were significantly different (P < 0.05). n = 8 per experimental group
Fig. 5 Schematic representation of the effects of dietary phospho-lipids on enhancing the absorption of dietary n-3 PUFA from the gut into the enterocytes and the lymph. Dietary phospholipids may increase the bioavailability of dietary n-3 PUFA by facilitating emul-sification (1) and by increasing chylomicron formation (2). Figure is adapted from van Wijk et al. [54] with permission from IOS press. PL dietary phospholipids
The effects of lecithin supplementation on the systemic availability of dietary n-3 PUFA might be explained by an increased absorption from the gut into the enterocytes and the lymph. Dietary phospholipids could enhance the absorption of n-3 PUFA from the gut, since they are known to facilitate the emulsification of dietary fat in the lumen and subsequent micelle formation for absorption into the enterocytes [8, 46]. Moreover, dietary phospholipids may increase the intestinal uptake of fat by increasing the for-mation of chylomicrons in enterocytes and their secretion into the lymph [7, 10]. In the current study, the highest per-centage increases in DHA were found in Experiment B in which a higher dose of crude lecithin was used (0.4 % in Experiment A and 1.0 % in Experiment B), possibly indi-cating dose-dependency. Figure 5 shows a schematic repre-sentation of these effects of dietary phospholipids.
Several investigators have previously attempted to demonstrate additive effects of lecithin or phospholipids or other emulsifiers on the bioavailability of triglycerides after oral intake in various models and using different approaches. Various studies thereby focused on the effects of pre-emulsification of oil with various emulsifiers, includ-ing lecithin [13–15, 47–49]. These studies distinctly show that single oral administration of pre-emulsified oil has a better bioavailability than non-emulsified oil. For exam-ple, Nishimukai et al. showed that duodenal infusion of an emulsion of triglycerides plus lecithin induces higher portal plasma triglycerides as compared to infusion of triglycer-ides alone [10]. In one study, the incorporation of radiola-beled DHA into various rat tissues were measured after a single dose of orally gavaged radiolabeled DHA, with or without administration of phospholipids (without emulsifi-cation), and showed no differential effects on the level of radiolabeled DHA in whole blood after 24 h [11]. Studies examining the effects of combined dietary supplementation of lecithin or phospholipids and (non-emulsified) triglycer-ides on systemic availability of triglycertriglycer-ides are scarcer. An experiment in fish (carps) demonstrated stimulated intes-tinal triglyceride uptake into plasma when dietary triglyc-erides were combined with dietary phospholipids [9]. In contrast, Lim et al. did not find increased amounts of DHA in plasma after combined dietary supplementation with DHA and phospholipids compared to supplementation with DHA alone [18]. However, in this study DHA content of the diet with both DHA and phospholipid was half of the DHA diet, which makes the diets’ efficacy impossible to compare. Other investigators have tried to show superiority of DHA-containing phospholipids (i.e., phospholipids with DHA as one of the fatty acid chains) over DHA-contain-ing triglycerides to increase tissue levels of DHA in both preclinical and clinical experiments [11, 21, 50–53]. None
of these studies showed differences in plasma DHA levels after supplementing with DHA-containing phospholipids as compared to DHA-containing triglycerides, although some studies did reveal superiority of DHA-containing phospholipids on DHA levels in other tissues, such as RBC [21, 53] and the brain [11, 53]. Nevertheless, most studies concluded that the absorption into the bloodstream is inde-pendent of type of DHA (as phospholipid or as triglycer-ide). The present study actually shows that supplementation of lecithin, i.e., phospholipids, further increases the rise in systemic DHA induced by dietary DHA supplementation.
It should be noted that the present experiments were each conducted under different experimental conditions. Most important differences were the amounts of lecithin supplemented to the diet (0.4 vs. 1.0 %), supplementation periods (2 vs. 3 weeks), DHA-containing oils (vegetable algae DHA oil vs. fish oil), rat strain (Wistar vs. Sprague– Dawley), diet base (grain-based vs. AIN-93M-based), and diet manufacturer (Research Diet Services and Ssniff Spe-zialdiäten). However, despite the differences in experimen-tal conditions, the results from both experiments are highly consistent with some small differences in effects sizes. For example, in Experiment B a significant additional effect of dietary lecithin supplementation on top of dietary DHA supplementation on relative plasma DHA level and quanti-tative plasma DHA concentration were observed, whereas in Experiment A this additional effect was only observed on relative plasma DHA level. Overall, the experiments demonstrate a substantial effect of combined dietary sup-plementation of lecithin and DHA on plasma and RBC lev-els of DHA, EPA, n-3 PUFA, and n-6 PUFA.
Important to consider when extrapolating the current results to a human setting is the physiological difference between rats and human. Rats have a continuous release of hepatic bile as opposed to burst release of gall bile in humans. Whether this physiological difference has an impact on the effects of lecithin supplementation is diffi-cult to predict. In addition, for a better interpretation of the current results, future preclinical experiments should also incorporate measurements in other important lipid pools that either influence the plasma lipid pool (e.g., the liver) or that are influenced by the plasma lipid pool (e.g., the brain).
Dietary DHA-containing oils and crude lecithin have synergistic effects on increasing plasma and RBC n-3 PUFA levels, including DHA and EPA. By increasing the systemic availability of dietary DHA, dietary lecithin may increase the efficacy of DHA supplementation when their intake is combined. Lecithin itself also raises plasma cho-line concentration. Therefore, combined supplementation of lecithin and DHA may be relevant in conditions that are associated with lower levels of plasma DHA and choline.
Acknowledgments The authors thank Dr. M. C. de Wilde and for useful discussions and for carefully reading the manuscript. The research as described in this paper was funded by Nutricia Research. Compliance with Ethical Standards
Conflict of interest NvW, MB, JWCS, and LMB are employees of Nutricia Research. MC is a scientific consultant to Nutricia Research. TJM has received a reimbursement for costs of analyses.
Open Access This article is distributed under the terms of the Crea-tive Commons Attribution 4.0 International License ( http://creativecom-mons.org/licenses/by/4.0/), which permits unrestricted use, distribution, and reproduction in any medium, provided you give appropriate credit to the original author(s) and the source, provide a link to the Creative Commons license, and indicate if changes were made.
References
1. Mielke MM, Lyketsos CG (2006) Lipids and the pathogen-esis of Alzheimer’s disease: is there a link? Int Rev Psychiatry 18:173–186
2. Yehuda S, Rabinovitz S, Carasso RL, Mostofsky DI (2002) The role of polyunsaturated fatty acids in restoring the aging neu-ronal membrane. Neurobiol Aging 23:843–853
3. Arterburn LM, Hall EB, Oken H (2006) Distribution, intercon-version, and dose response of n-3 fatty acids in humans. Am J Clin Nutr 83:1467S–1476S
4. Hashimoto M, Tanabe Y, Fujii Y, Kikuta T, Shibata H, Shido O (2005) Chronic administration of docosahexaenoic acid amelio-rates the impairment of spatial cognition learning ability in amy-loid beta-infused rats. J Nutr 135:549–555
5. Connor WE, Neuringer M, Lin DS (1990) Dietary effects on brain fatty acid composition: the reversibility of n-3 fatty acid deficiency and turnover of docosahexaenoic acid in the brain, erythrocytes, and plasma of rhesus monkeys. J Lipid Res 31:237–247
6. Umhau JC, Zhou W, Carson RE, Rapoport SI, Polozova A, Demar J, Hussein N, Bhattacharjee AK, Ma K, Esposito G, Majchrzak S, Herscovitch P, Eckelman WC, Kurdziel KA, Salem N Jr (2009) Imaging incorporation of circulating docosahexae-noic acid into the human brain using positron emission tomogra-phy. J Lipid Res 50:1259–1268
7. O’Doherty PJ, Kakis G, Kuksis A (1973) Role of luminal leci-thin in intestinal fat absorption. Lipids 8:249–255
8. Werner A, Havinga R, Perton F, Kuipers F, Verkade HJ (2006) Lymphatic chylomicron size is inversely related to biliary phos-pholipid secretion in mice. Am J Physiol Gastrointest Liver Physiol 290:G1177–G1185
9. Geurden I, Kaushik S, Corraze G (2008) Dietary phosphatidyl-choline affects postprandial plasma levels and digestibility of lipid in common carp (Cyprinus carpio). Br J Nutr 100:512–517 10. Nishimukai M, Hara H (2007) Soybean
phosphatidylcholine-induced enhancement of lymphatic absorption of triglyceride depends on chylomicron formation in rats. Biosci Biotechnol Biochem 71:1192–1197
11. Graf BA, Duchateau GS, Patterson AB, Mitchell ES, van Bruggen P, Koek JH, Melville S, Verkade HJ (2010) Age depend-ent incorporation of 14C-DHA into rat brain and body tissues after dosing various 14C-DHA-esters. Prostaglandins Leukot Essent Fatty Acids 83:89–96
12. Lim SY, Suzuki H (2000) Intakes of dietary docosahexae-noic acid ethyl ester and egg phosphatidylcholine improve
maze-learning ability in young and old mice. J Nutr 130:1629–1632
13. Sugasini D, Devaraj VC, Ramesh M, Lokesh BR (2014) Lym-phatic transport of α-linolenic acid and its conversion to long chain n-3 fatty acids in rats fed microemulsions of linseed oil. Lipids 49:225–233
14. Couedelo L, Amara S, Lecomte M, Meugnier E, Monteil J, Fon-seca L, Pineau G, Cansell M, Carriere F, Michalski MC, Vaysse C (2015) Impact of various emulsifiers on ALA bioavailability and chylomicron synthesis through changes in gastrointestinal lipolysis. Food Funct 6:1726–1735
15. Couedelo L, Boue-Vaysse C, Fonseca L, Montesinos E, Djouk-itch S, Combe N, Cansell M (2011) Lymphatic absorption of α-linolenic acid in rats fed flaxseed oil-based emulsion. Br J Nutr 105:1026–1035
16. Bligh EG, Dyer WJ (1959) A rapid method of total lipid extrac-tion and purificaextrac-tion. Can J Biochem Physiol 37:911–917 17. Christie WW (1993) Preparation of ester derivatives of fatty
acids for chromatographic analysis. In: Christie WW (ed) Advances in lipid methodology, vol 2. Oily Press, Dundee 18. Lim SY, Suzuki H (2000) Effect of dietary docosahexaenoic acid
and phosphatidylcholine on maze behavior and fatty acid com-position of plasma and brain lipids in mice. Int J Vitam Nutr Res 70:251–259
19. Lim SY, Suzuki H (2002) Dose–response effect of docosahexae-noic acid ethyl ester on maze behavior and brain fatty acid com-position in adult mice. Int J Vitam Nutr Res 72:77–84
20. Gamoh S, Hashimoto M, Sugioka K, Shahdat HM, Hata N, Misawa Y, Masumura S (1999) Chronic administration of doco-sahexaenoic acid improves reference memory-related learning ability in young rats. Neuroscience 93:237–241
21. Valenzuela A, Nieto S, Sanhueza J, Nunez MJ, Ferrer C (2005) Tissue accretion and milk content of docosahexaenoic acid in female rats after supplementation with different docosahexae-noic acid sources. Ann Nutr Metab 49:325–332
22. Kuratko CN, Salem N Jr (2009) Biomarkers of DHA status. Prostaglandins Leukot Essent Fatty Acids 81:111–118
23. Plourde M, Chouinard-Watkins R, Vandal M, Zhang Y, Lawrence P, Brenna JT, Cunnane SC (2011) Plasma incorporation, appar-ent retroconversion and beta-oxidation of 13C-docosahexaenoic acid in the elderly. Nutr Metab (Lond) 8:5
24. Calviello G, Palozza P, Franceschelli P, Bartoli GM (1997) Low-dose eicosapentaenoic or docosahexaenoic acid administration modifies fatty acid composition and does not affect suscepti-bility to oxidative stress in rat erythrocytes and tissues. Lipids 32:1075–1083
25. Wurtman RJ, Hirsch MJ, Growdon JH (1977) Lecithin consump-tion raises serum-free-choline levels. Lancet 2:68–69
26. Magil SG, Zeisel SH, Wurtman RJ (1981) Effects of ingesting soy or egg lecithins on serum choline, brain choline and brain acetylcholine. J Nutr 111:166–170
27. Brossard N, Croset M, Lecerf J, Pachiaudi C, Normand S, Chir-ouze V, Macovschi O, Riou JP, Tayot JL, Lagarde M (1996) Met-abolic fate of an oral tracer dose of [13C] docosahexaenoic acid triglycerides in the rat. Am J Physiol 270:R846–R854
28. Rapoport SI, Chang MC, Spector AA (2001) Delivery and turno-ver of plasma-derived essential PUFAs in mammalian brain. J Lipid Res 42:678–685
29. Freund Levi Y, Vedin I, Cederholm T, Basun H, Faxen Irving G, Eriksdotter M, Hjorth E, Schultzberg M, Vessby B, Wahlund LO, Salem N Jr, Palmblad J (2014) Transfer of omega-3 fatty acids across the blood–brain barrier after dietary supplementation with a docosahexaenoic acid-rich omega-3 fatty acid preparation in patients with Alzheimer’s disease: the OmegAD study. J Intern Med 275:428–436
30. Quinn JF, Raman R, Thomas RG, Yurko-Mauro K, Nelson EB, Van Dyck C, Galvin JE, Emond J, Jack CR Jr, Weiner M, Shinto L, Aisen PS (2010) Docosahexaenoic acid supplementation and cognitive decline in Alzheimer disease: a randomized trial. JAMA 304:1903–1911
31. Aid S, Vancassel S, Linard A, Lavialle M, Guesnet P (2005) Dietary docosahexaenoic acid [22:6(n-3)] as a phospholipid or a triglyceride enhances the potassium chloride-evoked release of acetylcholine in rat hippocampus. J Nutr 135:1008–1013 32. Favreliere S, Perault MC, Huguet F, De Javel D, Bertrand N,
Piriou A, Durand G (2003) DHA-enriched phospholipid diets modulate age-related alterations in rat hippocampus. Neurobiol Aging 24:233–243
33. Hashimoto M, Hossain S, Shimada T, Shido O (2006) Doco-sahexaenoic acid-induced protective effect against impaired learning in amyloid beta-infused rats is associated with increased synaptosomal membrane fluidity. Clin Exp Pharmacol Physiol 33:934–939
34. Hiratsuka S, Koizumi K, Ooba T, Yokogoshi H (2009) Effects of dietary docosahexaenoic acid connecting phospholipids on the learning ability and fatty acid composition of the brain. J Nutr Sci Vitaminol (Tokyo) 55:374–380
35. Shahdat H, Hashimoto M, Shimada T, Shido O (2004) Synap-tic plasma membrane-bound acetylcholinesterase activity is not affected by docosahexaenoic acid-induced decrease in mem-brane order. Life Sci 74:3009–3024
36. Vaisman N, Pelled D (2009) n-3 phosphatidylserine attenuated scopolamine-induced amnesia in middle-aged rats. Prog Neu-ropsychopharmacol Biol Psychiatry 33:952–959
37. Broersen LM, Kuipers AA, Balvers M, van Wijk N, Savelkoul PJ, de Wilde MC, van der Beek EM, Sijben JW, Hageman RJ, Kamphuis PJ, Kiliaan AJ (2013) A specific multi-nutrient diet reduces Alzheimer-like pathology in young adult AbetaPPswe/ PS1dE9 mice. J Alzheimers Dis 33:177–190
38. de Wilde MC, Hogyes E, Kiliaan AJ, Farkas T, Luiten PG, Far-kas E (2003) Dietary fatty acids alter blood pressure, behavior and brain membrane composition of hypertensive rats. Brain Res 988:9–19
39. Carrie I, Clement M, de Javel D, Frances H, Bourre JM (2000) Specific phospholipid fatty acid composition of brain regions in mice. Effects of n-3 polyunsaturated fatty acid deficiency and phospholipid supplementation. J Lipid Res 41:465–472
40. Klein J, Koppen A, Loffelholz K (1990) Small rises in plasma choline reverse the negative arteriovenous difference of brain choline. J Neurochem 55:1231–1236
41. Cohen EL, Wurtman RJ (1976) Brain acetylcholine: control by dietary choline. Science 191:561–562
42. Wurtman RJ, Hefti F, Melamed E (1980) Precursor control of neurotransmitter synthesis. Pharmacol Rev 32:315–335
43. Cansev M, Wurtman RJ (2007) Chronic administration of doco-sahexaenoic acid or eicosapentaenoic acid, but not arachidonic acid, alone or in combination with uridine, increases brain phos-phatide and synaptic protein levels in gerbils. Neuroscience 148:421–431
44. Cansev M, van Wijk N, Turkyilmaz M, Orhan F, Sijben JW, Broersen LM (2015) A specific multi-nutrient enriched diet enhances hippocampal cholinergic transmission in aged rats. Neurobiol Aging 36:344–351
45. Wurtman RJ, Cansev M, Sakamoto T, Ulus IH (2009) Use of phosphatide precursors to promote synaptogenesis. Annu Rev Nutr 29:59–87
46. Jones DB, Hancock JD, Harmon DL, Walker CE (1992) Effects of exogenous emulsifiers and fat sources on nutrient digestibility, serum lipids, and growth performance in weanling pigs. J Anim Sci 70:3473–3482
47. Garaiova I, Guschina IA, Plummer SF, Tang J, Wang D, Plum-mer NT (2007) A randomised cross-over trial in healthy adults indicating improved absorption of omega-3 fatty acids by pre-emulsification. Nutr J 6:4
48. Raatz SK, Redmon JB, Wimmergren N, Donadio JV, Bibus DM (2009) Enhanced absorption of n-3 fatty acids from emul-sified compared with encapsulated fish oil. J Am Diet Assoc 109:1076–1081
49. Vors C, Pineau G, Gabert L, Drai J, Louche-Pelissier C, Defoort C, Lairon D, Desage M, Danthine S, Lambert-Porcheron S, Vidal H, Laville M, Michalski MC (2013) Modulating absorption and postprandial handling of dietary fatty acids by structuring fat in the meal: a randomized crossover clinical trial. Am J Clin Nutr 97:23–36
50. Sala-Vila A, Campoy C, Castellote AI, Garrido FJ, Rivero M, Rodriguez-Palmero M, Lopez-Sabater MC (2006) Influence of dietary source of docosahexaenoic and arachidonic acids on their incorporation into membrane phospholipids of red blood cells in term infants. Prostaglandins Leukot Essent Fatty Acids 74:143–148
51. Sala-Vila A, Castellote AI, Campoy C, Rivero M, Rodriguez-Palmero M, Lopez-Sabater MC (2004) The source of long-chain PUFA in formula supplements does not affect the fatty acid com-position of plasma lipids in full-term infants. J Nutr 134:868–873 52. Vaisman N, Kaysar N, Zaruk-Adasha Y, Pelled D, Brichon
G, Zwingelstein G, Bodennec J (2008) Correlation between changes in blood fatty acid composition and visual sustained attention performance in children with inattention: effect of dietary n-3 fatty acids containing phospholipids. Am J Clin Nutr 87:1170–1180
53. Liu L, Bartke N, Van Daele H, Lawrence P, Qin X, Park HG, Kothapalli K, Windust A, Bindels J, Wang Z, Brenna JT (2014) Higher efficacy of dietary DHA provided as a phospholipid than as a triglyceride for brain DHA accretion in neonatal piglets. J Lipid Res 55:531–539
54. van Wijk N, Broersen LM, de Wilde MC, Hageman RJ, Groenendijk M, Sijben JW, Kamphuis PJ (2014) Targeting syn-aptic dysfunction in Alzheimer’s disease by administering a spe-cific nutrient combination. J Alzheimers Dis 38:459–479