Earthquake Nucleation and Rupture at a Range of
Scales: Laboratories, Gold Mines, and Subduction
Zones
by
Eliza Bonham Richardson
A.B., Princeton University (1996)
Submitted to the Department of Earth, Atmospheric, & Planetary
Sciences
in partial fulfillment of the requirements for the degree of
Doctor of Philosophy
at the
MASSACHUSETTS INSTITUTE OF TECHNOLOGY
June 2002
@
Massachusetts Institute of Technology 2002. All rights reserved.
A u th or ...
Department of Earth, Atmospheric, & Planetary Sciences
March 5, 2002
Certified by...
Thomas H. Jordan
Professor
Thesis Supervisor
Accepted by ...
LIBRARIES
Ronald G. Prinn
Department Head
NEarthquake Nucleation and Rupture at a Range of Scales:
Laboratories, Gold Mines, and Subduction Zones
by
Eliza Bonham Richardson
Submitted to the Department of Earth, Atmospheric, & Planetary Sciences on March 5, 2002, in partial fulfillment of the
requirements for the degree of Doctor of Philosophy
Abstract
We measured spectral and time-domain properties of seismic events over a size range that spans magnitudes M r -2 to 8 in order to study earthquake source processes. In addition, we conducted laboratory experiments to study interseismic behaviors that can influence earthquake nucleation and we developed a model of eathquake rupture to explain the scaling behaviors we observe. To bridge the scale gap between laboratory data and global seismic observations, we studied data from five deep gold mines in the Far West Rand region of South Africa. These mines are seismically active due to daily underground blasting and record a 1000 events per day from -2
<
M<
3+ close to their sources. Frequency-magnitude relations, spatio-temporal clustering relations and observations of seismic spectra provide evidence that there are two types of events that occur in these mines, which we designate as Type A and Type B.Type-A events are fracture-dominated ruptures of previously intact rock and show an upper magnitude cutoff at M e 0.5. They are tightly clustered in space and time and occur close to active stope faces. They have scaling properties that agree with other studies of fresh-fracturing seismicity in that apparent stress decreases with magnitude and stress drop increases with magnitude. In contrast, Type-B events are temporally and spatially distributed throughout the active mining region. They have a lower magnitude cutoff at M e 0. From frictional scaling laws and observations of source spectra, we deduce that that this lower magnitude cutoff represents the critical patch size for earthquake nucleation in this mining environment. We find that the critical patch size is on the order of 10 m with a critical slip distance on the order of 10-4 m. Type-B events have scaling properties that match extrapolations from tectonic earthquakes. For example, apparent stress and particle velocity increase with magnitude. We develop a kinematic model of increasing rupture velocity with increasing source size to account for the observed scaling of frictional shear events.
Thesis Supervisor: Thomas H. Jordan Title: Professor
Acknowledgments
I owe a great deal of thanks to the many individuals without whose support, advice, assistance, discussions, love, and good humor I would not have been able to complete my graduate studies nearly as effectively or happily. First and foremost I must thank the members of my family. I look forward to every day spent now and in the future growing together with Chris, Vicki, and Dan Marone. My parents Bon and Linda Richardson continue to support my endeavors in all fields. My sister Lucy Richardson will always be an inspiration to me because she downplays her many talents and is the fun engaging person the rest of us have to try so hard to be. I would not have looked forward to my visits to USC for the end game of papers and this thesis nearly so much without the hospitality of my aunt and uncle Barb and Joe Davis.
I probably learned more science from being in the company of my fellow grad students and Jordan group members than from any other source. In particular, thanks to Jeff McGuire, Frederik Simons, Margaret Boettcher, Keli KAirason, Clint Conrad, Jim Gaherty. Rafi Katzmann, Jun Korenaga, Kevin Frye, Steve Karner, Karen Mair, Hugh Cox, Oded Aharonson, Maureen Long, Li Zhao, and Liangjun Chen. In addition, Mark Behn and Noah Snyder contributed to my New England education by sharing with me the ins and outs of the special and depressing world of
Red Sox nation.
I made several trips to South Africa during the course of my research and I am grateful to many people there for their assistance. I (probably literally) wouldn't have survived without Sue Webb. She, Lew Ashwal, and Mike Knoper gave me a fun place to stay on weekends, good scientific advice, all the 100's and 1000's bars I could eat, and listened to my conspiracy theories involving espionage at Wits University. I thank the miners and seismologists at Western Deep Levels for taking me on the many underground visits, copying data for me and providing me with all the background details necessary to understand the workings of the gold mines. I am especially
indebted to Dragan Amidzic, Vlok Visser, Lindsay Andefsen, Friedemann Essrich, Gerard Finnie, and Alan Naismith. I learned quite a bit about the field of mining seismology from those at ISSI, including Alex Mendecki, Gerrie Van Aswegen, and Willem DeBeer. I had useful discussions with Steve Spottiswoode and Ewan Sellers at Miningtek and with Dave Ortlepp.
Thanks to Tom Jordan whose creative vision in seismology fueled our work to-gether. Tom's time is always at a premium and I was fortunate that he spent so much of it with me at MIT, in the field, at meetings, and at USC. Thanks to my committee: Maria Zuber, Greg Hirth, Rob van der Hilst, and Wiki Royden.
I continue to profit from discussions with all the other scientists I have met during my time at MIT, including Chris, of course, Jim Rice, Renata Dmowska, Norm Sleep, Rachel Abercrombie, Bill Ellsworth, Demian Saffer, Nick Beeler, Mike Blanpied, Terry Tullis, Joan Gomberg, and John Vidale. I am looking forward to the road ahead at Penn State and I've already had the pleasure of interacting with the grad students and faculty there. They have made the transition easy and fun. '
It was no doubt difficult for the EAPS administrative staff to deal with an ab-sentee student and advisor in these last semesters, but they did an admirable job of everything from faxing the necessary paperwork to registering me for classes to keeping me informed about t'he status of elevator #3.
Contents
1 Introduction
2 Effects of Normal Stress Vibrations on Frictional Healing 2.1 Introduction . . . .
2.2 Experimental Procedure . . . . 2.3 Data and Observations . . . . 2.3.1 Effects of Displacement . . . . . 2.3.2 Normal Stress Steps . . . . 2.3.3 Normal Stress Vibrations . . . . 2.4 Discussion . . . . 2.4.1 Displacement . . . . . . . 2.4.2 Normal Stress Steps . . . . 2.4.3 Normal Stress Oscillations . . . 2.4.4 Micromechanical Interpretation 2.4.5 Relevance to Tectonic Faults . . 2.5 Conclusions . . . .
3 Two Types of Mining-Induced Seismicity 3.1 Introduction . . . . 3.2 Mine Attributes . . . . 3.3 Frequency-Magnitude Statistics . . . . 3.4 A physical model for bimodal seismicity
3.4.1 Spatio-temporal Relationships . . . . . 1 4 . . . . 1 6 . . . . 1 7 . . . . 1 8 . . . . 2 3 . . . . 2 8 . . . . 3 6 . . . . 3 8 . . . . 4 0 . . . . 4 3 . . . . 4 9 . . . . 5 1 . . . . 5 3 55 55 56 71 75 77
3.4.2 Mechanisms . . . . 3.5 Conclusions . . . .
4 The Critical Earthquake
4.1 Introduction . . . . 4.2 Estimate of the Critical Slip Distance . . . . 4.3 Upper Frequency Cutoff . . . . 4.4 Discussion . . . .
5 Scaling Properties of Mining-Induced Seismicity
5.1 Introduction . . . . 5.2 Catalog Methodology . . . . 5.3 Catalog Verification . . . . 5.4 Scaling of Type-A and Type-B Events . . . . 5.5 Implication of Source Scaling for Earthquake Rupture . . . . 5.5.1 Observations of Apparent Stress and Stress Drop . . . . . 5.5.2 Scaling Relations for an Expanding Circular Crack . . . . 5.5.3 Observations of Ground Motion . . . . 5.6 C onclusions . . . .
6 Low-Frequency Properties of Intermediate-Focus Earthquakes 6.1 Introduction . . . . 6.2 O bservations . . . . 6.2.1 Example Events . . . . 6.2.2 Comparison with the Harvard CMT catalog. . . . . 6.2.3 Spectral properties . . . . 6.2.4 Mechanism properties . . . . 6.3 D iscussion . . . .. 6.4 Conclusions . . .
7 Summary and Future Research
81 83 84 84 84 86 89 93 93 93 95 98 99 101 105 110 116 119 120 121 123 128 130 132 137 . . . . 140 . . . . . . 142
A Source Parameters of Reprocessed Mine Events
B Source Parameters of Intermediate-Focus Earthquakes 154
C Sensitivity Tests for Rupture Velocity Scaling Model 163
C.1 Introduction . . . . 163
C.2 Optimal Choice of Parameters as Presented in Chapter 5 . . . . 164
C.3 Omitting M* . . . . 166 C.4 Sensitivity to choice of M* . . . . 167 C.5 Sensitivity to choice of Au . . . . 174 C.6 Sensitivity to choice of G . . . . 176 C.7 Sensitivity to choice of
#
. . . . 176 C .8 Conclusions . . . . 178 145Chapter 1
Introduction
The initiation and propagation of material flaws is a phenomenon that occurs at a wide continuum of scale lengths: from lattice dislocations at the atomic level to the great earthquakes that rift the crust. The physics of earthquake processes is most of-ten studied at two endmember size ranges - at large (kilometer) scales through direct seismic observations or at small (micron) scales in experimental laboratory work on fault frictional properties. Seismic waves are usually recorded on regional seismome-ter networks located kilomeseismome-ters or more from the earthquake hypocenseismome-ters, limiting the resolution of these data to scales of faulting that are typically greater than 100 m, corresponding to events with M > 2, in which M is moment magnitude as defined by Hanks and Kanamori [1979]. As an example of seismology at large scales, Chapter 6 of this thesis details the source mechanisms of over 100 intermediate-focus (50-300 km depth) large (M > 6) earthquakes recorded by global networks. Experiments under controlled laboratory conditions are feasible only on synthetic faults with dimensions less than about 1 m (M < -2). These experiments are nonetheless crucial for under-standing basic fault properties and the mechanics of brittle failure that occur during earthquakes. Chapter 2 describes a set of such laboratory experiments carried out in order to study the effect of transient stresses on faults during the earthquake cycle.
Studying large tectonic events and laboratory fault zones alone results in an ob-servational gap in the sampling of seismic processes that spans about four orders of
magnitude in event size. Considerable progress has been made to shrink this gap using local arrays, e.g. Rubin et al. [1999] and instrumented boreholes, e.g.
Aber-crombie [1995]; Nadeau and Johnson [1998]; Nadeau and McEvilly [1999]; Prejean and Ellsworth [2001]. These studies recorded seismicity down to M -1 and have pro-duced important results in extending and improving our knowledge of source scaling and fault behavior.
Such small-magnitude events are also of interest in the study of earthquake nu-cleation and the related phenomena of slip and stress heterogeneity on faults. The initiation of rapidly propagating shear ruptures on weak faults is thought to be gov-erned by a critical slip distance De over which fault friction drops from a static to a dynamic value [Ida, 1972; Andrews, 1976a; Dieterich, 1986; Scholz, 1988]. Con-stitutive rate- and state-dependent friction laws have been used to model laboratory data [Dieterich, 1979; Ruina, 1983]; they yield estimates of De for bare surfaces on the order of 10-- m [Marone and Kilgore, 1993; Marone, 1998a]. According to slip-weakening models, nucleation proceeds quasi-statically at an overstressed point on a fault until the slipping patch reaches a critical radius rc, when dynamic rupture will begin [Ida, 1973; Palmer and Rice, 1973; Andrews, 1976a; Dieterich, 1979]. These models treat De as the nucleation distance over which slip is incurred on a finite process zone ahead of a propagating crack tip, which for friction-dominated ruptures scales with the critical nucleation patch size. This inner dynamical scale specifies a minimum earthquake magnitude Mmin. For example, a stress drop Ao- = 0.3 MPa, a shear modulus G = 30 GPa and a Dc = 10- m, yields rc ~ (G/Ao-)Dc ~ 1 m, corresponding to Mmin ~~ -2.2. Events of this magnitude are far below the detection thresholds of most surface seismometer and strainmeter networks.
It is not clear how best to extrapolate laboratory results to the scales of crustal faults. Large values of Dc (> 10 cm) have been inferred from the high-frequency spectral cutoffs and barrier strengths observed for tectonic earthquakes [Ida, 1973; Aki, 1979; Papageorgiou and Aki, 1983a], which imply much higher minimum magni-tudes: Mmin > 2.5 for stress drops less than 30 MPa. A possible explanation is that the effective critical slip distance increases with fault-zone width W according to a
strain-weakening model of the form De = ycW [Andrews, 1976a; Aki, 1979].
Labora-tory data are consistent with a critical strain of ye = 102, provided W is interpreted as the -width of the fault zone actually participating in the slip-i.e., the integrated shear-band thickness [Marone and Kilgore, 1993; Sammis and Steacy, 1994; Marone, 1998a]. The seismically-derived values of De thus require wide (on the order of 1m) shear-band thicknesses or additional mechanisms, such as near-fault damage, for en-ergy dissipation at the rupture front. In the former case, the effects of the inner dynamical scale, including the lower magnitude cutoff, should be observable in the seismographic data. Aki [1987] presented evidence for a falloff in seismicity below M ~ 3 from borehole-seismometer records in southern California, which he inter-preted as support for a strain-weakening model with a large W. Studies of events in the Hokkaido corner and intermediate-focus earthquakes in Romania have shown sim-ilar seismicity falloffs at M < 3 [Rydelek and Sacks, 1989; Taylor et al., 1990; Trifu
and Radulian, 1991]. On the other hand, Abercrombie [1995] analyzed data from the deeper and more sensitive Cajon Pass borehole seismometers and detected no significant deviations from the Gutenberg-Richter frequency-magnitude relationship down to about M = 1 for southern California. Further studies of small earthquakes are necessary to understand the relationship between laboratory, local, regional, and global observations.
Mining-induced seismicity not only occurs at scales between those in the labo-ratory and those on tectonic faults, but can be recorded at the depth of seismic nucleation using in-mine seismometers, thus creating an excellent "natural labora-tory" in which to study the physics of earthquake rupture. Mine seismicity has been the subject of extensive investigation for nearly forty years [Cook, 1963; Spottiswoode
and McGarr, 1975; McGarr, 1984a; Gibowicz and Kijko, 1994]. The goals of minimg seismology have generally been twofold. The first is assessment of hazardous areas in a mine in which "rockbursts" (damaging seismic events) or "falls of ground" (caused by shaking during an event) are most likely to result in costly damage and delays to the ore extraction process. The second goal is fast and accurate location and mag-nitude determination of events so that the affected area can be stabilized or rescue
teams can be sent to free trapped miners. This is why the seismology unit at most South African mines is usually housed in the mine safety department rather than with other geophysically-oriented units' such as surveying and exploration. There has been a good deal of scientific study of rockbursts, well-summarized in Gibowicz
and Kijko [1994], yet limited attention is given to this field in the United States, compared to seismological studies of large earthquakes. Since the performance and sensitivity of the seismic networks has been greatly improved during the last five years by the installation of on-reef, three-component geophones, digital recording systems, and improved software for data processing [Mendecki, 1997], we have the ability to use mining-induced seismicity extensively to bridge the scale gap between laboratory data and tectonic events.
Chapters 3 and 4 describe in detail the mine environment, provide an analysis of the kinds of events that occur in mines and discuss first-order observations of their source properties, such as their frequency-magnitude statistics and their spatio-temporal relationships. In addition, evidence supporting the hypothesis of the exis-tence of a minimum "critical" event size in this environment is put forth. Chapter 5 presents source scaling relations relating energy, stress drop, apparent stress and near-source ground velocity derived from combining this mining-induced seismicity dataset with both laboratory and tectonic datasets of previous workers.
Chapter 2
Effects of Normal Stress Vibrations
on Frictional Healing
Published in Journal of Geophysical Research by E. Richardson and C. Marone, 104, 28,859-28,878, 1999. Copyright by the American Geophysical Union.
Abstract. We conducted laboratory experiments to study frictional healing and the effects of normal stress vibrations on healing. The experiments were carried out using a servo-controlled double-direct shear apparatus on 10 cm x 10 cm blocks separated by a 3 mm-thick gouge layer of fine-grained (grain size of 75-212 pm) quartz powder. We performed slide-hold-slide tests in which sliding surfaces were driven at a constant velocity, halted for a given interval, then restarted at the prior driving velocity. Healing varied systematically with cumulative displacement, and by conducting several sets of identical slide-hold-slides we calibrated and removed these effects. Forward modeling of the healing and relaxation curves using the rate- and state-dependent friction laws shows that a displacement-dependent increase in the parameter b can account for our observations. To study the effects of vibration, we varied the mean normal stress of 25 MPa during holds by double amplitudes ranging from 1 to 13 MPa at a frequency of 1 Hz. Vibrations increased rates and magnitudes of frictional relaxation and healing, most likely due to increased gouge compaction. These effects increased with increasing amplitude of vibration. We performed normal
stress step tests and used the results to model the vibrational slide-hold-slide tests. Rate- and state-dependent constitutive laws cannot adequately describe the behavior we observed experimentally because they neglect gouge compaction. Mechanisms such as normal force oscillations may explain faster fault healing rates than would be predicted by standard laboratory measurements at constant stress.
2.1
Introduction
Time-dependent frictional healing between slip events is a crucial part of the seis-mic cycle and is observable in both laboratory experiments [Dieterich, 1972, 1979; Johnson, 1981] and natural faults [Vidale et al., 1994; Marone et al., 1995]. Static and dynamic stress changes due to nearby earthquakes have been observed to affect fault healing and stability [Mavko et al., 1985; Spudich et al., 1995; Wang and Cai,
1997] or to trigger other earthquakes [Hill et al., 1993; Gomberg et al., 1997]. These effects have largely been interpreted and modeled only in the case of changes in shear stress resolved on to the fault [Rice and Gu, 1983; Dieterich, 1988], although often the accompanying change in normal stress is significant as well [Mavko et al., 1985; Linker and Dieterich, 1992]. In addition, most laboratory rock friction experiments are con-ducted at constant normal stresses, thus preventing direct comparison of laboratory data with models and observations of the effect of stress changes during frictional healing.
Previous laboratory studies in rock friction have characterized the effects of changes in normal stress on steady state friction [Linker and Dieterich, 1992; Dieterich and Linker, 1992; Wang and Scholz, 1994]. These experiments have determined that a sudden change in normal stress produces a direct response in the direction of the nor-mal stress change followed by a relaxation and subsequent evolution to a new steady state in friction. This process is analogous to the effect on friction of a sudden change in load point velocity. Linker and Dieterich [1992] have interpreted these results in the framework of the rate- and state-variable friction laws, while Wang and Scholz
[1994] explained them in terms of a micromechanical contact model.
Studies of vibrated granular material [Kudrolli et al., 1997; Delour et al., 1999] have focused on establishing the fundamental behavior of particles subjected to vi-brations. This includes particle velocities, trajectories, and collision energies. These experiments have typically been conducted at low normal stresses (< 1 MPa), at high velocities (100-103 mm/s), and with very high frequency stress oscillations (102_ 104 Hz). Nevertheless, their results are interesting in a geophysical context because understanding the dynamic properties of vibrated granular materials can lead to a better understanding of how stress variations such as vibrations lead to changes in frictional parameters.
Effects of stress oscillations during steady sliding have been studied experimen-tally for metallic friction (e.g. Broniec and Lenkiewicz [1982]; Skdre and Stdhl [1992] and Polycarpou and Soom [1995a, b]). Since these investigators have been concerned primarily with the mechanical stability and wear experienced by moving machine parts, their experiments have also been conducted at low normal stresses, high ve-locities, and high frequencies compared to values that we expect to be relevant in tectonic environments. The experimental results have been somewhat inconsistent.
All found that friction decreases in response to any vibrations in the direction of shearing. However, normal force vibrations are observed to cause either increases or decreases in friction. The former has been explained as contact welding or hardening between the metallic surfaces [Broniec and Lenkiewicz, 1982; Skdre and Stdhl, 1992], and the latter likely occurs when the amplitude of external vibrations is large enough to cause loss of contact between the surfaces or when their frequency is close to the resonant frequency of one of the contacting materials [Broniec and Lenkiewicz, 1982; Hess and Soom, 1991; Tworzydlo and Becker, 1991]. Additional observations from these experiments include the reduction of stick-slip behavior during vibration and the decrease in friction with increasing frequency of vibration [Skdre and Stdhl, 1992]. In this paper we report the impact of dynamic stressing on the rate and degree of frictional healing in laboratory friction experiments. We found that normal stress oscillations during quasi-stationary contact enhanced both frictional healing and
re-laxation and that this effect increased with increasing amplitude of oscillation.
2.2
Experimental Procedure
The experiments we describe were performed in a biaxial loading apparatus at room temperature, pressure, and humidity in the double-direct shear geometry (Fig-ure 2-1 inset). The vertical ram driving the central block was controlled in displace-ment feedback, and the horizontal ram used to maintain normal stress was controlled in load feedback. The position and force of each ram are measured by displacement transducers (DCDTs) and load cells mounted on the rams. The shear load point posi-tion is measured at the end of the vertical ram where load is measured. The machine stiffness for the vertical load frame, which applies shear, is 5 MN/cm (250 MPa/cm for a 10 cm x 10 cm sample). Slip on the frictional surfaces and changes in gouge layer thickness were calculated using the calibrated apparatus stiffness from the load point and horizontal ram displacement, respectively. However, during dynamic varia-tion in normal stress, we made direct measurements of gouge layer compacvaria-tion using DCDTs mounted on the sample. Additional details of the experimental apparatus are given by Karner and Marone [2001].
Two 3-mm layers of fine-grained (91% of grains between 75 and 212 p-tm) silica powder (U.S. Silica F-110, 99.8% Si02) were sheared between either steel or Westerly
granite samples. For the steel samples the side blocks measured 10 x 10 x 4 cm and the central block measured 10 x 15 x 4 cm. For the Westerly samples the side blocks measured 10 x 10 x 4 cm and the central block measured 10 x 15 x 8 cm. In this configuration the nominal area of frictional contact remains constant (10 cm x 10 cm) during sliding. The surfaces of the steel blocks contain horizontal grooves so that shear was forced to occur within the gouge layer. The surfaces of Westerly granite were surface ground flat to 10.001 inch over their extent and then sand-blasted to increase roughness and inhibit boundary shear.
Table 2.1: Experimental Data. Amplitudes are double amplitudes for vibration ex-periments and single amplitudes for the step exex-periments
to the constant horizontal force maintained by servo-control (250 kN for all these experiments). A square wave with zero minimum or a trapezoidal wave with an instant increase but a ramp decrease was used for the normal stress steps. For the oscillations the added signal was a 1-Hz harmonic oscillation with zero mean. The amplitude of the steps and oscillations was controlled by adjusting the magnitude of the external signal and was set to zero during the parts of the experiments that were
performed at constant normal stress (Table 2.1).
2.3
Data and Observations
We performed slide-hold-slide tests to measure frictional healing using the same Exp. m081 m083 m085 m089 m092 m093 m095 m107 m113 m114 m117 m134 m223 m224 m225 m226 m237 m238 m272 m272 Type displacement displacement displacement Un vibration an vibration Ocn vibration Un vibration displacement Un vibration on vibration Un vibration on vibration Ua vibration Un vibration on vibration on vibration U step Us step On step cn vibration Amplitude (MPa) 0 0 0 5.5 1.0 3.8 3.7 0 5.6 11.5 5.6 12.5 3.7, 5.6 4.7, 2.8 10.4, 5.2 9.1, 8.0 0.2, 1.0 0.4, 1.2, 1.6, 2.2 1.2, 2.0, 2.5, 4.5 1.3, 1.9, 2.8, 3.8
method as outlined by Dieterich [1972] and Beeler et al. [1994]. In typical slide-hold-slide tests the load point is driven at a constant velocity, halted for a given length of time, then restarted at the previous driving velocity. During the interval in which the load point is stationary, frictional strength relaxes as the shearing surfaces continue to creep. Upon reloading, the shearing surfaces restrengthen to some peak value of static friction, then evolve over some characteristic displacement, eventually returning to the same steady state value of sliding friction prior to the hold. We next present observations of frictional relaxation and healing that were used to characterize the effects of total displacement and variable normal stress on frictional restrengthening during quasi-stationary contact.
2.3.1
Effects of Displacement
In order to compare data from slide-hold-slide tests that included normal force vibrations to data from tests at constant stress, we first sought to eliminate other second-order effects that would also contribute to the rate and degree of frictional healing. Therefore we used a constant load point velocity, gouge layer thickness, and mean normal stress among all experiments. Within individual experiments, absolute displacement of the sliding surfaces also has an effect on frictional healing. To cal-ibrate this effect, we performed several identical sets of slide-hold-slide tests over a range of absolute displacements (Figure 2-1).
This experiment was performed at a constant normal stress of 25 MPa. Before any shear load was placed on the sample, the normal load was set at 25 MPa, as with all the experiments. Then the vertical ram was started at a driving velocity of 10 pm/s. Next, a "load cycle" was performed in which the vertical ram was retracted at 10 pm/s until the shear load was removed completely, after which the ram was driven forward again, forming the hysteresis loop shown in Figure 2-1. Next, we executed a series of velocity step tests. During these tests, the load point velocity was rapidly increased from 10 to 20 pm/s. After a new steady state value of sliding friction was reached, the load point velocity was returned to 10 pm/s. This cycle was repeated
0.8 16 - '-ffll]][ ' 11
f)
111||II 11|||||1 -0.64 velocity stepsW slide-hold-slide tests 0-12- -0.48 -F E C,, 8- -0.320.3 Cz C')) load cycle -< 4 -0.16 0m107 0 -0 0 10000 20000 30000Shear load point displacement (pm)
Figure 2-1: Shear stress versus shear displacement for a 3-mm gouge layer sheared at 10 pm/s between rough steel surfaces at 25 MPa normal stress. Shown are the initial loading, a load cycle, velocity steps, and six sets of slide-hold-slide tests. Detail of the first set of these is shown in Figure 2-2. Inset shows the double-direct shear
configuration. The number in the bottom left corner refers to the experiment number in Table 2.1.
continuously over the first 12 mm of displacement.
After - 9 mm of shear displacement the system evolved from a strain-hardening regime to a velocity-weakening regime in which frictional resistance decreased with increasing slip speed. This transition has been noted by previous investigators and is thought to occur in response to the development of localized shear bands within the gouge layer [Dieterich, 1979; Tullis and Weeks, 1986; Marone et al., 1990]. We waited until velocity weakening was reached before performing the slide-hold-slide tests.
The experiment shown in Figure 2-1 included six identical sets of slide-hold-slide tests. Each set was accomplished at a load point velocity of 10 pm/s and included two holds each for 3, 10, 30, 100, 300, and 1000 s (Figure 2-2). For each hold in each set we measured frictional healing (AT) as the difference between steady state sliding shear stress just prior to stopping the load point and the peak value of shear stress reached upon reload. We measured frictional relaxation (A'rmin) as the difference between steady state sliding shear stress and the minimum value of shear stress reached just before the load point was restarted. We also measured fault gouge compaction as the decrease in gouge layer thickness during the quasi-stationary hold (Figure 2-2b). We report values for healing and relaxation in terms of shear stress rather than friction to avoid confusion when we describe later experiments in which the normal stress was varied.
The magnitude of frictional healing, relaxation, and gouge compaction increases linearly with the logarithm of hold time (Figures 2-3a, 2-3b, and 2-3c). This result is in agreement with observations from previous studies that have measured frictional healing [Dieterich, 1972; Johnson, 1981; Beeler et al., 1994] as well as relaxation and gouge compaction [Marone, 1998b; Karner and Marone, 1998]. In an individual experiment the magnitude of healing for equal hold times increases with displacement. In addition, the dependence of healing on log hold time increases with displacement. The dependence of the relaxation and compaction on displacement (Figures 2-3b and 2-3c) show just the opposite trend.
The 1000-s holds in each of the six sets of tests (Figures 2-3d, 2-3e, and 2-3f) show that healing, relaxation, and gouge compaction vary approximately logarithmically
16.5-C', 16-Cn 3s 3 Cz10 1 0 min *15.5- 30 30 6 ' 100 100 ci) 300 300 m107 1000 1000 E 2170 -a 3s 3 10 2150 - 30 100 100 2130 - 300 300 0 2110 - 1000 m107 13000 14000 15000
Load point displacement (pm)
Figure 2-2: (a) Shear stress and (b) gouge layer thickness versus shear displacement
for the first set of slide-hold-slide tests from Figure 2-1. Hold time in seconds is
labeled beneath each hold. The measured quantities healing (AT), relaxation (ATmin),
and gouge compaction (A#) are labeled on the last 1000-s hold. The continuous geometrical thinning of the gouge layer is inherent in the double-direct shear geometry
012.8-14.8 mm A18.8-21.1 mm
*
028.0-30.3 mm AI
.A-AS m107 1 2 3 1000s holds i d 15 20 25 30 m107 1 2 3 -12.8-14.8 mm A18.8-21.1 mm 028.0-30.3 mm 2 3 -o g S m1 07 )1 2 3 Log th (s) # 1000s holds 15 20 25 30 1000s holds 15 20 25 3 Displacement (mm)Figure 2-3: Time dependence of healing, relaxation, and compaction. For the first, third, and sixth sets of slide-hold-slide tests shown in Figure 2-1, (a) AT, (b) ATmin,
and (c) A# are plotted versus logio of hold time. Absolute shear displacement for each set is shown in the upper left. (d,e,f) Healing, relaxation, and compaction for each of the 1000-s holds in all six sets of slide-hold-slide tests as a function of absolute displacement. 0.8 0.6 - 0.4- 0.2-012.8-14.8 mm 0 A18.8-21.1 mm 028.0-30.3 mm *A
3
b
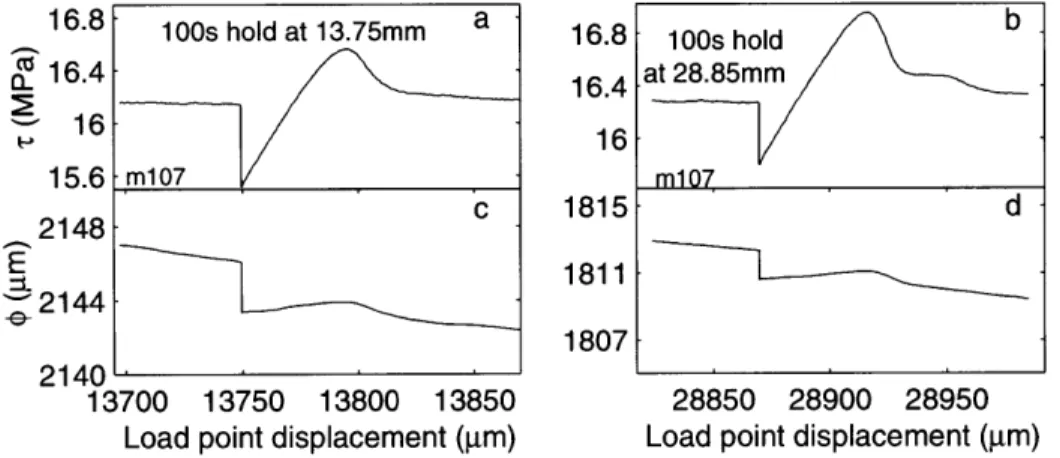
b 0.8 I 0.6 E0.4 1 0.2 [ 3 2 116.8 100s hold at 13.75mm a 16.8 10s hold b 16.4 16.4 at 28.85mm 16 16 15.6 mV7m , 2148c 2144 1807-2140 13700 13750 13800 13850 28850 28900 28950
Load point displacement (jim) Load point displacement (gim)
Figure 2-4: (a,b) Shear stress and (c,d) gouge layer thickness versus shear load point displacement for two 100-s slide-1holdslides at different displacements shown at the same scale. The slide- hold- slide on the left (Figures 4a and 4c) underwent greater relaxation and gouge compaction but less healing than the test at larger displacement
(Figures 4b and 4d).
with increasing shear displacement. This effect of absolute displacement is also evi-dent in the actual time series data (Figure 2-4) in which we compare two 100-s holds from the first and sixth tests at exactly the same scale.
We characterized the effects of displacement on the evolution of shear friction in order to eliminate them from our data. Once these effects were removed, we could determine the effects of other second-order variations, such as changes in normal
stress.
2.3.2
Normal Stress Steps
We performed experiments similar to those described by Linker and Dieterich [1992] in which we rapidly stepped the normal force during steady sliding in order to observe the evolution of friction (Figure 2-5). For these experiments, sliding surfaces were driven at a constant speed of 10 tim/s, and the initial normal stress was 25 MPa. The magnitude of our normal stress steps ranged from 0.2 to 2.5 MPa, or 1-10% of the initial normal stress.
27 -a
c25 2 normal stress snteps
Uc23 -M238
b
16-'a' velocity stepsvc snormal stress steps
(D) load cycle C') CD -C m238 0 0 10000 20000 30000 40000
Load point displacement (ptm)
Figure 2-5: (a) Normal stress and (b) shear stress versus shear load point displacement for an experiment including four sets of normal stress steps (0.42, 1.20, 1.61, and 2.20
MPa). Normal stress was increased as rapidly as possible under servo control (each step occurred <0.2 s), but was ramped down to its initial value to prevent unstable sliding.
when the normal stress was stepped due to the Poisson effect. However, we found that the ratio of shear stress change to normal stress change was - 0.01 for Westerly granite testing blocks and 0.02 for steel blocks. This is smaller by an order of magnitude than the ratio observed by Linker and Dieterich [1992]. This discrepancy is most likely due to the fact that they mounted their DCDTs directly on their sample blocks, and thus their effective stiffness was larger, and because their apparatus may have been slightly misaligned [Linker and Dieterich, 1992].
Following the Poisson effect, we observed elastic shear loading and subsequent evolution to steady state sliding at constant stresses. We measured the difference in shear stress between its value at the end of the elastic loading period and its subsequent steady state value in order to determine the quantity that Linker and Dieterich [1992] term "a," in which
ATstep/Ufinal ln(o-final/Oinitial)
from a linear elastic loading curve (Teiastic) is marked with a circle. Note that the Poisson effect (marked with a diamond) is barely observable (Figure 2-6). It is clearly visible in the vibration tests with larger normal stress variations shown in later figures. The quantity ATstep is the difference between the steady state shear stress following the normal stress step and Telastic and is of interest because it is the evolution in shear
stress that occurs with slip after the normal stress change. In order to determine the value of Teiastic we incrementally fit a line to the shear loading curve, beginning with the data point corresponding to the beginning of the normal stress step. Each successive fit included one additional data point. We defined eiasticfto be the data
point corresponding to the last local minimum in the error of fit, thus the final data point that belonged to the best fit line in a least squares sense.
Observations of the evolution of the gouge layer are as important as observations of shear stress in determining the effect of sudden normal stress steps on the frictional state of the system. We measured the changes in gouge layer thickness with two linear voltage differential transducers (LVDTs) mounted directly on the front face of the sample. The data we show (Figure 2-6c) are an average of the signal from these two sample-mounted LVDTs. As soon as the 2.5-MPa normal stress step was executed, the gouge layer compacted by about 5 pm. The gouge layer continued to compact rapidly during elastic loading. The point in displacement that marked the end of the elastic shear loading is marked on the gouge layer record with a circle (Figure 2-6c). The gouge layer continued to compact faster than at steady state over the same interval in displacement that corresponds to ATstep, after which a new steady
state was reached.
The slope (a) of the least-squares best fit line to measurements of ATejastic/Ufinal
constrained to pass through the origin is 0.30 (Figure 2-7). Linker and Dieterich [1992] used an approximately similar method to determine Telastic and to find a; they obtained a = 0.2. However, they also argue that a may be as large as 0.5; therefore our value seems reasonable. In sections 4.2-4.3, we use a to model data for normal stress steps and vibrational slide-hold-slide tests.
27 C,, a) C,) - 26 E 0 z 25m272 z -15.3b C,) 14.8 -St P S (n Celastic
S14.3 -slider load point
C 13.8 -S1294-c - 1290 -a) C) 0 c 1286 34800 35000 35200 Displacement (pm)
Figure 2-6: (a) Normal stress, (b) shear stress, and (c) gouge layer thickness as a function of shear displacement for one normal stress step. Normal stress and layer thickness are shown versus the load point displacement; shear stress is shown versus both load point displacement and slip measured directly across the sliding surfaces. The 2.5-MPa step in normal stress was accomplished in (<0.2 s). The shear stress increased instantaneously by 0.05 MPa due to Poisson expansion of the central forcing block (marked with a diamond). The shear stress followed an elastic loading curve until Telastic (marked with a circle), then evolved to a new steady state (marked with
a square); the difference between the new steady state and Telastic is ATstep. The
displacements at which rPoisson, Telastic, and Ts occur are also marked on the layer thickness curve. The effects of continual geometric layer thinning have been removed.
0.03 0.025- slope (a) =0.30 '7Z + .s 0.02 -0.012- -+ + 0.015 - + -0.01 + + 0.005-0 0 0.02 0.04 0.06 0.08 0.1 In(afinal/ainitial)
Figure 2-7: Nonelastic change in shear strength (ATstep) upon a step change in normal stress (see Figure 2-6b). ATstep is normalized by final normal stress and plotted versus the natural logarithm of the ratio of the final to the initial normal stress for 24 normal stress step tests. The line is the least squares best fit line to the data constrained to pass through the origin. Its slope, 0.30, equals a [Linker and Dieterich, 19921.
M28 a
0-M25
j22 18 m113 1 H4. 5.6 MPa oscillations
b shs with shs with shs with
16- velocity steps 2A0 2 5.6MPa 2A= .
14- 12-10 - 15.5 CO 10- a-15 8 14.5 30l00s 6 -- - inn_ 14000 21000 22000 4-2 0 0 10000 20000 30000
Load point displacement (pm)
Figure 2-8: (a) Normal stress and (b) shear stress versus shear displacement for a
3-mm gouge layer sheared at 10 pm/s between sand-blasted Westerly granite surfaces.
The first and third sets of slide-hold-slide tests were performed at constant normal
stress (25 MPa). During the second set of slide-hold-slide tests, normal stress was
oscillated at 1 Hz and a 2A = 5.6 MPa for the duration of the hold, then returned to 25 MPa at the end of the hold. The Figure 2-8b inset figure shows four slide-hold-slides
(right) with and (left) without vibrations.
2.3.3
Normal Stress Vibrations
We tested the effects of normal stress oscillations on frictional healing by vibrat-ing at a constant amplitude and frequency during the quasi-stationary intervals of the slide-hold-slide tests. All of the experiments with normal stress oscillations were
started exactly the same way as the experiment in Figure 2-1. Following the stan-dard loadup and initial shearing procedure, slide-hold-slide tests with normal force oscillations were performed. These were usually followed by another set at constant
stress or by another set of slide-hold-slides with oscillations (Figure 2-8).
Normal stress vibrations were accomplished by first stopping the vertical ram as
oscillations to some constant amplitude (2A = 5.6 MPa for the experiment in Figure 2-8). These oscillations were maintained for a given time interval, then reduced to zero amplitude again before the vertical ram was restarted. Figure 2-9 shows this procedure in detail for one 30-s slide-hold-slide test with normal force oscillations of 4.7-MPa double amplitude.
There was a lag of a few seconds at the beginning (t1 - t2 in Figure 2-9) and end (t5 - t) of every vibrational hold since the vibration amplitude was adjusted
by hand. Similarly, there was a finite time over which the normal force oscillations were increased to the chosen amplitude (t2 - t3) and decreased back to zero (t4 - t5).
We chose to increase/decrease the amplitude of the oscillations gradually in order to maintain constant frequency and so that the total signal to the servo-control varied smoothly at the onset and end of the vibrations. This prevented unstable sliding at the beginning of holds associated with large-amplitude reductions in normal stress. These short time lags were approximately constant for all holds because they only depended on the reflexes of the operator. The vibrational hold time was generally 5-7 s less than the total "hold time"; however, we always report the total hold time. This discrepancy necessarily affects short holds more than long ones, but we assume the effect is negligible and do not correct for it in any way.
Frictional Healing. The most significant effect of vibration during holds was the overall degree of frictional relaxation and subsequent restrengthening. The inset detail in Figure 2-8 compares two nonvibrational holds with two vibrational holds of equal times. These two pairs are shown at the same scale. Clearly, relaxation and especially healing, which more than doubled in comparison to the holds at constant
stress, increased greatly during vibration. Notice that the peak level of friction upon reloading is not as clearly defined in the vibrational holds as in the constant stress holds. This rounded shape at peak friction was characteristic of vibrational holds. For the purpose of measuring frictional healing, we defined the peak friction as the greatest value attained after the hold, even if this value occurs at some displacement after an apparent local maximum in friction (e.g., the 100-s hold shown in Figure 2-8 inset).
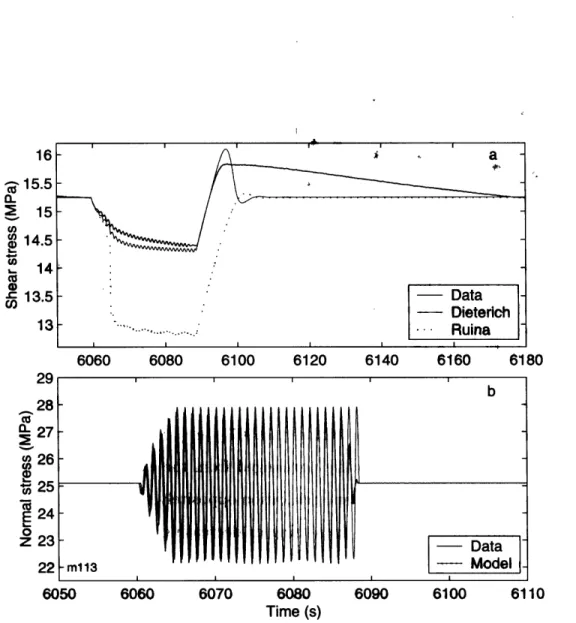
15.4 a- 15 Ca t t2 t t t,. (0 14.6-CD 14.2-b 27 Ca) .25-CD) 0 23-m224 5560 5570 5580 5590 5600 Timne (s)
Figure 2-9: (a) Shear stress and (b) normal stress versus time for one 30-s hold with 4.7-MPa normal stress oscillations. The vertical ram was stopped at ti. At t2, the
sinusoidal normal stress oscillations were started, reaching 5.6-MPa double amplitude at t3. At t4 the amplitude of the oscillations was decreased gradually, becoming zero
at t5. The vertical ram was restarted at t6, ending the hold. The apparent 10-s
modulation in amplitude of the normal stress during oscillations was due to a data-sampling rate of 10 Hz slightly out of phase with the 1-Hz oscillations. The oscillations in shear stress are due to direct elastic coupling (Poisson effect) between the normal and shear stress resolved on the central forcing block.
Another typically observed consequence of normal force vibrations was the un-usually large displacement over which sliding friction returned to its previous steady state value (Figure 2-8). This displacement is greater than that for longer constant normal stress holds that reached equivalent values of healing and peak friction. In addition, it is clear that frictional healing depends less strongly on hold time for vi-brational holds than for holds at constant stress (compare slopes of the open and solid symbols in Figure 2-10b). This feature is common for vibrational holds and seems to be related to the amplitude of vibration. Specifically, increasing vibration amplitude decreases the healing rate, 0, defined here as
#
= AT/A log th in which th is the hold time [Marone, 1998b]. In fact, for very large amplitude vibrations (2A-10-13 MPa),
#
0 0 for the range of hold times in these experiments; however, unsta-ble sliding marked by sudden shear stress drops tended to occur during holds with large-amplitude vibrations, making these data and the related relaxation data some-what difficult to interpret. In contrast to frictional healing and relaxation, gouge layer compaction consistently increased with hold time to a greater degree during vibrational holds than during constant stress holds (Figure 2-10).Figure 2-10 compares healing (AT), relaxation (ATmin), and gouge layer
com-paction (A#) for holds with and without normal stress oscillations for the three sets of slide-hold-slide tests displayed in Figure 2-8. Figures 2-10a, 2-10b, and 2-10c show measurements made on raw data, and Figures 2-10d, 2-10e, and 2-10f show mea-surements that have been corrected for the effects of absolute displacement. The displacement correction was determined by fitting a logarithmic curve to data of healing (or relaxation or gouge compaction) as a function of displacement (Figure 2-3) taken from the displacement calibration experiments such as the one shown in Figure 2-1 and others (see Table 2.1). The difference in healing on the calibration curve between the actual displacement and some reference displacement was the value of the correction added to the data and was applied identically to all the vibration experiments detailed here. We assumed that since the initial shear loadup was the same in each experiment, the effects of displacement were nearly identical for all of our experiments for the ranges of displacements
(a
10-35 mm) at which we conducted0.8 0.6 0o 2 0.4 0.2 0 1.5 0- 1 0.5 0 10 E -e- 10 5 0 * A A0 A 0 0 a 0 1 2 3
0
c D 1 2 3 Uncorrected 0 A constant a+
vibrating an m113, e D 1 2 3 Log th (s) 0.8 0.6 0.4 0.2 0 1.5 0.5 0 20 15 10 5 0 0 2 Log th (s)Figure 2-10: (a,b) Measurements of AT, (c,d) ATmin, and (e,f) A05 plotted versus logio of hold time for the three sets of slide-hold-slide tests in Figure 2-8. Effects of absolute displacement have been accounted for in the data on the right (Figures 10b, 10d, and 10f). Open circles and triangles represent the data from the first and third sets of slide-hold-slide tests, respectively, that were performed at constant normal stress. Solid diamonds represent the data from the second set with oscillating normal stress (2A = 5.6 MPa).
4-0
6
b 4 d 1 2 3 0) Corrected 0 A constant a+
vibrating a m13, f 0 1 2 3the slide-hold-slide tests. In the plots on the right of Figure 2-10, all the data are shown at a reference displacement of 15 mm. We did not observe any permanent effects of vibration, as is evident from the good agreement between the data from first and third slide-hold-slide tests.
Frictional healing increases with the log of hold time for both constant stress and vibrational holds (Figures 2-10a and 2-10b). The absolute level of healing is much larger for vibrational holds. An extrapolation of a least squares best fit line to these data implies that a hold of - 3 x 10⁵s at constant normal stress will result in the same level of frictional healing as a 10 s hold with 5.6-MPa vibrations (Figure 2-10). Frictional relaxation also increases with the logarithm of hold time for both types of holds (Figures 2-10c and 2-10d). Relaxation depends more strongly on hold time for vibrational holds (i.e., the slope of the best fit line is slightly steeper for the vibrational set), and the absolute level of relaxation is greater by approximately the same amount as that for healing (note the factor of 2 change in vertical scale between the healing and relaxation panels of Figure 2-10). This was observed consistently in all experiments. Gouge compaction greatly increased during normal force oscillations and also depends more strongly on hold time than it does under a constant normal load (Figures 2-10e and 2-10f). Inspection of the gouge layer after an experiment with large-amplitude vibrations revealed that the gouge had consolidated to form weakly cohesive plates of the order of centimeters in area and fractions of a millimeter in width due to the great compaction induced by the vibrations. Gouge layer effects are probably the most important for characterizing the effects of vibration as will be discussed.
Effects of Vibration Amplitude. We conducted several slide-hold-slide tests using different vibration amplitudes (Figure 2-11). For equal hold times the total change in shear stress during the hold and reload, AT + Armin, (Figure 2-11d), and the gouge compaction during the hold (Figure 2-11e) both increase approximately linearly with vibration amplitude. The delayed return to steady state friction and the rounded peak in friction following a hold are also enhanced with increasing am-plitude (Figures 2-11a, 2-11b, and 2-11c). We measure total change in shear stress
(AT + ATmi) in Figure 2-11d because 75% of holds with double amplitudes of 6 MPa
and greater experienced unstable sliding at the onset of vibrations, creating a small but unrecoverable shear stress drop (e.g., Figure 2-12). These stress drops could sometimes be eliminated by a longer ramp in vibration amplitude or a longer lag at the beginning of the hold before starting the vibrations.
Gouge Layer Effects. We measured the degree of gouge layer compaction as the change in layer thickness during the hold (Figures 2-2b and 2-13a) and dilatation as the change in gouge layer thickness between the end of the hold and the new steady state reached after the end of the hold (Figure 2-13a). We have already noted that healing, relaxation, and compaction vary linearly with the logarithm of hold time (Figures 2-3 and 2-10) and that gouge compaction and the total change in shear stress both vary approximately linearly with the amplitude of vibration for a given hold time (Figure 2-11). Thus the relationship between changes in shear stress and changes in the gouge layer during slide-hold-slide tests may be important in characterizing the effects of vibration.
In fact, we found that total change in shear stress varies linearly with both com-paction and dilatation (Figures 2-13b and 2-13c) over a range of vibration amplitudes. In the experiment shown in Figures 2-13b and 2-13c, hold times ranged from 3 to 1000 s. As hold time increases, compaction and total change in shear stress increase, so even though time is not explicitly plotted, the hold time increases from left to right within each of the three data sets. Note that a 1000-s hold with no vibrations un-derwent approximately the same amount of compaction as a 12-s hold with 8.0-MPa vibrations. Likewise, shorter hold times with 9.1-MPa vibrations achieved greater compaction and thus greater healing and relaxation than longer hold times with 8.0-MPa vibrations. This suggests that the effect of vibrations during a hold is essentially to trade time for compaction. Most dilatation measurements approached the mini-mum resolution of our LVDTs, so there is more scatter in this data set. However, it is still evident that there is a similar trade-off between time and dilatation when the gouge layer undergoes vibration. We will later discuss how the changing state of the gouge layer can be important in modeling the effects of normal force vibrations
20500 20600 28700 28800 25400 Load point displacement (ptm)
25500 25600 4 0 E 2 30
E
S15 10 5 e All 30s holds D 2 4 6 8 10 12Double amplitude of vibration (MPa)
Figure 2-11: Shear stress versus shear load point displacement for 30-s holds from one experiment at (a) constant normal stress, (b) 2A = 5.2 MPa, and (c) 2A = 10.4
MPa. Total shear stress change (AT+ ATmin) versus (d) 2A and (e) A# are presented
at a reference displacement of 30 mm. 16 01 2 15 d All 30s holds e*0
es
m092, m093, m095, m113, m114, r' 117, m134, m223, m224, rp225, m226 2 4 6 8 10 12 0)'15.5 - 2A =5.6 MPa 2 15-$5) 14.5-m113, m223 14 5930 5940 5950 5960 5970 Time (s)
Figure 2-12: Shear stress versus time for two 30-s hold times with the same double
amplitude of o-, vibrations from different experiments. One has a small stress drop
(shaded), and the other does not (solid). At the end of the hold, relaxation and healing differ between the two by an amount approximately equal to that of the
stress drop.
during slide-hold-slide tests.
2.4
Discussion
We have modeled the experiments to determine if the dependence of frictional healing on second-order effects such as cumulative slip and variable normal stress are consistent with the existing framework of the rate and state friction laws. Although other theoretical interpretations are possible and plausible, we are only considering
the empirical rate- and state-dependent friction laws here.
In the case of the constant stress holds, we adopted the standard law
p= po+aln( + blnQ )(2.2)
V(DD
in which [po is the coefficient of friction at the steady state sliding velocity Vj0, V is the slip rate, 0 is the state variable that can represent average contact lifetime, Dc is the characteristic slip distance over which friction evolves to a new steady state
1320 1315 1305' 5 3 2 + 0 5 '4 a--3 E 2 1 0 7700 7750 7800 Time (s) 0 4 8 12 A$ (gm) 7850 7900 16 20 1 2 3 Dilatation (gm)
Figure 2-13: Layer thickness (a) versus time for one slide-hold-slide test and measure-ments of AT + ArTmin as a function of (b) compaction and (c) dilatation (c) for several hold times. The data shown in Figure 2-13a are from an LVDT mounted directly on the sample, and geometric thinning has been removed. Compaction is the difference between A and B and dilatation is the difference between C and B. Open circles show slide-hold-slide tests without vibrations (3 th < 1000 s), shaded squares show tests with 2A = 8 MPa (12 < th < 1000 s), and solid diamonds show slide-hold-slide tests
with 2A = 9.1 MPa (11 < th < 1000 s). -A C -B . . . .m272 o 2A=OMPa b N 2A = 8.0 MPa * 2A = 9.1 MPa 12s
*
-U 300s 30s r(1000s 1000Sm226 m2 310following a change in velocity, and a and b are empirical constants. Equation (2.2) was coupled to a single-degree-of-freedom elastic relationship,
dpu= k(Vp -V) (2.3)
dt
in which k is the apparatus stiffness divided by the normal stress (1 x 10--3_m-1 for our apparatus) and Vj, is the slip rate of the load point, which is set equal to V. We tested two evolution laws with our data. One, the Dieterich, or "slowness" law, is given by
dO -V (2.4)
dt De
in which 0 evolves with time [Dieterich, 1978, 1979]. The other, the Ruina, or "slip" law, is given by
dO -VO (VO
= - In (2.5)
dt De Dc
in which 9 evolves with slip [Ruina, 1983].
In the case of the normal stress steps and the slide-hold-slide tests with normal stress oscillations, we followed the formulation of Linker and Dieterich [1992] in which a change in normal stress causes an immediate change in the state variable of the form
0
00
(
Uinitiai ,/b (2.6)0~Ofinal)
where a is defined in (2.1). After this sudden decrease in state, 0 evolves according to either (2.4) or (2.5) [Linker and Dieterich, 1992].
2.4.1
Displacement
In the case of total displacement, other workers have noticed changes in friction parameters with increased accumulated slip [Dieterich, 1981; Lockner et al., 1986; Beeler et al., 1996]. Such effects are generally considered to be a transient phase that