All rights reserved
International Variability in Ages at Menarche, First Livebirth, and Menopause
Alfredo Morabia,1 Michael C. Costanza,2 and the World Health Organization Collaborative Study of Neoplasia
and Steroid Contraceptives
The occurrences and timing of reproduction-related events, such as menarche, first birth, and menopause, play major roles in a woman's life. There is a lack of comparative information on the overall patterns of the ages at and the timing between these events among different populations of the world. This study describes the variability in reproductive factors across populations in Europe, the Americas, Asia, Australia, and Africa. The study sample consisted of 18,997 women from 13 centers in 11 countries interviewed between 1979 and 1988 who comprised the control group in a World Health Organization international, multicenter case-control study of female cancers. All were surveyed with the same questionnaire and methodology. Overall, a typical woman in this study reached menarche at age 14 years and delivered her first live child 8 years later, at age 22. She was 50 years old at natural menopause and had had 36 years of reproductive life. The median ages at menarche varied across centers from 13 to 16 years. For all centers, the median age at first livebirth was 20 or more years, with the largest observed median (25 years) occurring in China. The median delay from menarche to first livebirth ranged from 5 to 11 years. Among the centers, the median age at natural menopause ranged between 49 and 52 years. In most populations, younger women had a first birth at a later age than did older women. This tendency was more accentuated in some populations. These results reveal, perhaps for the first time, the variability of reproductive histories across different populations in a large variety of geographic and cultural settings. Except for menopause, international variability is substantial for both biologically related variables (age at menarche) and culturally related variables (age at first birth). There is a generational effect, characterized by more variability of age at first birth and delay to first birth in the younger than in the older generations. Am J Epidemiol 1998;148:1195-1205.
menstruation; reproductive history; surveys
The occurrences and timing of reproduction-related events, such as menarche, first birth, and menopause, play major roles in a woman's life. In this context, it is striking that the variations in reproductive histories among different populations of the world are not well known.
International comparisons on a single reproductive variable (e.g., age at menarche, characteristics of the menstrual cycle, age at menopause) conducted through the 1970s appear in reviews by Gray and Doyle (1) and Richardson (2). It is generally accepted that the average age at menopause is about 51 years in
indus-Received for publication August 2 1 , 1997, and accepted for publication May 5, 1998.
Abbreviations: IQR, interquartile range; P, percentile.
1 Division of Clinical Epidemiology, Canton Hospital, University of
Geneva, Geneva, Switzerland.
2 Medical Biostatistics/Biometry Facility and Statistics Program,
University of Vermont, Burlington, VT.
Reprint requests to Dr. Alfredo Morabia, Division of Clinical Ep-idemiology, Geneva University Hospital, 1211 Geneva 14, Switzer-land.
Part of the content of the paper was orally presented at the First Consensus Meeting on Menopause in the Far East Region, World Health Organization, Geneva, Switzerland, May 26-30, 1997.
trialized countries (2, 3), but data are inconsistent for the developing world (3) because of methodological problems (4). There are also recent reviews of the epidemiologic literature about determinants of age at menarche and patterns of menstruation (5) and about age at menopause (6). In addition, while information on the timing of reproduction-related events can, in principle, be retrieved from many epidemiologic stud-ies of breast cancer (e.g., Kelsey et al. (7)), published data usually report the information on reproductive events as categories rather than as continuous vari-ables. Such categorized data are ill-suited for compar-isons of distributions. In addition, definitions may differ across studies so that pooling the information from several published sources may be inappropriate. Thus, the overall timing of reproductive events has been described at the single population level (8, 9), but, to our knowledge, there is no published work comparing the timing of reproductive events from menarche to menopause between different popula-tions.
An international comparison of the timing of repro-ductive events is important for epidemiology, since
many diseases (e.g., breast, ovarian, and uterine can-cers and cardiovascular disorders) seem to be related to various characteristics of reproductive life. It is therefore of interest to determine whether the variabil-ity in disease incidence is consistent with that in re-productive life. It is also important for family planning and preventive counseling to establish the biologic limits of variability in reproductive histories related to the human genetic constitution and to identify the extent of the cultural and, therefore, modifiable influ-ences on reproductive histories within these limits.
The objective of this study was to describe the variability in reproductive factors that have mainly biologic (ages at menarche and menopause, duration of reproductive life) or cultural (delay between men-arche and first birth, age at first birth) determinants across populations in Europe, the Americas, Asia, Australia, and Africa surveyed with the same ques-tionnaire and methodology.
MATERIALS AND METHODS Study women
The study sample consisted of 18,997 women com-prising the control group in a World Health Organi-zation international, multicenter case-control study of female cancers. The study design and primary results have been previously reported based on data collected from 1979 to 1986 (10-13). The analyses performed for this report were based on the data from those control women plus the data collected on additional control women recruited for the World Health Orga-nization study through 1988. A total of 13 populations ("centers") in 11 different countries (Australia, Chile, People's Republic of China, Colombia, the (former) German Democratic Republic, Israel, Kenya, Mexico, Nigeria, the Philippines, and three separate centers in Thailand) were studied.
The World Health Organization study control group consisted of women who had been admitted to other than obstetrics and gynecology hospital wards and who were free of medical conditions it was thought could possibly alter contraceptive practices (i.e., car-diovascular and circulatory diseases, diabetes, chronic renal disease, benign breast disease, cancer, chronic liver disease, and any obstetric or gynecologic condi-tion). These women were selected from a large variety of different clinics within each center to avoid any link between their reproductive characteristics and their likelihood of being recruited into the World Health Organization study. The control women were of the same age and residential origin as the cases. These hospital control patients were interviewed, mostly in the hospital, by using a standardized questionnaire
administered by trained female interviewers. Reproductive variables, statistical analyses, and sample sizes
The main reproductive study variables (measured in years) were age at menarche, age at first livebirth, delay from menarche to first livebirth, age at (natural) menopause, and duration of reproductive life (time between menarche and (natural) menopause). Percen-tiles for each center and for the total study sample were used to summarize the observed distributions of the study reproductive variables: The median (or 50th percentile) was used as the measure of central ten-dency, and variability was assessed by the 10th, 25th, 75th, and 90th percentiles. Percentiles were deemed more informative than means and standard deviations because of the skewed distributions involved.
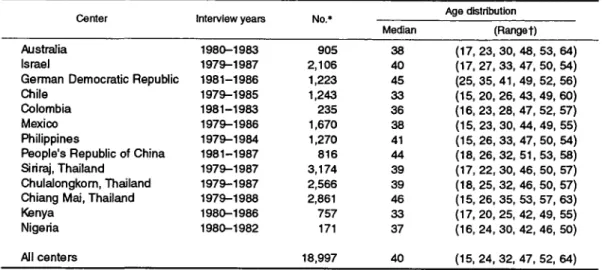
In a "boxplot" (or "box and whisker" plot) of age at menarche, the median is depicted by the "center" line of the box, and the interquartile range (IQR) (distance from the 25th to 75th percentiles) is depicted by the length of the box; the "whiskers" (dotted lines extend-ing from the top and bottom of the box) extend to the extreme values of the data or to a distance of 1.5(IQR), whichever is less, and the horizontal lines outside the whiskers indicate potential "outliers" (for normal or Gaussian data, almost all the data occur inside the whiskers).
In a "reproductive profile" plot (see Results), 95 percent nonparametric (or distribution-free) confi-dence intervals for the 10th, 50th, and 90th percentiles of age at menarche were calculated based on order statistics. (The 10th and 90th percentiles were pre-ferred over the 5th and 95th percentiles because they could be estimated more precisely, given the sample sizes of the study centers.) The validity of these con-fidence intervals does not depend on any specific assumptions about the shape of the population distri-bution (14).
Age at menarche
Age at menarche was taken directly as recorded by the interviewer. In the analyses of this variable, 83 women who either reported never menstruating or whose menstruation status or age at menarche were recorded as unknown were excluded (net n = 18,914). (The same 83 women were also excluded from the analyses of all of the other reproductive variables.) Age at natural menopause and duration of reproductive life
Most of the study women had not yet experienced either natural or artificial menopause at the time they
were interviewed. Therefore, the probability that the natural menopause of a study woman would occur beyond any given age was estimated by using cen-sored data survival analysis techniques based on Kaplan-Meier (or product limit) methodology (15). A "competing risks" approach similar to that suggested by Krailo and Pike (16) was used. When available, corresponding asymptotic 95 percent confidence inter-vals for the Kaplan-Meier estimated 10th, 50th, and 90th percentiles were calculated and displayed in the "reproductive profile" plots (see Results). An analo-gous strategy was also used to estimate the probability that a study woman's duration of reproductive life would exceed any given time.
These Kaplan-Meier analyses of age at natural menopause and duration of reproductive life required information on menopausal status (i.e., censoring) that was not directly recorded during the interview. In-stead, this information was estimated indirectly by using a classification algorithm applied to self-reported year of last menses, year of interview, year of birth (derived from self-reported age), and other rele-vant self-reported reproductive data (see below) that were directly recorded during the interview.
Most (83 of 142) of the missing data on age at natural menopause were due to missing data on age at menarche (see the previous section). Data on an addi-tional 59 women were missing for some of the other reproductive variables (e.g., year of last menses, hys-terectomy status, etc.) used to calculate menopausal status (net n — 18,855). There were also six missing values for age and five erroneous, negative, calculated values that could be attributed only to apparent errors in source data entry (net n = 18,844). The overall proportion of such errors (11 of 18,997) was otherwise remarkably small.
The logic and results of this classification algorithm are summarized briefly here. For all menarcheal study women, age at natural menopause was initially calcu-lated as (year of last menses minus year of birth), regardless of censoring. Women who were actually classified as having undergone natural menopause (n — 2,949) were at least required to have had their last reported menses more than 1 year before their year of interview. Women who had undergone a hysterec-tomy, a double oophorechysterec-tomy, or any operation/x-ray treatments preventing further menstrual periods at any time before or during their year of interview were classified as having had an artificial menopause (n = 968). In the survival analysis, their age at natural menopause was considered to be censored at the year of artificial menopause. For premenopausal (including a few pregnant and/or nursing) women (n = 14,927), their age at natural menopause was considered to be
censored at the year of interview. Subsequently, using the same censoring classifications, duration of repro-ductive life was calculated as (age at natural meno-pause minus age at menarche).
Age at first livebirth and delay from menarche to first livebirth
The vast majority (18,988 of 18,997) of the study women provided complete interview data on age at first livebirth. There were 15,053 women who reported having had a livebirth and 3,935 who were nullipa-rous, either because their conceptions never resulted in a livebirth (n = 3,596) or because they had never been pregnant (n = 339). In the analysis, the age at first livebirth of a nulliparous woman was censored as her age at natural menopause if she had experienced a natural menopause, her age at artificial menopause if she had undergone an artificial menopause, or just her age if she was still premenopausal. Likewise, the cen-sored delay from menarche to first livebirth for nul-liparous women was calculated as the difference be-tween their censored age at first livebirth and their age at menarche.
Censored data Kaplan-Meier techniques analogous to those described in the previous section were then used to estimate the distributions and percentiles of age at first livebirth and delay from menarche to first livebirth.
The sample sizes for age at first livebirth (net n = 18,894) and delay from menarche to first livebirth (net n = 18,892) reflected reductions due to missing data similar to, but less extreme than, those mentioned in the previous section. For example, missing values for menopausal status led to exclusions for nulliparous women, but not necessarily for those who were mul-tiparous.
RESULTS
Table 1 presents the sample sizes and age distribu-tions (medians, percentiles, ranges) of the 18,997 study sample women (age range, 15-64 years) inter-viewed between 1979 and 1988 stratified by center. Israel (n = 2,106) and the three Thai centers (Siriraj (n = 3,174), Chulalongkorn (n = 2,566), and Chiang Mai (n = 2,861)) contributed the largest study sam-ples. The median age was 40 years overall, but the median ages ranged from 33 years (Chile and Kenya) to 46 years (Chiang Mai, Thailand).
Age at menarche
The median age at menarche was 14 years overall. It varied across centers from 13 to 16 years (table 2). More than 90 percent of the women had their
men-TABLE 1. Interview years, sample sizes, and age distributions for study women in 13 international centers, 1979-1986
Age distribution Center Interview years No.*
-Median (Range t) Australia 1980-1983 905 38 ( 1 7 , 2 3 , 3 0 , 48, 53, 64) Israel 1979-1987 2,106 40 (17,27,33,47,50,54) German Democratic Republic 1981-1986 1,223 45 (25,35,41,49,52,56) Chile 1979-1985 1,243 33 (15,20,26,43,49,60) Colombia 1981-1983 235 36 (16,23,28, 47,52,57) Mexico 1979-1986 1,670 38 (15,23,30,44,49,55) Philippines 1979-1984 1,270 41 (15,26,33,47,50,54) People's Republic of China 1981-1987 816 44 (18,26,32,51,53,58) Siriraj, Thailand 1979-1987 3,174 39 (17,22,30,46,50,57) Chulalongkorn, Thailand 1979-1987 2,566 39 (18, 25, 32, 46, 50, 57) Chiang Mai, Thailand 1979-1988 2,861 46 (15,26,35,53,57,63) Kenya 1980-1986 757 33 (17,20,25,42,49,55) Nigeria 1980-1982 171 37 (16,24,30,42,46,50) All centers 18,997 40 (15,24,32,47,52,64) * Total sample sizes shown Include six women with missing age data.
t P, percentile; range = minimum, P10, P25, P75, P90, maximum, where Px = xth percentile.
TABLE 2. Median (P10, P25, P75, P90)* years of age at menarche, age at first livebirth, and delay from menarche to first livebirth for study women in 13 international centers, 1979-1986
Center
Australia Israel
German Democratic Republic Chile
Colombia Mexico Philippines
People's Republic of China Siriraj, Thailand
Chulalongkorn, Thailand Chiang Mai, Thailand Kenya Nigeria All§ Age (years) 13 13 14 13 13 13 14 15 15 15 16 15 15 14 Menarche (Range) (11, 12, 14, 15) (11, 12, 14, 15) (12, 12, 15, 16) (11, 12,14, 15) (11, 12, 14, 15) (11, 12, 14, 15) (12, 13, 15, 16) (13, 14, 16, 17) (13, 14, 16, 17) (13, 14, 16, 17) (13, 14, 17, 18) (13, 14, 16, 16) (13, 14, 16, 18) (12, 13, 15, 17) First Hveblrtht Age (years) 24 22 22 22 20 20 23 25 24 24 22 20 21 22 (18, (18, (18, (17, (16, (16, (17, (20, (18, (18, (18, (16, (17, (18, (Range) 21,29, NAt) 20, 26, 32) 20, 26, NA) 19, 27, 36) 18, 24, 31) 18, 24, 31) 20, 30, NA) 23, 28, 33) 20, 31, NA) 20, 32, NA) 20, 26, 36) 18, 22, 28) 19, 27, NA) 19, 27, NA)
Delay to first livebirtht No. of years 11 9 9 9 7 7 10 10 9 9 6 5 6 8 (5, (5, (4, (4, (3, (3, (3, (4, (3, (3, (2, (2, (2, (3, (Range 8, 16, 7, 13, 6, 13, 6, 14, 4, 11, 4, 11, 6, 16, 7, 13, 5, 17, 5, 17, 3, 10, 3, 8, 3, 8, 5, 14, ) NA) 20) NA) 23) 18) 18) NA) 18) NA) NA) 23) 11) NA) NA) * P, percentile, where Px = xth percentile.
t Kaplan-Meier estimates for age at first livebirth and delay to first livebirth.
i NA, not available.
§ Total numbers were 18,914 for age at menarche, 18,894 forage at first livebirth, and 18,892 for delay to first livebirth.
arche between ages 11 years (lowest observed, per-centile (P) 10)) and 18 years (highest observed, P90). Further details on the distributions of age at men-arche are shown in the boxplots in figure 1. The Chilean woman who reported having had her men-arche at age 28 years was pathologic, but such extreme observations have no influence on the median or other percentiles. There was a clear shift of distributions toward later age at menarche among women from Asia (the Philippines, China, and Thailand) and Africa (Ke-nya and Nigeria) compared with women from the Americas (Chile, Colombia, Mexico), Australia,
Is-rael, and Europe (German Democratic Republic). In addition, the IQR spread between the 25th and 75th percentiles was 2 years in most centers (3 years in Chiang Mai, Thailand and the German Democratic Republic). The biologic extremes were at ages 8 and 28 years.
Age at first livebirth
By age 22 years, about half of the study women had had a first livebirth (table 2). In most centers, the median age was above 20 years. The largest observed
in CM
a:
o
CM
AUS ISR GDR CHL COL MEX PHL PRC SRT CHT CMT KEN NIG ALL
FIGURE 1. Boxplot distribution of age at menarche for study women in 13 centers in 11 countries interviewed between 1979 and 1988.
AUS, Australia; ISR, Israel; GDR, (former) German Democratic Republic; CHL, Chile; COL, Colombia; MEX, Mexico; PHL, the Philippines; PRC, People's Republic of China; SRT, Siriraj, Thailand; CHT, Chulalongkom, Thailand; CMT, Chiang Mai, Thailand; KEN, Kenya; NIG, Nigeria; ALL, all centers.
median (25 years) occurred in China. The relatively more urban Thai centers (Siriraj and Chulalongkom) and Australia had the next highest median ages at first livebirth (24 years). The lowest median ages at first livebirth (20 years) occurred in Colombia, Mexico, and Kenya. The median for Nigeria (21 years) was also below the overall median of 22 years.
The effect of including versus excluding the approx-imately 20 percent censored data because of nullipar-ity in these analyses was obtained by comparing the Kaplan-Meier estimated percentiles with those esti-mated solely from the women who had a livebirth (data not shown). The Kaplan-Meier estimates in table 2 were generally from 1 to 2 years higher than, but otherwise consistent with, the estimates obtained after excluding the nulliparous women.
Delay from menarche to first livebirth
The median of the individual differences between age at menarche and age at first livebirth ranged con-siderably, from 5 to 11 years between the centers (table 2). The lowest medians occurred in the two African centers (5 and 6 years) and the more rural Chiang Mai Thai center (6 years). The highest
medi-ans occurred in Australia (11 years) and the Philip-pines and China (10 years).
There was also marked variability of spread in delay between the centers. For example, the estimated IQR was only 5 years in Kenya and Nigeria compared with 12 years in the two more urban Thai centers (Siriraj and Chulalongkom). Generally, the distributions were skewed upward; the apparent "outliers" (data not shown) represented the relatively small (perhaps in-creasing; see Generation Effects) numbers of women in each center who had had their first livebirth after age 40 years.
The Kaplan-Meier censored data estimated percen-tiles of delay from menarche to first livebirth were from 1 to 2 years larger than the corresponding esti-mates based exclusively on the approximately 80 per-cent of women who had had a livebirth (data not shown).
Age at natural menopause
The median age at natural menopause was estimated to be 50 years overall, and the median ages at meno-pause ranged moderately between 49 and 52 years among the centers (table 3). Although all five
percen-TABLE 3. Median (P10, P25, P75, P90)* years of age at menopause and duration of reproductive life (age at menopause - age at menarche) for study women in 13 international centers, 1979-1986
Center
Australia Israel
German Democratic Republic Chile
Colombia Mexico Philippines
People's Republic of China Siriraj, Thailand
Chulalongkorn, Thailand Chiang Mai, Thailand Kenya
Nigeria
All§
Menopauset Age (years) (Range)
51 NA NA 50 50 51 50 49 51 52 49 50 NA 50 (45, 48, NAJ, NA) (46, 49, NA, NA) (46, 49, NA, NA) (41, 46, 52, NA) (41, 47, NA, NA) (44, 47, NA, NA) (44, 47, NA, NA) (45, 47, NA, NA) (45, 48, NA, NA) (45, 48, NA, NA) (40, 45, 52, 55) (43, NA, NA, NA) (41, NA, NA, NA)
(44, 47, 55, 58)
Reproductive lifef Duration (years) (Range)
38 NA 38 37 36 39 37 34 36 38 32 36 NA 36 (31, 35, 40, NA) (32, 36, NA, NA) (32, 35, NA, NA) (28, 34, 39, NA) (28, 34, 39, NA) (31, 34, NA, NA) (30, 33, NA, NA) (29, 32, NA, NA) (29, 33, NA, NA) (30, 33, NA, NA) (24, 28, 36, 40) (28, 32, NA, NA) (27, 30, NA, NA) (28, 32, 44, 45) *P, percentile, where Px = xth percentile.
t Kaplan-Meier estimates.
i NA, not available.
§ Total numbers were 18,844 for age at menopause and for duration of reproductive life.
tiles listed in table 3 were reasonably estimated for the study women overall, in most of the centers, the sam-ple women were too young for the 75th and 90th percentiles to be determined (also see table 1). Duration of reproductive life (time from menarche to natural menopause)
In the total study sample, the median of the individ-ual differences between age at menarche and age at menopause was 36 years (table 3). Heterogeneity in duration across centers was moderate, with 32 years (Chiang Mai, Thailand) being the lowest and 39 years (Mexico) being the highest median durations. In most centers (as well as overall), fewer than 10 percent of the women had a duration of reproductive life shorter than 28 years. The exceptions were Chiang Mai, Thai-land (P10 = 24 years) and Nigeria (P10 = 27 years). Despite the fact that the 90th percentile was estimable in only a single individual center (P90 = 40 years for Chiang Mai), the overall study sample estimated P90 was 45 years.
Generation effects
To assess possible heterogeneity in the timing of reproductive events across generations, the analyses of all five reproductive variables were repeated sepa-rately by center for sample women who were age 15-29, 30-39, 40-49, and 50-64 years at the time of their interview.
Within each center, the percentiles of age at men-arche were almost identical among the study women in
all four age subgroups (data not shown). Moreover, the (limited but) comparable portions of the Kaplan-Meier estimated distributions of age at menopause and dura-tion of reproductive life for the women in the older age subgroups were also almost identical to those for the women in the younger age subgroups within centers (data not shown). These stratified analyses spoke against generation effects for the biologically deter-mined reproductive variables.
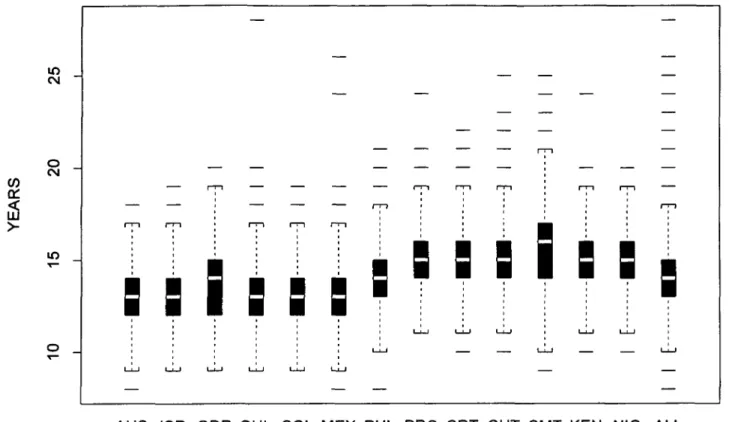
On the contrary, evidence of generation effects was found for the culturally determined variables, age at and delay to first livebirth, in most of the study cen-ters. Specifically, in the Australian, Israeli, Asian (the Philippines, China, and the three Thai centers), and African (Kenya and Nigeria) centers, there was a clear tendency for the two youngest subgroups of women to be older at and to delay longer until their first livebirth compared with their older counterparts (see medians in table 4). This tendency was not evident in the German Democratic Republic or American (Chile, Colombia, Mexico) centers. Moreover, the four corresponding age subgroup-stratified boxplots of the medians of each of these variables across centers showed clear decreasing (or nonincreasing) trends in the variability of the ages at first livebirth (figure 2) and delays to first livebirth with older age (not shown).
Reproductive profiles from menarche to menopause
The types of data presented on a variable-by-variable basis in tables 2 and 3 can be plotted on a
TABLE 4. Generation effects for age at and delay to first Iivebirth for study women in 13 international centers, 1979-1986
Median age at first Iivebirth (years)* Median delay to first Iivebirth (years)* uemer
Australia Israel
German Democratic Republic Chile
Colombia Mexico Philippines
People's Republic of China Siriraj, Thailand
Chulalongkorn, Thailand Chiang Mai, Thailand Kenya Nigeria 19-29 27 24 22 22 20 21 25 29 28 29 25 21 24 30-39 24 23 21 21 20 20 24 27 24 25 22 19 21 40-49 22 22 22 22 20 20 23 23 23 23 21 19 20 50-64 23 22 23 23 20 20 23 23 22 22 22 18 21 15-29 14 11 9.5 9 7 8 12 14 13 16 11 6 9 30-39 12 10 8 8 7 6 10 12 9 10 7 4 6 40-49 9 9 9 9 6.5 6 9 8 8 8 5 4 5 50-64 10 8 9 9 6 7 9 7 7 7 5 4 3 * Kaplan-Meier estimates. * csi LLJ CD <
a
SAGE 15-29 AGE 30-39 AGE 40-49 AGE 50-64
FIGURE 2. Boxplot distributions of median age at first Iivebirth for study women in 13 centers stratified by four age-at-interval subgroups,
1979-1988.
single graph indicating the sequence of reproductive events in a woman's lifetime (her "reproductive profile"). For example, figures 3 and 4 present the reproduc-tive profiles for the study sample women from Aus-tralia and Chiang Mai, Thailand, respectively, which represent two extreme cases. A typical ("median") Australian woman has her menarche at age 13 years and, after a delay of 11 years, a first birth at age 24 years with, eventually, a (natural) menopause at age 51
years, implying 38 years of reproductive life. In con-trast, a typical Thai woman from Chiang Mai has her menarche at age 16 and delivers a live child 6 years later at age 22 years, eventually experiencing natural menopause at age 49 years, having had 32 years of reproductive life. Thus, compared with the Australian woman, the Thai woman has half the delay between menarche and first Iivebirth and has a reproductive life that is 6 years shorter.
CO
a:
LU 60 " 50 -40 " 30 " 20 " 10 "o
-• • I NA 90th PERCENTILE MEDIAN 10th PERCENTILE 95% CONF. INT. NOT AVAILABLE — NA • — — 11 • = 5 • = NA • — 24 • ^ 18 • = NA • — 38 t X 31 • = NA • —51 f X
45 • =«= AGE AT MENARCHE DELAY FROM MENARCHE TO FIRST BIRTH AGE AT FIRST BIRTH DURATION OF REPRODUCTIVE LIFE AGE AT MENOPAUSEFIGURE 3. Reproductive profile of Australian women, 1980-1983.
CO
a:
60 " 50 " 40 " 30 -20 " 10 "o
-•
• •I
1i •
13 • 90th PERCENTILE MEDIAN 10th PERCENTILE 95% CONF. INT. 2 3 f l 3i : — : 6 • = 2 • a= 36 • X 22 • =c 18 • = 40 • I 32 • X 24 • = 55 # I 49 • X 40 • = AGE AT MENARCHE DELAY FROM MENARCHE TO FIRST BIRTH AGE AT FIRST BIRTH DURATION OF REPRODUCTIVE LIFE AGE AT MENOPAUSEFIGURE 4. Reproductive profile of women from Chiang Mai, Thailand, 1979-1988.
DISCUSSION large variety of geographic and cultural settings. Theranges of observed timing of reproductive events are
These results indicate the extent of the variability of revealed, perhaps for the first time. Except for meno-reproductive histories across different populations in a pause, international variability is substantial and may
affect both biologically related variables, such as age at menarche, and culturally related variables, such as age at first birth.
Overall, a typical woman in this study had her menarche at age 14 years and delivered her first live child 8 years later, at age 22 years. She was 50 years old at natural menopause and had had 36 years of reproductive life.
There were some geographic variations in age at menarche, which tended to occur later among women from Asia or Africa in comparison with women from more Westernized regions. This strongly suggests that cultural or environmental factors can be influential. For example, the very high age at menarche in the rural Thai area of Chiang Mai could reflect urban-rural differences. This explanation seems at least as plausi-ble as that of recall bias (i.e., Chiang Mai had the oldest sample women, with median age of 46 years). Moreover, with the exception of China, where the timing of births and the number of children permitted per family are subject to governmental strictures, the longest delays from menarche to first birth tended to occur in the more Westernized countries (such as Australia and Israel), while the shortest delays oc-curred in the African countries (Kenya and Nigeria) and the more-rural Chiang Mai center in Thailand. This type of finding, along with the observed variabil-ity in ages at first birth, may reflect differences in marital customs related to, for example, the median age at marriage, especially in the more rural areas.
It is also important to consider the possible limita-tions of the present results. The study sample consisted of relatively young women (median age, 40 years). Therefore, not all of the study women had completed their reproductive histories. This would not have been a problem for assessing the distribution of age at menarche, or even of age at and delay to first livebirth, assuming the latter two distributions could be reason-ably estimated solely from the usually large majority of women who had had a livebirth. However, for age at and delay to first birth, the censored data of nullip-arous women were incorporated in the Kaplan-Meier analyses to address this potential problem. Likewise, for estimating age at menopause and duration of re-productive life (where the problem would be greatest), this issue was also addressed by using a survival analysis approach.
In general, such censored data analysis techniques yield valid overall estimates of the median age at event (e.g., age at menopause) within a given center if it can be assumed that there is no generation effect, i.e., that the experience of the older sample women reflects the future experience of the younger sample women in a given center. This assumption appeared reasonable for
age at menopause and duration of reproductive life: Comparable portions of the Kaplan-Meier estimated distributions of these variables for the older sample women appeared to vary little from those of the younger sample women across the centers. The latter findings, along with no observed generation effect for age at menarche, speak for the validity of the overall estimates of the medians for the three mainly biologic reproductive variables within centers. Much the same could be argued regarding the validity of the overall median estimates of the more culturally determined variables, age at and delay to first livebirth, for the four study centers in which no generation effect was found. However, for the other nine study centers in which clear generation effects were observed, the va-lidity of the overall median estimates of age at and delay to first livebirth remains more problematic.
Another possible matter for concern about the va-lidity of the data involves potential differentials in reproductive history recall by the sample women in the various centers. Reproducibility studies have shown that US women have a precise recall of the major reproductive events (17, 18). However, it is unclear whether similar results would be obtained in less-developed countries.
Furthermore, selection bias may also be a problem because the study sample women were hospital con-trols, and access to hospital care may be more frequent for women of higher socioeconomic status than for other women. In less-developed countries, women who are more affluent are more likely to live in urban areas, and their way of life may more closely resemble that of Western women. On the other hand, women with diseases thought to alter contraceptive practices were not eligible, since these were originally controls for a case-control study on steroid contraceptive usage (10-13). In addition, life habits related to ages at reproductive events (e.g., smoking, diet, drinking) of women hospitalized may differ from those of the rest of the population. The net bias resulting from these multiple potential sources of selection on international variability remains unpredictable from the secondary analyses performed here because the specific data required to measure it were not collected in the orig-inal case-control study.
Our results are relevant for epidemiology, clinical medicine, and public health. International comparisons may provide some insight into the geographic variabil-ity of some reproductive history-related diseases, such as breast cancer in women.
Population-based information can help the clinician to identify how typical the reproductive history of a patient is compared with that of her community of
origin. From a public health perspective, monitoring of the timing of reproductive events may be a useful instrument to assess the impact of intervention strate-gies aimed at changing practices related to family planning and contraception.
ACKNOWLEDGMENTS
Supported by a grant from the Geneva Anti-Cancer League. The World Health Organization Collaborative Study of Neoplasia and Steroid Contraceptive received pri-mary financial support from the UNDP/UNFPA/World Health Organization/World Bank Special Programme of Research, Development, and Research Training in Human Reproduction, World Health Organization and supplemen-tal support from contract N01-HD-52901 from the US Na-tional Institute of Child Health and Human Development.
The data collection centers and the principal investigator, coinvestigator, and pathologist at each participating center in alphabetical order by country, are as follows: University
of Sydney, Department of Public Health, Sydney, Australia:
Dr. Geoffrey Berry (principal investigator), Dr. Robert MacLennan (coinvestigator), Dr. Rodney Shearman (coin-vestigator), Dr. Tatiana Jelihovsky (pathologist), and Dr. Joan Cooper Booth (pathologist). University of Chile,
Fac-ulty of Medicine, Hospital Jose Joaquin Aguirre, Depart-ment of Obstetrics and Gynecology, and the Ministry of Health, Hospital Salvador, Department Obstetrics and Gy-necology, Santiago, Chile: Dr. Ramiro Molina (principal
investigator), Dr. Luis Martinez (coinvestigator), Dr. Oriana Salas (coinvestigator), and Dr. Alfredo Dabancens (pathol-ogist). Shanghai Institute of Planned Parenthood Research,
Shanghai, China: Dr. Chen Zhiheng (principal
investiga-tor), Dr. Tao Yun (coinvestigainvestiga-tor), and Dr. Hu Yong Wei (pathologist). Hospital Universitario, World Health
Orga-nization Collaborative Center for Research in Human Re-production, Cali, Colombia: Dr. Alvaro Cuadros (principal
investigator) and Dr. Nubia Aristizabal (pathologist).
Cen-tral Institute of-Cancer Research, Academy of Sciences of the German Democratic Republic, Berlin, Germany: Dr. K.
Ebeling (pathologist), Dr.. P. Nishan (coinvestigator), and Dr. D. Kunde (pathologist). Chiam Sheba Medical Center,
Department of Clinical Epidemiology, Tel Hashomer, Is-rael: Dr. Baruch Modan (principal investigator), Dr. Elaine
Ron (coinvestigator), and Esther Alfandary (coinvestigator).
University of Nairobi, Nairobi Center for Research in Re-production, Nairobi, Kenya: Dr. J. G. Mati (principal
inves-tigator), Dr. Patrick Kenya (coinvesinves-tigator), Dr. Alfred Kungu (pathologist), and Dr. D. Gatei (pathologist).
Hos-pital General de Mexico, Mexico City, Mexico: Dr. Hector
Rodriguez Cuevas (principal investigator), Dr. Socorro Benavides Salazar (coinvestigator), Dr. Antonio Palet (pa-thologist), and Dr. Patricia Ontiveros (pathologist).
Univer-sity of the Philippines, College of Medicine, Manila, Phil-ippines: Dr. Ruben A. Apelo (principal investigator), Dr.
Julietta R. de la Cruz (coinvestigator), Dr. Jose Baens (co-investigator), and Dr. Benita Javier (pathologist). Chiang
Mai University, Faculty of Medicine, Chiang Mai, Thai-land: Dr. Suporn Silpisornkosol (principal investigator), Dr.
Tieng Pardthaisong (coinvestigator), Dr. Nimit Martin (co-investigator), and Dr. Choti Theetranont (pathologist).
Chu-lalongkorn University, Faculty of Medicine, Department of Obstetrics and Gynecology, World Health Organization Collaborating Centre for Research in Human Reproduc-tion, Bangkok, Thailand: Dr. Banpot Boosiri (principal
in-vestigator), Dr. Supawat Chutivongse (principal investiga-tor), Dr. Pramuan Virutamasen (coinvestigainvestiga-tor), Dr. Chansuda Wongsrichanalai (coinvestigator), and Dr. Prasarn Jimakorn (pathologist). Mahidol University,
Fac-ulty of Medicine, Siriraj Hospital, Department of Obstetrics and Gynaecology, Family Planning Research Unit, Bangkok, Thailand: Dr. Suporn Koetsawang (principal
in-vestigator), Dr. Daungdao Rachawat (coinin-vestigator), and Dr. Nivat Chantarakul (pathologist). University of Tromso,
Institute of Medical Biology, Tromso, Norway: Dr. Helge
Stalsberg (reference pathologist). Fred Hutchinson Cancer
Research Center, Division of Public Health Sciences, Seat-tle, WA: Coordinating Center: Dr. David B. Thomas (study
coordinator), Elizabeth A. Noonan. (statistician). World
Health Organization, Dr. Olav Meirik, Dr. Timothy M. M.
Farley, and Dr. Susan Hoick, Special Programme of search, Development and Research Training in Human Re-production, Geneva, Switzerland.
REFERENCES
1. Gray RH, Doyle PE. The epidemiology of conception and fertility. In: Barren SL, Thomson AM, eds. Obstetrical epide-miology. London, England: Academic Press, Inc., 1983: 25-59.
2. Richardson SJ. The biological basis of the menopause. Bail-16res Clin Endocrinol Metab 1993;7:1-16.
3. World Health Organization Research on the Menopause in the 1990s: Report of a World Health Organization Scientific Group. Technical report series. Geneva, Switzerland: World Health Organization 1996;866:14-16.
4. McKinley SM. Issues in design, measurement, and analysis for menopause research. Exp Gerontol 1994;29:479-93. 5. Harlow SD, Ephross SA. Epidemiology of menstruation and
its relevance to women's health. Epidemiol Rev 1995;17: 265-86.
6. Sowers MR, La Pietra MT. Menopause: its epidemiology and potential association with chronic diseases. Epidemiol Rev 1995;17:287-302.
7. Kelsey JL, Gammon MD, lohn EM. Reproductive factors and breast cancer. Epidemiol Rev 1993; 15:36-47.
8. Forrest JD. Timing of reproductive life stages. Obstet Gynecol 1993:82:105-11.
9. Morabia A, Khatchatrian N, Bernstein M, et al. Reproductive characteristics of a population of urban Swiss women. Acta Obstet Gynecol Scand l996;75:838-42.
10. World Health Organization Collaborative Study of Neoplasia and Steroid Contraceptives. Invasive cervical cancer and com-bined oral contraceptives. Br Med J (Clin Res Ed) 1985;290: 961-5.
11. World Health Organization Collaborative Study of Neoplasia and Steroid Contraceptives. Endometrial cancer and combined oral contraceptives. Int J Epidemiol 1988; 17:263-9. 12. World Health Organization Collaborative Study of Neoplasia and
Steroid Contraceptives. Epithelial ovarian cancer and combined oral contraceptives. Int J Epidemiol 1989;18:538—45.
13. World Health Organization Collaborative Study of Neoplasia and Steroid Contraceptives. Breast cancer and combined oral contraceptives: results from a multinational study. Br J Cancer 1990;61:l 10-19.
14. Morabia A, Bernstein M, Heritier S, et al. A community-based surveillance of cardiovascular risk factors in Geneva:
meth-ods, resulting distributions, and comparisons with other pop-ulations. Prev Med 1997;26:311-19.
15. Kalbfleisch JD, Prentice RL. The analysis of failure time data. New York, NY: John Wiley & Sons, 1980:10-15.
16. Krailo MD, Pike MC. Estimation of the distribution of age at natural menopause from prevalence data. Am J Epidemiol
1983;117:356-61.
17. Harlow SD, Linet MS. Agreement between questionnaire data and medical records. The evidence for accuracy of recall. Am J Epidemiol 1989;129:233-48.
18. Hahn RA, Eaker E, Rolka H. Reliability of reported age at menopause. Am J Epidemiol 1997; 146:771-5.