DOI 10.1007/s00221-013-3504-6 RESEARCH ARTICLE
Correlation properties of spontaneous motor activity in healthy
infants: a new computer‑assisted method to evaluate neurological
maturation
Sandra Waldmeier · Sebastian Grunt · Edgar Delgado‑Eckert · Philipp Latzin · Maja Steinlin · Katharina Fuhrer · Urs Frey
Received: 18 July 2012 / Accepted: 26 March 2013 / Published online: 28 May 2013 © Springer-Verlag Berlin Heidelberg 2013
the scaling exponent α via detrended fluctuation analysis of the time series. In hand trajectories of SMs in infants we found a mean α value of 1.198 (95 % CI 1.167–1.230) at 40–44 weeks. Alpha changed significantly (p = 0.001) at 50–55 weeks to a mean of 1.102 (1.055–1.149). Com-plementary multilevel regression analysis confirmed a decreasing trend of α with increasing age. Statistical per-sistence of fluctuation in hand trajectories of SMs is sen-sitive to neurological maturation and can be characterized by a simple parameter α in an automated and observer-independent fashion. Future studies including children at risk for neurological impairment should evaluate whether this method could be used as an early clinical screening tool for later neurological compromise.
Keywords Motor development in infants · Spontaneous
movements · Detrended fluctuation analysis · Fractals correlation properties
Introduction
The quality of spontaneous motor activity in infants has been shown to predict later neurological outcomes (Burger and Louw 2009; Cioni et al. 1997; Einspieler et al. 2004; Einspieler and Prechtl 2005; Ferrari et al. 1990; Spittle et al. 2008). Spontaneous motor activity in infants has been stud-ied with qualitative and quantitative methods. Prechtl and coworkers developed a qualitative approach to evaluate the motor integrity of infants based on the observation of spon-taneous motor activity (Einspieler et al. 2004; Einspieler and Prechtl 2005). They described a method to assess the quality of movement patterns in infants and introduced the term “General Movements” (GMs), which describes whole-body movements characterized by changing speed,
Abstract Qualitative assessment of spontaneous motor
activity in early infancy is widely used in clinical prac-tice. It enables the description of maturational changes of motor behavior in both healthy infants and infants who are at risk for later neurological impairment. These assessments are, however, time-consuming and are dependent upon professional experience. Therefore, a simple physiological method that describes the complex behavior of spontaneous movements (SMs) in infants would be helpful. In this methodological study, we aimed to determine whether time series of motor acceleration measurements at 40–44 weeks and 50–55 weeks gesta-tional age in healthy infants exhibit fractal-like properties and if this self-affinity of the acceleration signal is sen-sitive to maturation. Healthy motor state was ensured by General Movement assessment. We assessed statistical persistence in the acceleration time series by calculating
Sandra Waldmeier, Sebastian Grunt has been contributed equally. S. Waldmeier (*) · S. Grunt · M. Steinlin
Department of Pediatric Neurology, University Children’s Hospital Bern, PO-Box CH-3010, Bern, Switzerland e-mail: [email protected]
S. Grunt
e-mail: [email protected] E. Delgado-Eckert · U. Frey
University Children’s Hospital, Basel, Switzerland P. Latzin
Division of Respiratory Medicine, Department of Pediatrics, University Hospital of Bern, Bern, Switzerland
K. Fuhrer
Department of Pediatrics, University Hospital, Fribourg, Switzerland
amplitude, and sequence (Cioni et al. 1997; Einspieler et al. 2004; Einspieler and Prechtl 2005; Ferrari et al. 1990). GMs are observed in newborns and young infants up to an age of 20 weeks post term. In premature infants and neonates (up to about 4 weeks post term), GMs appear more proximal and are characterized by small to moderate amplitude and slow to moderate speed (Writhing Movements = WMs). At an age of 6–8 weeks post term, the movements become more distal, circular, have a smaller amplitude, show vari-able acceleration of the neck, trunk, and extremities in all directions and are characterized by a constant fluency (Fidg-ety Movements = FMs). The transition from WMs to FMs indicates a changing maturational stage.
Although this quality assessment allows the prediction of later neurological outcome, the method is time-consuming, depends largely on professional experience and shows a considerable intra- and inter-observer variability (Bernhardt et al. 2011). As such, there is a need for simple, observer-independent, physiological methods that can describe the complex behavior of SMs in infants during development. Various studies have investigated quantitative approaches to describe the trajectories of SMs in infants (Disselhorst-Klug et al. 2012; Karch et al. 2008, 2010; Meinecke et al. 2006; Piek 2001; van der Heide et al. 1999; Vaal et al. 2000). With the aid of three-dimensional movement analysis, the tra-jectories of SMs in infants were described, and it was pos-sible to provide an objective description of age-dependent developmental steps in spontaneous motor behavior (Dissel-horst-Klug et al. 2012). However most of these studies used complex equipment, and therefore the methods used are not necessarily suitable for a clinical setting.
Recent work used newer mathematical methods derived from nonlinear physics to quantify complex biological regu-latory systems. In many complex systems in nature, long-range correlation of fluctuating signals has been described by detrended fluctuation analysis (DFA), a method to identify fractal-like properties of nonstationary time series that arise from stochastic processes. Signals in nature are influenced by external inputs which cause a certain trend with systematic deviation of mean value. DFA provides an observer-independent scaling exponent that describes the correlation properties of the regulation of physiological sys-tems (Peng et al. 1993). Different studies have used DFA to describe correlation properties of physiological time series (Thamrin et al. 2010), including heartbeat (Goldberger et al. 2002; Peng et al. 1993, 1995), breathing (Baldwin et al. 2004; Cernelc et al. 2002; Thamrin and Frey 2009), temperature regulation (Stern et al. 2009) and gait control (Hausdorff et al. 1995, 1996; Dingwell and Cusumano 2010). Many regulatory systems have also been examined in infants (Baldwin et al. 2004; Cernelc et al. 2002; Stern et al. 2009). Based on DFA, these regulatory systems were thought to exhibit fractal-type long-range correlations
(Thamrin and Frey 2009; Thamrin et al. 2010), which are related to the characteristics and the determinism of the con-trol mechanism and are also responsive to maturation.
According to Maraun et al. (2004), DFA is sensitive but not specific concerning long memory. Short-range correlated processes may yield equivalent results as long-range correlated processes, and therefore, results of DFA may be falsely positive (Maraun et al. 2004; Dingwell and Cusumano 2010). Instead of interpreting the results of DFA as long-range correlations (Peng et al. 1993), a differ-ent interpretation has been proposed, namely, as statistical “persistence” or “anti-persistence” in time series (Dingwell and Cusumano 2010; Maraun et al. 2004). “Persistence” means that deviations in time series are statistically more likely to be followed by subsequent deviations in the same direction. “Anti-persistence” means that deviations in one direction are statistically more likely to be followed by sub-sequent deviations in the opposite direction. For example, in gait control, statistically persistent fluctuation has been described as a critical marker of “healthy” physiological function (Dingwell and Cusumano 2010).
Nonlinear mathematical models have also been used to describe arm and leg movements in preterm infants (Ohgi et al. 2007, 2008; Gima et al. 2011). Ohgi et al. (2008) identified evidence of nonlinearity in spontaneous move-ments of premature infants by using three-dimensional accelerometer measurements of the infant’s right hand. This study found that movements of infants with brain injuries were more unstable and less predictable than movements of low-risk children. In another study based on accelerom-eter measurements of leg movements, Gima et al. (2011) described the development of nonlinear characteristics in the spontaneous motor activity of healthy infants.
In our methodological study, we aimed to determine whether statistical persistence properties described by DFA exist in time series of accelerometer measurements in upper limb movements of healthy infants and whether these sig-nificantly change at two distinct maturational stages (MSs).
Methods
Study design
We quantified the variability and spontaneous movement ordering in one-dimensional acceleration (acc) of an infant’s hand by measuring time series and determining the param-eter α, which characterizes statistical persistence properties in upper limb movements. Through a cross-sectional design, one-dimensional hand acceleration in infants at 40–44 ges-tational weeks (MS I, displaying WMs according to Prechtl) and in infants at 50–55 gestational weeks (MS II, displaying FMs according to Prechtl) was measured.
Subjects
Twenty-two healthy neonates [11 boys and 11 girls; mean gestational age at birth 39.7 weeks (37.9–41.6 weeks, SD 1.1 weeks), mean birth weight 3,360 g (2,655–4,190 g, SD 381 g)] were recruited between October 2002 and February 2005 from the maternity ward of the Department of Obstet-rics and Gynecology, University Hospital, Bern.
We performed 25 hand acceleration measurements in MS I [mean age at measurement 41.8 weeks (39.9– 43.4 weeks, SD 1.2 weeks)] and 19 measurements in MS II [mean age 52.7 weeks (50.0–55.5 weeks, SD 2.1 weeks)]. To establish the repeatability of the method, we achieved double measurements within 14 days and the same matura-tional stage in 12 infants. Five infants were longitudinally measured during both maturational stages. Detailed infor-mation regarding all measurements is provided in Table 2.
Exclusion criteria for the study were as follows: (1) complications during pregnancy (such as eclampsia, HELLP syndrome, premature contractions, vaginal bleed-ing, TORCH infections, maternal drug abuse), (2) neona-tal conditions that could have a negative influence on the developmental course of the child (such as perinatal infec-tions, umbilical cord pH < 7.15, APGAR Score <5 at 5 min, or birth deformities), (3) abnormal neurological examina-tion and/or abnormal spontaneous motor activity according to the GM assessment defined by Einspieler and Prechtl (2005). None of the children received any medication. The parents of all children gave oral and written consent for their participation in the study. The study was approved by the ethics committee of the University Children’s Hospital of Bern and the ethics committee of the State of Bern. Clinical assessment of spontaneous movements
Spontaneous motor activity of the infants was videotaped in supine position according to the recommendations of Einspieler et al. (2004). Video recordings were performed when the children were in Behavioral State IV, as defined by Prechtl (1974) (open eyes, gross body movements, no crying or suckling movements, no hiccups, and no dis-traction). Interaction between child and environment was minimized. Mothers were told not to touch their child and to avoid face-to-face interaction. However, mothers were allowed to calm infants during longer episodes of crying. If necessary infants could also be taken in their mother’s arm or being breastfed for short periods. If the child was turning itself to one side, it was turned back in supine position. Par-ents and an observer who acted as a recording study nurse were present all the time of the measurement. Acceleration signals were recorded for a total duration of at least 1 h, and a simultaneous video recording was realized during the whole measurement period. Within the video recording, an
optimal sequence of 3–10 min in behavioral state IV (Pre-chtl 1974) was selected. A pediatric neurologist who was trained in the interpretation of spontaneous motor activity in infants classified GMs into different types of movement patterns according to Prechtl’s definitions (Einspieler et al. 2004). Children showing pathological GMs at any matura-tional stage were excluded from data analysis.
Accelerometer measurement of hand movements
A prototype accelerometer (Valuline™ Accelerom-eter 7596-2, Pat. Nos. 457 4327, ENDEVCO, California, USA) with a weight of 10 grams was fixed to the infant’s hand with a tape. The sensor was chosen because of its low weight. We sampled at 32 Hz and low-pass filtered at 10 Hz, with an accuracy of 16 bits. According to the rec-ommendations of Einspieler et al. (2004), GMs need to be observed over a time period of more than 3–5 min at least, in order to have a reproducible estimate of motor activity. As feeding times and sleep periods in the first months of life are difficult to anticipate, we measured a time period of at least 1 h to ensure sufficient movement activity in behav-ioral state IV (Prechtl 1974). According to Holger Kantz (personal communication 2012), 100,000 data points are the minimal allowable dataset for the estimation of correla-tion characteristics with DFA in a dataset of this type due to the relatively low measurement sampling frequency. Thus, we chose a measurement period of 1 h to deliver enough data points (115,200). According to Ottaviano et al., only target-directed movements show right-hand dominance. In our study, target offering to the infants was minimized, and we did not insist fixing the accelerometer always to the same hand side (see Table 1). The accelerometer contained a mass body, which moved by accelerated hand movements and triggered a one-dimensional signal from the integrated sensor. The signal was transmitted through a thin, low-weight cable from the accelerometer to a personal com-puter. A representative example of the acceleration signal is illustrated in Fig. 1.
Data analysis: detrended fluctuation analysis
Typically in fractal-type time series, statistical proper-ties of variations observed in a larger time window are similar to statistical properties of variations in a shorter time window (Fig. 1). This self-similarity can be quanti-fied using DFA as described by Peng et al. (1993, 1995). Fluctuation analysis of accelerometer time series of each measurement was conducted using a custom-written soft-ware program implemented in the R environment [R Core Team (2012), http://www.R-project.org]. DFA yielded the presence of scaling, which was characterized by the slope alpha of a regression line fit. A detailed description
of DFA and the calculation of alpha can be found in the “Appendix 1”.
Statistical tests using surrogate time series
To test the hypothesis that the participants controlled their movements by sending signals to their muscles that are temporally independent from previous signals, surrogates obtained via random shuffling of the original time series were used according to Dingwell and Cusumano (2010). The distribution of alpha values in these surrogate time series allowed for the rejection of this hypothesis for each participant (see “Appendix 2” for more details).
Dingwell and Cusumano (2010) also evaluated phase-randomized surrogates preserving the power spectra and auto-correlation properties of original time series in gait analysis (walking on a treadmill). According to their results, the hypothesis cannot be rejected that subjects independently choose their stride-time and stride-length as
temporally correlated auto-regressive (AR) process or more generally as nearly equivalent auto-regressive moving-aver-age (ARMA) process.
In the present study, we investigated to what extent this result applies to time series of motor acceleration measure-ments in healthy infants (at 40–44 weeks and 50–55 weeks gestational age). We found analogous properties of the motor acceleration time series.
More details on the generation of surrogate time series and the statistical analysis involving those can be found in “Appendix 2”.
All calculations were conducted in R [R Core Team (2012)] using a custom-written software program imple-mented in the R environment, and the packages “fractal” [Constantine and Percival (2012)] and “tuneR” [Ligges (2011)].
Sampling frequency issues during measurements
In order to study potential issues with the method of DFA that could arise from a low-sampling frequency during the measurement, we conducted a simulation study. We inves-tigated the effect of applying DFA to a time series obtained from an “original” time series by sampling the time series with a lower sampling rate. This sampling procedure boils down to leaving out one or more consecutive values from the original time series in a periodic manner. Fortunately, the effect is consistent with direction, suggesting that the errors in the alpha values caused by a low-sampling rate during measurements should not jeopardize the validity of our main results. Further details concerning these sampling frequency issues are specified in “Appendix 3”.
Statistical analysis
The data were tested for normality. The combined cross-sectional and longitudinal dataset was analyzed using various techniques to ensure the robustness of the find-ings. First, simple cross-sectional group comparison at the time (sec)
0 2 4 6 8 10 12 14 16 18 20
acceleration (arbitrary units)
0.2 0.4 0.6 0.8 1.0 1.2 1.4 1.6
Fig. 1 Example of an acceleration signal. Acceleration signal
sam-pled at a rate of 32 Hz. Signal variations in a larger time window were statistically similar to signal variations in a shorter time window (fractal-type time series)
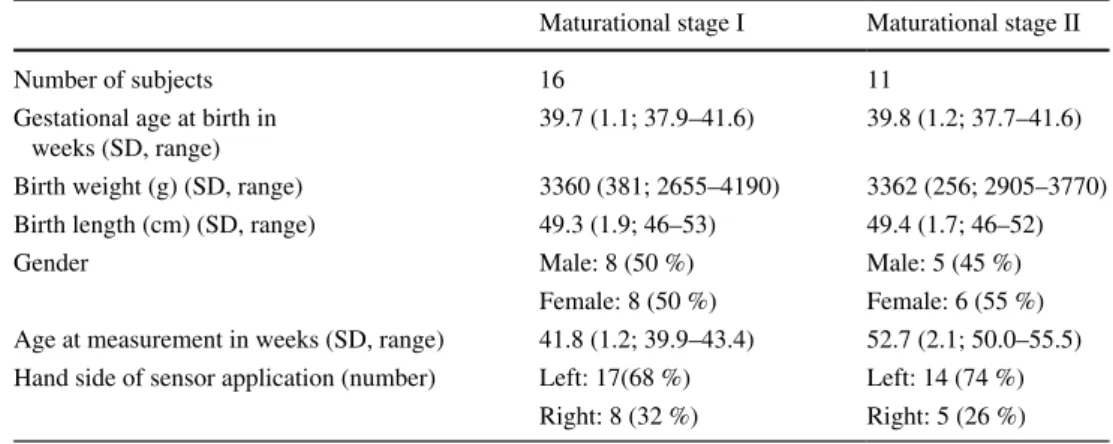
Table 1 Patient characteristics Maturational stage I Maturational stage II
Number of subjects 16 11
Gestational age at birth in weeks (SD, range)
39.7 (1.1; 37.9–41.6) 39.8 (1.2; 37.7–41.6) Birth weight (g) (SD, range) 3360 (381; 2655–4190) 3362 (256; 2905–3770) Birth length (cm) (SD, range) 49.3 (1.9; 46–53) 49.4 (1.7; 46–52)
Gender Male: 8 (50 %) Male: 5 (45 %)
Female: 8 (50 %) Female: 6 (55 %) Age at measurement in weeks (SD, range) 41.8 (1.2; 39.9–43.4) 52.7 (2.1; 50.0–55.5) Hand side of sensor application (number) Left: 17(68 %) Left: 14 (74 %)
maturational states MS I versus MS II was compared using t test after testing for normality. Secondly, a linear regres-sion analysis of the entire dataset of all measurements (accounting for age, sex, and maturational state) was per-formed to detect developmental differences in α. Thirdly, a random-effects generalized least squares (GLS) regres-sion analysis was performed for the statistical description of the combined cross-sectional and longitudinal dataset of α, which accounted for age, sex, maturational state, and the presence of multiple measurements per subject (I and II). The repeatability of the measurements within 14 days was further illustrated by Bland and Altman plots (1986). The software used for the statistical analyses was STATA® v.10.0 for Windows.
Results
Patient characteristics of the study subjects are provided in Table 1. Table 2 provides a summary of all meas-ured alpha values in both MSs. One subject (attending the study only at MS II) showed a pathological General Movement Assessment in the video, which is why it was excluded from all data analysis. The parameter α was >0.5 for all measurements (mean = 1.156, SD = 0.097), which indicated statistical persistence in each individual
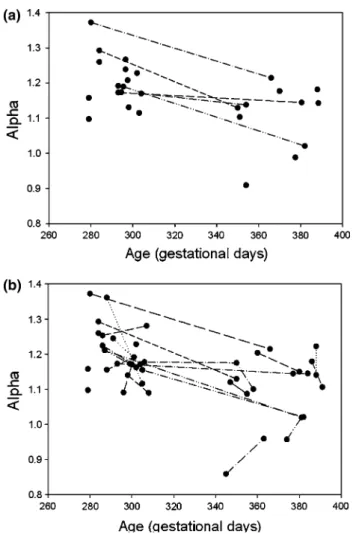
time series for acceleration. The cross-sectional compari-son of the maturational stages I and II showed that alpha was significantly lower in MS II (p = 0.0003) (Table 2; Fig. 2a).
Regression analysis based on all measurements of α versus age is displayed in Fig. 2b. In Fig. 2b, correspond-ing individual longitudinal data series of the subjects are represented with lines. The linear regression analysis revealed a decreasing α with both increasing age over the entire measurement period (coefficient = −0.00115, 95 % CI = −0.00182 to −0.00048, p = 0.001) and ongoing mat-uration from MS I to MS II (coefficient = −0.09619, 95 % CI = 0.14881 to −0.04356, p = 0.001) (Table 3).
GLS analysis was used due to hindered availability of subjects (relocation, acute illness etc.…) leading to a heter-ogenic follow-up with a variable number of measurements (Table 2). Age and maturational stage showed no relevant interdependency (Table 4). Therefore, we assumed that the course of α in both MSs could be compared between both groups (Table 4). GLS analysis similarly showed a signifi-cant decrease of α with increasing age over the entire meas-urement period (Table 4).
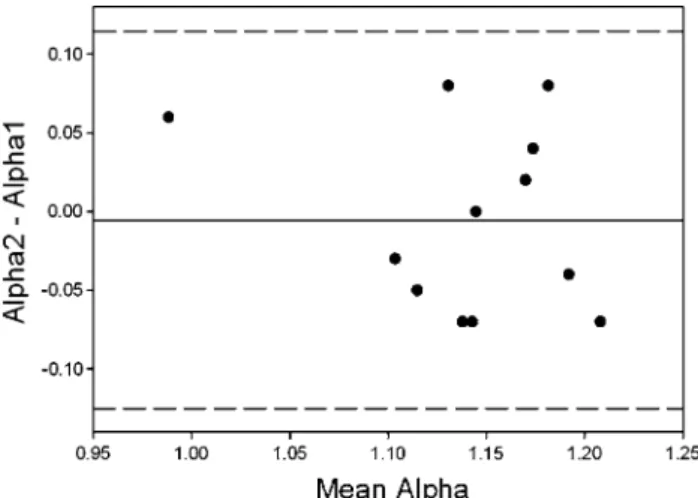
In order to test short-term repeatability within 14 days, we displayed corresponding pairs in Fig. 3 in a Bland– Altman illustration. None of the observed alpha values was outside confidence limits.
Table 2 Measurements of alpha
Mean alpha values in Maturational Stage I and II and alpha values of each subject in Maturational Stage I, respectively, Maturational Stage II. There was one subject with a double measurement in each age category; one subject had a double measurement in MS I, but only one measure-ment in MS II; one subject had one measuremeasure-ment in MS I and a double measuremeasure-ment in MS II; one subject had one measuremeasure-ment in each MS; four subjects had a single measurement in MS I; and thirteen subjects had double measurements in one category
Subject MS I MS II Subject MS I MS II
Alpha 1 Alpha 2 Alpha 3 Alpha 4 Alpha 1 Alpha 2 Alpha 3 Alpha 4
1 – – 1.120 1.087 12 1.158 – – – 2 1.245 1.245 – – 13 1.162 1.178 1.175 1.100 3 1.156 1.192 – – 14 – – 1.204 1.150 4 1.224 1.155 1.021 – 15 1.260 – – 5 1.091 1.170 – – 16 – – 1.141 1.222 6 – – 0.859 0.959 17 1.2925 1.130 – 7 1.097 – – – 18 – – 0.957 1.020 8 1.228 – – – 19 1.211 1.1729 – – 9 1.361 1.116 – – 20 1.3722 – 1.214 – 10 1.140 1.090 – – 21 1.173 – 1.145 1.145 11 – – 1.179 1.106 22 1.253 1.281 – – MS I MS II Mean alpha 1.198 1.102 95 % CI 1.167–1.230 1.055–1.149 SD 0.075 0.098 Range 1.090–1.3722 0.859–1.214
Discussion
Summary
The studies of Ohgi et al. and Gima et al. showed nonlin-ear, chaotic, and dynamic characteristics of spontaneous movements in premature infants (Ohgi et al. 2008) and qualitative changes in spontaneous movements of 8 healthy infants from 0 to 6 months (Gima et al. 2011). Using a similar method, our measurements also showed a signifi-cant fractal-type correlation in the acceleration of hand movements in infants and additionally revealed a signifi-cant alteration in motor behavior. Alpha decreased during a period of ongoing neurological maturation, in which the clinical assessment of spontaneous movements has been
shown to be significant for the prediction of later neurolog-ical outcomes (Cioni et al. 1997).
Defining neurological maturation by a numerical parameter The clinical assessment of motor behavior in infants plays an important role in clinical practice. It has been shown that particularly, the complex behavior of SMs in young infants can predict later neurological outcomes (Burger and Louw 2009; Cioni et al. 1997; Einspieler et al. 2004; Einspieler and Prechtl 2005; Spittle et al. 2008). The most widely used method to describe motor behavior in infants is the “General Movement Assessment” according to Prechtl (Einspieler et al. 2004; Einspieler and Prechtl 2005). With detailed visual observation, this method describes matu-rational changes of spontaneous motor activity in infants. However, this method is time-consuming and requires highly specialized observers. Furthermore, the method shows a very variable intra- and inter-observer repeatability
Fig. 2 a Cross-sectional dataset. The connecting lines illustrate
the descriptive trend of decreasing α for subjects measured in both Maturational States I and II. For subjects with double measurements per maturational state mean α per maturational state is represented.
b Longitudinal Dataset. Longitudinal dataset of all measured α
plot-ted in relation to age at the time of the measurement. The connecting
lines illustrate all of the longitudinal measurements per subject with a decreasing general trend of α over time
Table 3 Linear regression analysis (all measurements)
Alpha related to gestational age and maturational stage (linear regres-sion analysis). There was a significant general decrease of α with increasing age as well as a significant decrease in α from Matura-tional Stage I to MaturaMatura-tional Stage II
* Age was defined as days after first day of last menstrual period (gestational age). CI Confidence interval
Coefficient 95 % CI P
value Alpha versus age* −0.00115 −0.00182 to −0.00048 0.001 Alpha versus
maturational stage −0.09619 −0.14881 to −0.04356 0.001 Alpha versus age*
(maturational stage I) −0.00230 −0.00613 to 0.00014 0.060 Alpha versus age*
(maturational stage II)
0.00146 −0.00162 to 0.00455 0.331 Alpha versus sex 0.00678 −0.05317 to 0.06673 0.821
Table 4 GLS Model
Alpha related to gestational age and Maturational Stage. The age-related analysis, clustered with Maturational Stage, revealed a decreasing trend in the value of α
* Age was defined as days after first day of last menstrual period (gestational age)
Coefficient 95 % CI P
value Alpha related to age*
clustered with matu-rational stage
−0.00115 −0.00181 to −0.00050 0.001
Alpha related to age* clustered with num-ber of measurements per subject
(Bernhardt et al. 2011). Thus, there is a need for an auto-mated and simplified method for detecting abnormal spon-taneous motor activity in young infants.
Various quantitative methods have been proposed to evaluate the spontaneous motor activity in infants (Droit et al. 1996; Karch et al. 2008; Ohgi et al. 2007, 2008; Piek 2001; Vaal et al. 2000; van der Heide et al. 1999). Studies that examined the kinematic patterns of kicking movements found a difference between infants at risk for later cerebral palsy and healthy infants (Droit et al. 1996; Vaal et al. 2000; van der Heide et al. 1999). With three-dimensional kinematic analysis, it was also possible to detect matura-tional changes of spontaneous motor behavior in infants (Disselhorst-Klug et al. 2012). In addition, a recent study showed that the movement complexity of SMs in infants can be described by an automated approach (Karch et al. 2010). However, most of these studies used complex equip-ment, and therefore, the methods used are not necessarily suitable for a clinical setting.
Recently, Ohgi et al. (2008) performed accelerometric measurements of upper limb movements and demonstrated that spontaneous movements of premature infants have nonlinear, chaotic, dynamic characteristics, which are mod-ified in infants with brain injury. Gima et al. (2011) also found nonlinear chaotic dynamics of spontaneous lower extremity movements and demonstrated time-dependent changes of spontaneous motor activity in 8 healthy infants. In our study, we used detrended fluctuation analysis to show evidence of fractal-type correlation in spontane-ous motor activity in healthy infants (scaling exponent alpha). This method enabled us to characterize the complex
waveforms of spontaneous movements in infants with one comprehensive parameter, which was observer-independent and reproducible over a short time period. We also demon-strated a change in α with maturation during early infancy, a period where significant changes of motor activity occur. The changing of α namely goes together with the transi-tion of writhing movements to fidgety movements. In nei-ther our study nor in the studies of Ohgi et al. and Gima et al., the predictive value for later neurological impairment was examined. Future studies shall correlate simple sig-nals derived from a low cost accelerometer time series with long-term clinical neurological outcome.
As a complementary method to existing camera-based methods, automatically assessed acceleration signals with fractal-type correlation properties could help screening infants at risk for neurological impairment. Broader com-parison of the known alpha coefficient values within other settings like gait studies (Hausdorff et al. 1999; Dingwell and Cusumano 2010) is necessary before placing the results in the context of this cohort.
Potential links to gait control mechanisms
The question arises as to whether our observations regarding the changes in the value of α could be linked to later motor development and gait control mechanisms. Previous studies of gait control mechanisms in adults (Hausdorff et al. 1995, 1996, 1997, 1999) showed an analog fractal-like behavior. Hausdorff et al. (1995) studied the stride interval in healthy adults and found evidence of long-range, self-similar corre-lations. In a later study, the same research group examined children and adults in different age groups and showed that the fractal-type long-range correlation of the stride interval in gait changes with age (Hausdorff et al. 1999). Our findings, showing a decreasing α with increasing age during early infancy, were consistent with and even complementary to their observations. Considering the results of Hausdorff et al. (1999), it would be interesting to investigate whether a fluent transition from fractal properties of spontaneous movements in infants to gait mechanisms in children and adults could be found, and whether this transition could be visualized with a continuous course of α as a function of age. To place the results of our study in this context and to explain these com-plex long-term age-related changes during neurological mat-uration, ongoing and future longitudinal follow-up studies should include computer simulations with broader datasets. Limitations of the method
In an optimal setting, several longitudinal observations in the first month of life would have been performed. For dif-ferent reasons (including relocation and illness), not all par-ents were willing to participate in the study at various time
Fig. 3 Bland and Altman Plot. Six children in each maturational state
were measured on two occasions within 14 days. The Bland–Altman representation descriptively shows a small amount of variability for repeated measurements within this interval. The continuous line rep-resents the mean difference between both measurements, and the
dot-ted lines represent two standard deviations of the difference between both measurements
points. Thus, we had to analyze a combined cross-sectional and longitudinal dataset (Table 3). To ensure the robustness of the findings, we used different statistical methods (cross-sectional age group comparison, linear regression analysis, random-effects generalized-least-squares regression analy-sis) to detect developmental differences in these subjects. All of the methods consistently showed a decrease of α with age, which supported the robustness and physiological relevance of the finding.
Furthermore, it must be noted that the pattern of hand movements may be influenced by the accelerometer on the infant’s hand. The accelerometers weight is minimal, but the possible influence of the accelerometer by loss of movement intensity and by the child suckling on the tape around the accelerometer cannot be excluded. This limita-tion could have caused a bias due to varying hand–mouth contacts in MS I compared to MS II. To avoid disrup-tive suckling movements, future studies should place the accelerometers on the infant’s feet or even use more than one accelerometer at the lower and the upper extremities simultaneously.
Primarily, the accelerometer was fixed to the infant’s left hand. However, to ascertain a good fixation of the sensor, in 15 measurements, the accelerometer was placed on the right hand because of left-sided not removable baby wrist-bands. As only target-directed movements should show a right-hand dominance (Ottaviano et al. 1989), we did not insist on adapting the sensor always to the left hand. Future studies should investigate both sides in parallel to definitely rule out a hand preference. Particularly, in MS I, the moment of measurement was mainly defined by the private time schedule of mothers and infants at the mater-nity ward. Infants (neonates) needed to be breastfed or fell asleep during the 1 h measurement period; thus, lack of movement while sleeping and interaction with the mother during feeding may have caused a certain bias. To ascertain a 1 h lasting measurement with minimal length to apply DFA, an adjustment for different behavioral states (sleep-ing, drink(sleep-ing, sucking) was not possible.In four subjects, disconnection of the wire during ongoing measurement was shortening the record time to less than one hour. These measurements were excluded from the data analysis.
Various studies have described the characteristics of SMs in infants with respect to their timing. For exam-ple, the kicking frequency of infants has been determined to be between 4 and 80 times per minute (Piek and Car-man 1994). Bos et al. described the trajectories of SMs in a quantitative manner and found that General Movement sequences occurred between 4 and 5 times per 10 min with a duration of 20–30 s. Other movement sequences such as isolated hand movements and twitches occurred more frequently (5–30 times per 10 min and 10–30 times per 10 min, respectively) but were shorter in duration (Bos
et al. 1997). The main information content of spontaneous movements is estimated below 3 Hz which is in principle in a safe range. Nevertheless, for small window sizes of the DFA, we may have a potential error due to the low sampling frequency. However, as a result of our simulation study (see Appendix 3), this error most likely won’t affect the calcula-tion of changes in the values of α. Future faster technology with even smaller and more sensitive accelerometers should aim for higher sampling resolutions and accuracy.
Conclusion and outlook
We demonstrated that motor activity in infants shows fractal-type correlation, indicating that single movement accelerations are not independent of previous movement accelerations—in terms of a deterministic motor system sensitive to past behavior. Correlation properties were described by the parameter alpha, which is sensitive to motor developmental changes. As such the clinical impact of our findings is particularly relevant because these sim-ple methods are potentially useful for detecting maturation of motor behavior during a time window in which clinical assessment of spontaneous movements has been shown to be predictive for later neurological outcome. The technique could be particularly useful for future clinical studies aimed at identifying infants with a high risk of impaired neurological outcome in an observer-independent manner with little effort. Furthermore, the methods could be used to investigate the effect of early intervention/therapy in larger cohorts of high-risk infants in a standardized setting.
Acknowledgments We would like to thank PD Dr. Matthias Nelle
(Department of Neonatology, University Children’s Hospital, Bern Switzerland), Brigitte Püntener and Prof. Dr. Lorenz Radlinger (Uni-versity of Applied Sciences, Health, Bern, Switzerland) for their support.
Conflict of interest The authors declare that they have no conflict
of interest.
Appendix 1: Detrended fluctuation analysis (DFA)
Detrended fluctuation analysis has been introduced in medical research to assess vital signals and biofeedback systems. DFA is an extension of fluctuation analysis of non-stationary time series (a signal whose mean and vari-ance dynamics change over time) of stochastic processes to determine self-affinity of the signal and uncover fractal like properties. DFA was implemented according to Peng et al. (1995) as follows: The time series was first integrated and then divided into non-overlapping windows of size n. For each window, a least square first-order approximation was
obtained which represents the “trend” in the signal. This first approximation of the integrated signal was denoted y_n(k). By subtracting y_n(k) from the integrated signal y(k), the detrended signal was obtained. This is the approxi-mation error en(k) for which the root mean squared error was obtained and denoted
where N is the number of intervals in the signal. Fn was obtained for several different window lengths n. With increas-ing window length, the approximation error increased: Log (n) versus log (Fn) gave a monotonically increasing relation that in the context of physiological signals has been found to be linear with slope alpha. Previous research has provided evidence for fractal characteristics in the signal: Fn and n are related via a power-law, thus the linear characteristic of the log–log relation. This scaling behaviour can then be precisely characterized by the value of alpha.
While Peng et al. (1993) have generally interpreted DFA as a measure of long-range correlations, recently Dingwell
Fn= 1 N N k=1 en(k)2
et al. (2010) and Maraun et al. (2004) proposed the inter-pretation of DFA as an indicator of persistence and anti-per-sistence (see “Introduction”). Herein we have followed their approach, thus, our results are interpretated in terms of per-sistence and anti-perper-sistence of the acceleration time series.
An accelerometer time series with an α of 0.5 indicates a system that is not deterministic and is prone to instabili-ties, whereas higher α value implies more deterministic behavior with stronger correlations between an accelerated movement and its preceding accelerated movements (=per-sistence of an acceleration time series).
Appendix 2: Statistical tests using surrogate time series
Following Dingwell and Cusumano (2010), we generated for each measured time series one thousand randomly shuf-fled surrogates by independently permuting the order of the values in the time series (Hausdorff et al. 1995; Gates and Dingwell 2007; Theiler et al. 1992). These surrogates were used to test the hypothesis that the participants controlled their movements by sending signals to their muscles that
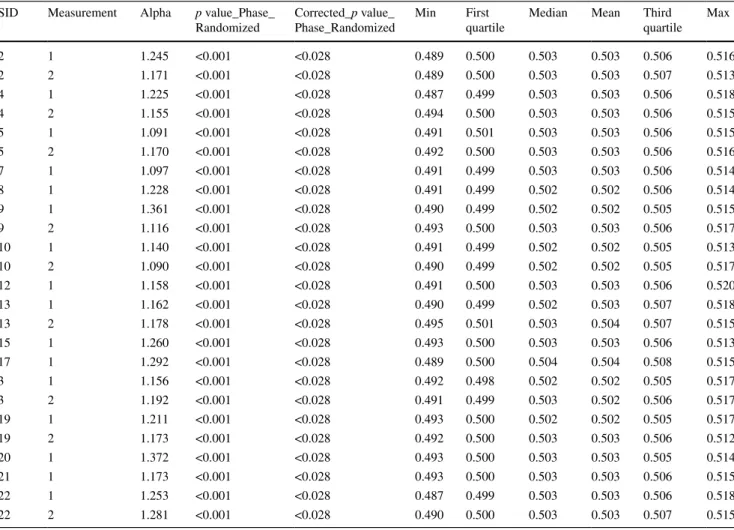
Table 5 Shuffling surrogate analysis MS I
SID Measurement Alpha p value_Phase_ Randomized
Corrected_p value_ Phase_Randomized
Min First quartile
Median Mean Third quartile Max 2 1 1.245 <0.001 <0.028 0.489 0.500 0.503 0.503 0.506 0.516 2 2 1.171 <0.001 <0.028 0.489 0.500 0.503 0.503 0.507 0.513 4 1 1.225 <0.001 <0.028 0.487 0.499 0.503 0.503 0.506 0.518 4 2 1.155 <0.001 <0.028 0.494 0.500 0.503 0.503 0.506 0.515 5 1 1.091 <0.001 <0.028 0.491 0.501 0.503 0.503 0.506 0.515 5 2 1.170 <0.001 <0.028 0.492 0.500 0.503 0.503 0.506 0.516 7 1 1.097 <0.001 <0.028 0.491 0.499 0.503 0.503 0.506 0.514 8 1 1.228 <0.001 <0.028 0.491 0.499 0.502 0.502 0.506 0.514 9 1 1.361 <0.001 <0.028 0.490 0.499 0.502 0.502 0.505 0.515 9 2 1.116 <0.001 <0.028 0.493 0.500 0.503 0.503 0.506 0.517 10 1 1.140 <0.001 <0.028 0.491 0.499 0.502 0.502 0.505 0.513 10 2 1.090 <0.001 <0.028 0.490 0.499 0.502 0.502 0.505 0.517 12 1 1.158 <0.001 <0.028 0.491 0.500 0.503 0.503 0.506 0.520 13 1 1.162 <0.001 <0.028 0.490 0.499 0.502 0.503 0.507 0.518 13 2 1.178 <0.001 <0.028 0.495 0.501 0.503 0.504 0.507 0.515 15 1 1.260 <0.001 <0.028 0.493 0.500 0.503 0.503 0.506 0.513 17 1 1.292 <0.001 <0.028 0.489 0.500 0.504 0.504 0.508 0.515 3 1 1.156 <0.001 <0.028 0.492 0.498 0.502 0.502 0.505 0.517 3 2 1.192 <0.001 <0.028 0.491 0.499 0.503 0.502 0.506 0.517 19 1 1.211 <0.001 <0.028 0.493 0.500 0.502 0.502 0.505 0.517 19 2 1.173 <0.001 <0.028 0.492 0.500 0.503 0.503 0.506 0.512 20 1 1.372 <0.001 <0.028 0.493 0.500 0.503 0.503 0.505 0.514 21 1 1.173 <0.001 <0.028 0.493 0.500 0.503 0.503 0.506 0.515 22 1 1.253 <0.001 <0.028 0.487 0.499 0.503 0.503 0.506 0.518 22 2 1.281 <0.001 <0.028 0.490 0.500 0.503 0.503 0.507 0.515
are temporally independent from previous signals. The dis-tribution of alpha values displayed by the surrogate time series clearly allows for a rejection of this hypothesis for each participant at a significance level of α = 0.05 (see Tables 5, 6), after correcting the p values for multiple com-parison using Bonferroni’s method.
Dingwell and Cusumano (2010) demonstrated that phase-randomized surrogates of stride-length time series and of stride-time time series obtained from young healthy adults walking on a motorized treadmill cannot be distinguished from the original time series in terms of detrended fluctua-tion analysis. Thereby, the hypothesis cannot be rejected, that subjects independently choose their stride-time and stride-length as temporally correlated auto-regressive (AR) process (Theiler et al. 1992; Schreiber and Schmitz 2000), or more generally as nearly equivalent auto-regressive moving-average (ARMA) process (Theiler et al., p. 81). We investigated to what extent this result applies to time series of motor acceleration measurements in healthy infants (at 40–44 and 50–55 weeks gestational age). Accordingly, we generated for each measured time series one thousand phase-randomized surrogates. That is, for each time series, we computed the Fourier transform, randomized the phase spectrum, and then computed the inverse Fourier transform (Theiler et al. 1992; Schreiber and Schmitz 2000; Dingwell
and Cusumano 2000). These surrogates preserve the power spectra and auto-correlation properties of each original time series, thus preserving their statistical persistence.
Based on our results, for almost all participants, the aforementioned hypothesis, now concerning the subjects’ limb acceleration patterns, cannot be rejected. Tables 7 and 8 list the resulting p values from our statistical analysis using phase-randomized surrogate data for MS I and MS II.
The present work focuses on statistically significant changes in the alpha value of time series of motor accel-eration measurements taken at 40–44 and at 50–55 weeks of gestational age and their potential interpretation as an indicator of maturational changes of motor behavior. How-ever, we considered it pertinent to conduct similar tests as the ones performed in Dingwell and Cusumano (2010) in order to investigate potential analogies in the properties of the time series under consideration.
All calculations were conducted in R (R Core Team 2012).
Appendix 3: Sampling frequency issues during measurements
In order to study potential issues with the method of detrended fluctuation analysis that could arise from a low
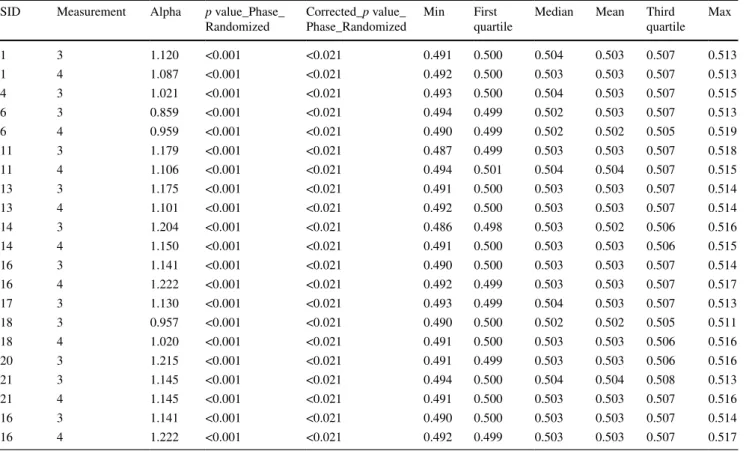
Table 6 Shuffling surrogate analysis MS II
SID Measurement Alpha p value_Phase_ Randomized
Corrected_p value_ Phase_Randomized
Min First quartile
Median Mean Third quartile Max 1 3 1.120 <0.001 <0.021 0.491 0.500 0.504 0.503 0.507 0.513 1 4 1.087 <0.001 <0.021 0.492 0.500 0.503 0.503 0.507 0.513 4 3 1.021 <0.001 <0.021 0.493 0.500 0.504 0.503 0.507 0.515 6 3 0.859 <0.001 <0.021 0.494 0.499 0.502 0.503 0.507 0.513 6 4 0.959 <0.001 <0.021 0.490 0.499 0.502 0.502 0.505 0.519 11 3 1.179 <0.001 <0.021 0.487 0.499 0.503 0.503 0.507 0.518 11 4 1.106 <0.001 <0.021 0.494 0.501 0.504 0.504 0.507 0.515 13 3 1.175 <0.001 <0.021 0.491 0.500 0.503 0.503 0.507 0.514 13 4 1.101 <0.001 <0.021 0.492 0.500 0.503 0.503 0.507 0.514 14 3 1.204 <0.001 <0.021 0.486 0.498 0.503 0.502 0.506 0.516 14 4 1.150 <0.001 <0.021 0.491 0.500 0.503 0.503 0.506 0.515 16 3 1.141 <0.001 <0.021 0.490 0.500 0.503 0.503 0.507 0.514 16 4 1.222 <0.001 <0.021 0.492 0.499 0.503 0.503 0.507 0.517 17 3 1.130 <0.001 <0.021 0.493 0.499 0.504 0.503 0.507 0.513 18 3 0.957 <0.001 <0.021 0.490 0.500 0.502 0.502 0.505 0.511 18 4 1.020 <0.001 <0.021 0.491 0.500 0.503 0.503 0.506 0.516 20 3 1.215 <0.001 <0.021 0.491 0.499 0.503 0.503 0.506 0.516 21 3 1.145 <0.001 <0.021 0.494 0.500 0.504 0.504 0.508 0.513 21 4 1.145 <0.001 <0.021 0.491 0.500 0.503 0.503 0.507 0.516 16 3 1.141 <0.001 <0.021 0.490 0.500 0.503 0.503 0.507 0.514 16 4 1.222 <0.001 <0.021 0.492 0.499 0.503 0.503 0.507 0.517
sampling frequency during the measurement, we con-ducted a simulation study. We investigated the effect of applying detrended fluctuation analysis to a time series obtained from an “original” time series by sampling the time series with a lower sampling rate. This sampling procedure boils down to leaving out one or more consec-utive values from the original time series in a periodic manner.
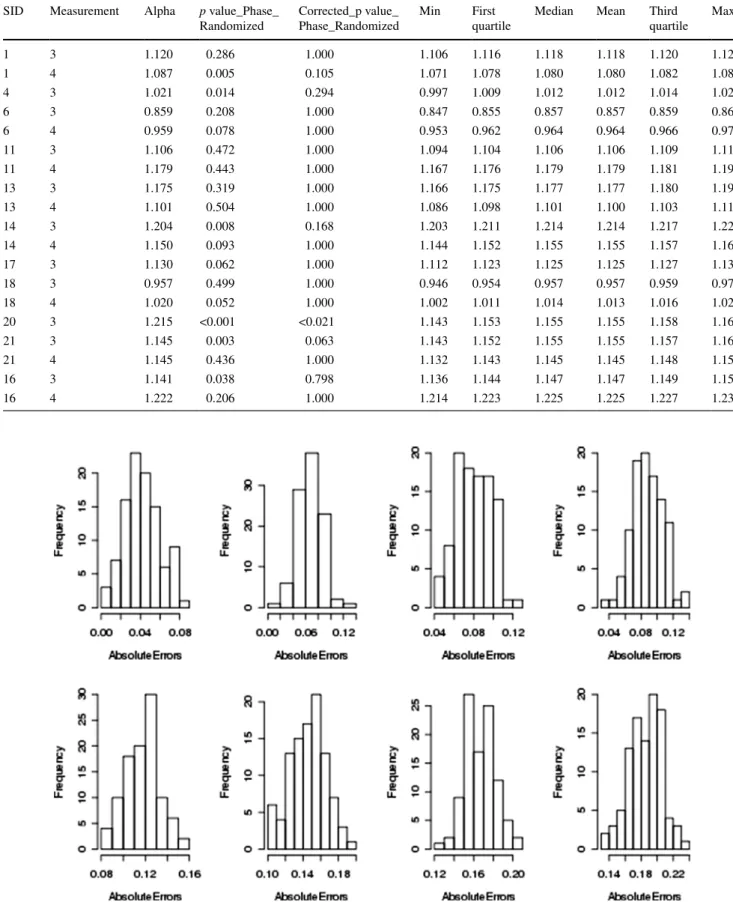
The “original” time series consisted of pink noise gen-erated via simulation. It can be theoretically shown that the alpha value obtained from such a time series should be approximately equal to 1. We generated one thousand such time series and with each one we conducted the pling procedure with a fixed sampling rate. Different sam-pling rates were used in order to assess the strength of the effect as the sampling frequency is lowered. For a given sampling rate, the aforementioned procedure yielded one thousand shorter time series. We then compared the alpha value of the original time series with the alpha value of the series obtained via the sampling procedure. We observed a change of the alpha value, which was consistently in the
same direction. The distribution of the differences in the alpha values is displayed in Fig. 4.
Since the sampling procedure generates shorter time series, we also generated additional one thousand pink noise time series of the same length as the ones resulting from the sampling procedure. We compared the distributions of the alpha values in each of the two groups observing a statistically significant difference (p values ≤1.705e−10, Mann–Whitney test, p values ≤1.866e−8, Kolmogorov– Smirnov test).
The mean strength of the effect varied with the sampling frequency used. The introduced relative error (in percent-age) ranges from 4.65 %, when leaving out every other value, to 19.37 %, when only every hundredth value is con-sidered (see Fig. 5).
Fortunately, the effect is consistent in direction, sug-gesting that the errors in the alpha values caused by a low sampling rate during measurement should not jeopardize the validity of our main results. Of central importance for our study is the change in the alpha values during develop-ment. While the interpretation of the actual absolute alpha
Table 7 Phase-randomized surrogate analysis MS I
SID Measurement Alpha p value_Phase_ Randomized
Corrected_p value_ Phase_Randomized
Min First quartile
Median Mean Third quartile Max 2 1 1.245 <0.001 <0.028 1.257 1.266 1.269 1.269 1.271 1.279 2 2 1.171 0.002 0.056 1.170 1.180 1.182 1.182 1.185 1.194 4 1 1.225 0.358 1.000 1.213 1.221 1.223 1.223 1.226 1.233 4 2 1.155 0.500 1.000 1.143 1.153 1.155 1.155 1.157 1.164 5 1 1.091 0.160 1.000 1.075 1.085 1.088 1.088 1.090 1.098 5 2 1.170 0.253 1.000 1.156 1.165 1.168 1.168 1.170 1.181 7 1 1.097 0.104 1.000 1.081 1.091 1.093 1.093 1.095 1.105 8 1 1.228 0.308 1.000 1.215 1.224 1.226 1.226 1.229 1.237 9 1 1.361 <0.001 <0.028 1.363 1.373 1.375 1.375 1.379 1.388 9 2 1.116 0.007 0.196 1.113 1.122 1.125 1.125 1.127 1.138 10 1 1.140 0.400 1.000 1.131 1.139 1.141 1.141 1.143 1.155 10 2 1.090 0.224 1.000 1.083 1.090 1.092 1.092 1.094 1.102 12 1 1.158 0.161 1.000 1.149 1.159 1.161 1.161 1.163 1.172 13 1 1.162 0.337 1.000 1.154 1.161 1.164 1.164 1.166 1.174 13 2 1.178 0.048 1.000 1.173 1.181 1.184 1.184 1.186 1.193 15 1 1.260 <0.001 <0.028 1.233 1.241 1.244 1.244 1.246 1.256 17 1 1.292 0.072 1.000 1.275 1.285 1.287 1.287 1.290 1.298 3 1 1.156 0.439 1.000 1.143 1.154 1.156 1.156 1.159 1.168 3 2 1.192 0.003 0.084 1.191 1.199 1.202 1.202 1.204 1.213 19 1 1.211 0.002 0.056 1.209 1.219 1.221 1.221 1.224 1.232 19 2 1.173 0.372 1.000 1.160 1.169 1.172 1.172 1.174 1.182 20 1 1.372 0.179 1.000 1.363 1.373 1.376 1.376 1.379 1.388 21 2 1.173 0.267 1.000 1.161 1.168 1.171 1.171 1.173 1.182 22 1 1.253 0.322 1.000 1.237 1.249 1.252 1.252 1.254 1.266 22 2 1.281 0.483 1.000 1.270 1.278 1.280 1.281 1.283 1.292
Fig. 4 Histograms of absolute errors due to subsampling. The
dis-tribution of the differences in the alpha values due to sampling quency issues. Every panel corresponds to a different sampling
fre-quency. The number of data points left out between recorded values are: Upper row, from left to right 1, 2, 3, 4. Lower Row, from left to
right 10, 20, 50, 100
Table 8 Phase-randomized surrogate analysis MS II
SID Measurement Alpha p value_Phase_ Randomized
Corrected_p value_ Phase_Randomized
Min First quartile
Median Mean Third quartile Max 1 3 1.120 0.286 1.000 1.106 1.116 1.118 1.118 1.120 1.129 1 4 1.087 0.005 0.105 1.071 1.078 1.080 1.080 1.082 1.089 4 3 1.021 0.014 0.294 0.997 1.009 1.012 1.012 1.014 1.023 6 3 0.859 0.208 1.000 0.847 0.855 0.857 0.857 0.859 0.866 6 4 0.959 0.078 1.000 0.953 0.962 0.964 0.964 0.966 0.976 11 3 1.106 0.472 1.000 1.094 1.104 1.106 1.106 1.109 1.117 11 4 1.179 0.443 1.000 1.167 1.176 1.179 1.179 1.181 1.191 13 3 1.175 0.319 1.000 1.166 1.175 1.177 1.177 1.180 1.192 13 4 1.101 0.504 1.000 1.086 1.098 1.101 1.100 1.103 1.112 14 3 1.204 0.008 0.168 1.203 1.211 1.214 1.214 1.217 1.225 14 4 1.150 0.093 1.000 1.144 1.152 1.155 1.155 1.157 1.165 17 3 1.130 0.062 1.000 1.112 1.123 1.125 1.125 1.127 1.134 18 3 0.957 0.499 1.000 0.946 0.954 0.957 0.957 0.959 0.970 18 4 1.020 0.052 1.000 1.002 1.011 1.014 1.013 1.016 1.029 20 3 1.215 <0.001 <0.021 1.143 1.153 1.155 1.155 1.158 1.167 21 3 1.145 0.003 0.063 1.143 1.152 1.155 1.155 1.157 1.169 21 4 1.145 0.436 1.000 1.132 1.143 1.145 1.145 1.148 1.156 16 3 1.141 0.038 0.798 1.136 1.144 1.147 1.147 1.149 1.156 16 4 1.222 0.206 1.000 1.214 1.223 1.225 1.225 1.227 1.237
values might be interesting (and controversial, as pointed out in the literature, see, for instance, Maraun et al. 2004), we focused herein more on the change of this value during development. We believe that, as long as we consistently use the same sampling frequency during all measurements, the reported changes in the value of alpha properly quantify the changes in the statistical persistence and anti-persis-tence properties of the sampled time series. Consequently, the reported changes in the value of alpha might represent a legitimate way of systematically quantifying neurological maturation.
All calculations were conducted in R (R Core Team 2012).
References
Baldwin DN, Suki B, Pillow JJ, Roiha HL, Minocchieri S, Frey U (2004) Effect of sighs on breathing memory and dynamics in healthy infants. J Appl Physiol 97:1830–1839
Bernhardt I, Marbacher M, Hilfiker R, Radlinger L (2011) Inter- and intra-observer agreement of Prechtl’s method on the qualitative assessment of general movements in preterm, term and young infants. Early Hum Dev 87(9):633–639
Bland JM, Altman DG (1986) Statistical methods for assessing agree-ment between two methods of clinical measureagree-ment. Lancet 1:307–310
Bos AF, van Loon AJ, Martijn A, van Asperen RM, Okken A, Prechtl HF (1997) Spontaneous motility in preterm, small-for-gestational age infants I. Quantitative aspects. Early Hum Dev 50:115–129 Burger M, Louw QA (2009) The predictive validity of general
move-ments—a systematic review. Eur J Paediatr Neurol 13:408–420 Cernelc M, Suki B, Reinmann B, Hall GL, Frey U (2002) Correlation
properties of tidal volume and end-tidal O2 and CO2 concentra-tions in healthy infants. J Appl Physiol 92:1817–1827
Cioni G, Prechtl HF, Ferrari F, Paolicelli PB, Einspieler C, Roversi MF (1997) Which better predicts later outcome in full-term infants: quality of general movements or neurological examina-tion? Early Hum Dev 50:71–85
Constantine W, Percival D (2012) Fractal: Fractal Time Series Modeling and Analysis. R package version 1.1-1. http:// CRAN.R-project.org/package=fractal
Dingwell JB, Cusumano JP (2000) Nonlinear time series analysis of normal and pathological human walking. Chaos 10:848–863 Dingwell JB, Cusumano JP (2010) Re-interpreting detrended
fluc-tuation analyses of stride-to-stride variability in human walking. Gait Posture 32:348–353
Disselhorst-Klug C, Heinze F, Breitbach-Faller N, Schmitz-Rode T, Rau G (2012) Introduction of a method for quantitative evalu-ation of spontaneous motor activity development with age in infants. Exp Brain Res 218:305–313
Droit S, Boldrini A, Cioni G (1996) Rhythmical leg movements in low-risk and brain-damaged preterm infants. Early Hum Dev 44:201–213
Einspieler C, Prechtl HF (2005) Prechtl’s assessment of general movements: a diagnostic tool for the functional assessment of the young nervous system. Ment Retard Dev Disabil Res Rev 11:61–67
Einspieler C, Prechtl HF, Ferrari F, Cioni G (2004) Prechtl’s method on the qualitative assessment of general movements in preterm. Cambridge University Press, Term and Young Infants
Ferrari F, Cioni G, Prechtl HF (1990) Qualitative changes of general movements in preterm infants with brain lesions. Early Hum Dev 23:193–231
Gates DH, Dingwell JB (2007) Peripheral neuropathy does not alter the fractal dynamics of gait stride intervals. J Appl Physiol 102(3):965–971
Gima H, Ohgi S, Morita S, Karasuno H, Fujiwara T, Abe K (2011) A dynamical system analysis of the development of spontane-ous lower extremity movements in newborn and young infants. J Physiol Anthropol 30(5):179–186
Goldberger AL, Amaral LA, Hausdorff JM, Ivanov PC, Peng CK, Stanley HE (2002) Fractal dynamics in physiology: altera-tions with disease and aging. Proc Natl Acad Sci USA 99(Suppl 1):2466–2472
Hausdorff JM, Peng CK, Ladin Z, Wei JY, Goldberger AL (1995) Is walking a random walk? Evidence for long-range correlations in stride interval of human gait. J Appl Physiol 78:349–358 Hausdorff JM, Purdon PL, Peng CK, Ladin Z, Wei JY, Goldberger
AL (1996) Fractal dynamics of human gait: stability of long-range correlations in stride interval fluctuations. J Appl Physiol 80:1448–1457
Hausdorff JM, Mitchell SL, Firtion R, Peng CK, Cudkowicz ME, Wei JY, Goldberger AL (1997) Altered fractal dynamics of gait: reduced stride-interval correlations with aging and Huntington’s disease. J Appl Physiol 82:262–269
Hausdorff JM, Zemany L, Peng C, Goldberger AL (1999) Matura-tion of gait dynamics: stride-to-stride variability and its temporal organization in children. J Appl Physiol 86:1040–1047
Karch D, Kim KS, Wochner K, Pietz J, Dickhaus H, Philippi H (2008) Quantification of the segmental kinematics of spontaneous infant movements. J Biomech 41:2860–2867
Karch D, Wochner K, Kim K, Philippi H, Hadders-Algra M, Pietz J, Dickhaus H (2010) Quantitative score for the evaluation of kin-ematic recordings in neuropediatric diagnostics. Detection of complex patterns in spontaneous limb movements. Methods Inf Med 49:526–530
Ligges U (2011) Tune R: Analysis of music. http://r-forge.r-project.org/ projects/tuner/
Maraun D, Rust HW, Timmer J (2004) Tempting long-memory—on the interpretation of DFA results. Nonlinear Process Geophys 11:495–503
Meinecke L, Breitbach-Faller N, Bartz C, Damen R, Rau G, Dissel-horst-Klug C (2006) Movement analysis in the early detection
of newborns at risk for developing spasticity due to infantile cer-ebral palsy. Hum Mov Sci 25:125–144
Ohgi S, Morita S, Loo KK, Mizuike C (2007) A dynamical systems analysis of spontaneous movements in newborn infants. J Mot Behav 39:203–214
Ohgi S, Morita S, Loo KK, Mizuike C (2008) Time series analysis of spontaneous upper-extremity movements of premature infants with brain injuries. Phys Ther 88:1022–1033
Ottaviano S, Guidetti V, Allemand F, Spinetoli B, Seri S (1989) Lat-erality of arm movement in full-term newborn. Early Hum Dev 19:3–7
Peng CK, Mietus J, Hausdorff JM, Havlin S, Stanley HE, Goldberger AL (1993) Long-range anticorrelations and non-gaussian behav-ior of the heartbeat. Phys Rev Lett 70:1343–1346
Peng CK, Havlin S, Stanley HE, Goldberger AL (1995) Quantifica-tion of scaling exponents and crossover phenomena in nonsta-tionary heartbeat time-series. Chaos 5:82–87
Piek JP (2001) Is a quantitative approach useful in the comparison of spontaneous movements in fullterm and preterm infants? Hum Mov Sci 20:717–736
Piek JP, Carman R (1994) Developmental profiles of spontaneous movements in infants. Early Hum Dev 39:109–126
Prechtl HF (1974) The behavioural states of the newborn infant (a review). Brain Res 76:185–212
R Core Team (2012) R: A language and environment for statistical computing. R Foundation for Statistical Computing, Vienna, Aus-tria (2012). ISBN 3-900051-07-0, http://www.R-project.org
Schreiber T, Schmitz A (2000) Surrogate time series. Physics 142(3–4):346–382
Spittle AJ, Doyle LW, Boyd RN (2008) A systematic review of the clinimetric properties of neuromotor assessments for preterm infants during the first year of life. Dev Med Child Neurol 50:254–266
Stern G, Beel J, Suki B, Silverman M, Westaway J, Cernelc M, Bald-win D, Frey U (2009) Long-range correlations in rectal tempera-ture fluctuations of healthy infants during maturation. PLoS One 4:e6431
Thamrin C, Frey U (2009) Complexity and respiratory growth: a developing story. J Appl Physiol 106:753–754
Thamrin C, Stern G, Frey U (2010) Fractals for physicians. Paediatr Respir Rev 11:123–131
Theiler J, Eubank S, Longtin A, Galdrikian B, Farmer JD (1992) Test-ing for nonlinearity in time series: the method of surrogate data. Phys D 58(1–4):77–94
Vaal J, Van Soest AJ, Hopkins B, Sie LT, Van der Knaap MS (2000) Development of spontaneous leg movements in infants with and without periventricular leukomalacia. Exp Brain Res 135:94–105 Van der Heide J, Paolicelli PB, Boldrini A, Cioni G (1999) Kinematic
and qualitative analysis of lower extremitymovements in preterm infants with brain lesions. Phys Ther 79:546–557