HAL Id: hal-02395207
https://hal.archives-ouvertes.fr/hal-02395207
Submitted on 6 Dec 2019HAL is a multi-disciplinary open access archive for the deposit and dissemination of sci-entific research documents, whether they are pub-lished or not. The documents may come from teaching and research institutions in France or abroad, or from public or private research centers.
L’archive ouverte pluridisciplinaire HAL, est destinée au dépôt et à la diffusion de documents scientifiques de niveau recherche, publiés ou non, émanant des établissements d’enseignement et de recherche français ou étrangers, des laboratoires publics ou privés.
Selectivity of pyoverdine recognition by the FpvA
receptor of Pseudomonas aeruginosa from molecular
dynamics simulations
Benjamin Bouvier, Christine Cézard, Pascal Sonnet
To cite this version:
Benjamin Bouvier, Christine Cézard, Pascal Sonnet. Selectivity of pyoverdine recognition by the FpvA receptor of Pseudomonas aeruginosa from molecular dynamics simulations. Physical Chemistry Chemical Physics, Royal Society of Chemistry, 2015, 17 (27), pp.18022-18034. �10.1039/c5cp02939b�. �hal-02395207�
Selectivity of pyoverdine recognition by the FpvA
receptor of Pseudomonas aeruginosa from molecular
dynamics simulations
Benjamin Bouvier,* Christine Cézard, Pascal Sonnet
Laboratoire de Glycochimie, des Antimicrobiens et des Agroressources, CNRS FRE3517 / Université de Picardie Jules Verne – 10, rue Baudelocque, 80039 Amiens Cedex, France.
Abstract: The Gram-negative bacterium Pseudomonas aeruginosa, a ubiquitous
human opportunistic pathogen, has developed resistances to multiple antibiotics. It uses its primary native siderophore, pyoverdine, to scavenge the iron essential to its growth in the outside medium and transport it back into its cytoplasm. The FpvA receptor on the bacterial outer membrane recognizes and internalizes pyoverdine bearing its iron payload, but can also bind pyoverdines from other Pseudomonads or synthetic analogues. Pyoverdine derivatives could therefore be used as vectors to deliver antibiotics into the bacterium. In this study, we use molecular dynamics and free energy calculations to characterize the mechanisms and thermodynamics of the recognition of the native pyoverdines of P. aeruginosa and P. fluorescens by FpvA. Based on these results, we delineate the features that pyoverdines with high affinity for FpvA should possess. In particular, we show that (i) the dynamics and interaction of the unbound pyoverdines with water should be optimized with equal care as the interface contacts in the complex with FpvA; (ii) the C-terminal extremity of the pyoverdine chain, which appears to play no role in the bound complex, is involved in the intermediate stages of recognition; and (iii) the length and cyclicity of the pyoverdine chain can be used to fine-tune the kinetics of the recognition mechanism.
Keywords: pyoverdine, siderophore, FpvA, Gram-negative, antibiotics, molecular
dynamics, free energy calculations.
Introduction
Pyoverdines (PVDs) are fluorescent siderophore molecules synthetized by Gram-negative bacteria, such as the human opportunistic pathogen Pseudomonas aeruginosa, to act as their principal source of iron. In P. aeruginosa, the precursor of PVD is formed in the bacterial cytoplasm via nonribosomal peptide synthesis, by specific multi-enzymatic complexes called siderosomes.1 It is subsequently exported into the periplasm, where it undergoes maturation2, and excreted into the outside medium by the efflux pump PvdR-OpmQ.3 The very strong affinity of PVD for ferric (Fe3+) ions effectively enables this molecule to “rob” other binders of this ion by displacing the binding equilibrium in its favor, which permits the scavenging of ferric ions even in the most iron-depleted environments. The PVD/Fe3+ complex is then recognized by the TonB-dependent transporter FpvA (with additional minor contributions from transporter FpvB)4 and internalized into the periplasm.5-7 There, Fe3+ is reduced to Fe2+ and transported into the cytoplasm,8 while PVD is recycled back to the exterior medium.9,10 In addition to its role as iron scavenger, PVD plays an active role in the pyoverdine cell-surface signaling system (CSS) which senses extracellular stimuli, transduces the signal to the cytoplasm, and regulates the expression of stimuli-related genes (including those responsible for the biosynthesis of pyoverdine itself); as such, PVD participates in complex regulatory networks involving virulence and cell-to-cell interactions.11 Finally, the electron transfer capabilities and fluorescence properties of PVD also mark it out as a promising scaffold for biosensors, as was recently demonstrated for the rapid detection of pesticides in water.12
On its own, P. aeruginosa is responsible for 14% of hospital-acquired infections, where it affects immunodepressed patients,13 and is the principal cause of fatal lung decline in patients suffering from cystic fibrosis.14 It has acquired a resistance to numerous antibiotics15 and is rapidly evolving into a major public health problem with dire economical consequences.16 The incentive to find new therapeutic avenues against P. aeruginosa is therefore quite strong. A promising approach toward this goal is to take advantage of the fact that the FpvA transporter is specific not only to its endogenous pyoverdine PVDI, but is also able to bind and/or transport pyoverdines produced by other Pseudomonads17,18, as well as modified pyoverdines such as antibiotic-PVD conjugates19,20 or photoactivatable PVD analogues.21 The recognition of multiple iron scavengers benefits P. aeruginosa in the context of competitive growth under conditions of iron deprivation,22 but can potentially be used to conceive PVD analogues able to convey an antibiotic into the microorganism using a Trojan horse strategy, or to bind to FpvA in a non-reversible manner, blocking any further recognition and transport of the siderophore. However, this can only be achieved if the determinants of PVD recognition by FpvA are clearly understood. In particular, conformational transitions in both ligand and receptor that are known to occur during the binding of many known PVDs to FpvA suggest a possible effect of the flexibility of both molecules on the recognition mechanism. In this study, we apply all-atom molecular dynamics simulations to the investigation of the mechanisms of cognate and non-cognate PVD recognition and binding by the FpvA receptor of P. aeruginosa. These methods provide a straightforward representation of the plasticity of both partners at the atomic level, but can also yield quantitative estimates of kinetic and thermodynamic barriers to the formation and dissociation of FpvA/PVD complexes that are essential for the understanding of the preference of FpvA for different PVDs. We use these results to suggest preliminary guidelines for the conception of possible antibiotic compounds targeting the FpvA transporter.
Systems under study
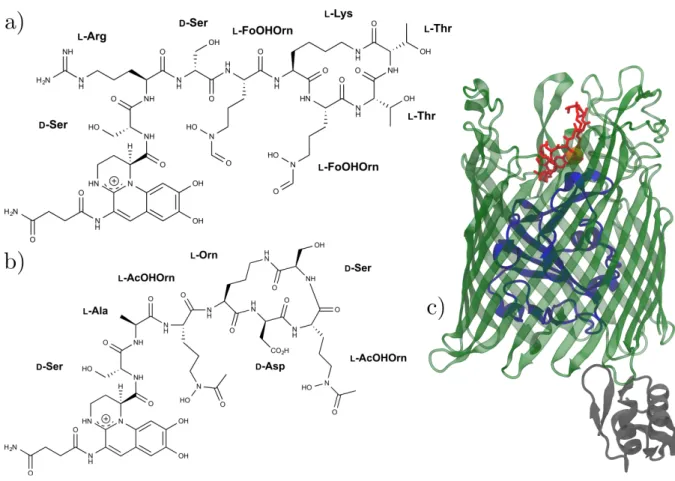
More than 100 unique pyoverdines from different species and strains of Pseudomonas have been identified to date (see 23 and references therein); however, all share a number of common traits. A fluorescent chromophore, derived from 2,3-diamino-6,7-dihydroquinoline, binds Fe3+ via its catechol function. Grafted to its C3 atom is a
dicarboxylic acid side-chain, which is known to play a role in the biosynthesis of PVD.24 Finally, the N-terminus of a linear or partly cyclic polypeptide chain, specific to each PVD, is linked to the carbonyl function of the chromophore; it often contains nonstandard and/or D-handed aminoacids and interacts with Fe3+ through two hydroxamate or hydroxycarboxylate functions. Consequently, the ferric ion is bound hexavalently to PVD via 6 oxygen atoms. This study focuses on two pyoverdines in their iron-binding forms: PVDI, the cognate siderophore of FpvA from P. aeruginosa PA01, and PVDG173 from Pseudomonas fluorescens G173 (Fig. 1a/b). Both these
ferric-pyoverdines can bind to FpvA, forming complexes whose structures have experimentally been resolved; however, while PVDI binds with a very high affinity of 0.1 nM, the affinity of PVDG173 is much lower and presently unknown.17
The outer membrane siderophore transporter FpvA (Fig. 1c) 17,25 consists of three domains: (i) a β-barrel domain comprising 600 aminoacids, mostly inserted into the outer membrane but also featuring flexible extracellular loops; (ii) a 150-residue, N-terminal globular “plug” region obstructing the pore; (iii) a signaling domain on the periplasmic side and an associated TonB box sequence, which is the locus of the interaction with the TonB protein of the TonB-ExbB-ExbD complex located in the inner membrane.26 This complex harnesses the inner membrane proton-motive force to provide the energy required for the transport of siderophores through FpvA. In particular, the formation of a channel large enough to allow the passage of the bulky siderophore/Fe3+ complex requires the release of the plug from the β-barrel domain; the release mechanism is presently unknown but is expected to be energetically
costly, due to the dense network of hydrogen bonds and polar contacts between these two domains.21
Fig. 1 The molecules under study: structural formulas of siderophores (a) PVDI and
(b) PVDG173; (c) cartoon representation of the FpvA transporter binding PVDI
(green: β-barrel pore; blue: plug domain; gray: TonB signal sequence; red: PVDI; orange: Fe3+; the periplasmic side of the pore corresponds to the bottom of the figure).
Methods
Alchemical double decoupling method
The standard binding free energies of the studied PVDs to FpvA were computed using the alchemical double decoupling method.27 The goal is to compute the
equilibrium constant Kb associated with the binding reaction of ligand L to receptor
R: 𝑅 + 𝐿 ⇋ 𝑅𝐿. It can be defined as 𝐾! = 𝑅𝐿 𝑅 𝐿 , where the brackets denote the concentration of the corresponding species. The standard binding free energy is defined as Δ𝐺!! = −𝑘
!𝑇𝑙𝑛 𝐶!𝐾! where kB is the Boltzmann constant, T the
temperature and C0 the standard concentration. The computation of this value can be performed by considering a thermodynamical cycle, linking the endpoints of the binding process via a number of intermediate states (which need not possess physical sense) between which free energy differences can conveniently and accurately be computed. These states are selected to progressively “switch off” the interaction between the ligand and the receptor, and then progressively “switch on” the interaction between the ligand and the bulk solvent, using the so-called “alchemical” free energy perturbation approach.28 However, as the ligand is decoupled from its environment, it becomes able to sample larger regions of conformational space by escaping the position, relative rotation and conformation to which it is restricted inside the binding pocket. The inability to exhaustively sample this additional volume at every value of the “alchemical” reaction coordinate leads to hysteresis and convergence problems in the determination of the free energy difference between the reaction endpoints.29 This issue can be alleviated by introducing restraining potentials to control the conformation of the ligand as well as its rigid-body translation and rotation relative to the receptor binding site, before the alchemical perturbation simulation is conducted, and removing them to “release” the ligand once it is complete. The free energy variation for the complete binding/unbinding transformation can hence be decomposed into a series of steps in which the different types of conformational restraints on the ligand, or its interaction with its surroundings, are switched on or off. By separating the effects of the alchemical decoupling of interactions from those of the conformational restraints, better convergence can be achieved.30-32
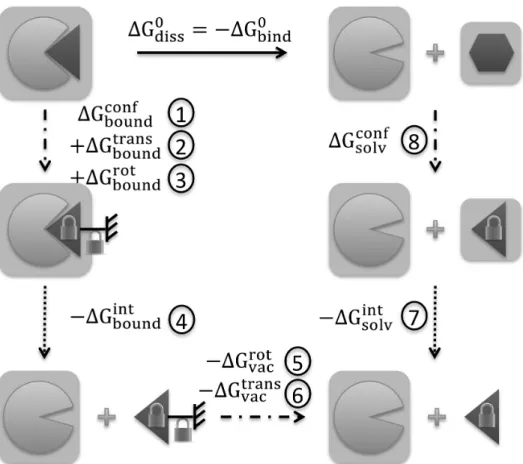
Fig. 2 Schematic representation of the steps performed to evaluate the binding free
energy ∆G!"#$! between FpvA (light partial disc) and PVD (dark wedge/hexagon, depending on conformation). A light grey box around FpvA or PVD denotes solvation. A padlock on PVD means its conformation is constrained, while a combination of the grounded symbol and a padlock denotes constrained rigid-body rotation and translation. The unbinding transformation is shown as a full arrow; dotted arrows correspond to alchemical transformations; dash-dotted arrows denote confinement or deconfinement simulations. Circled numbers identify each step. Abbreviations for free energy contributions: conf=conformation, rot=rotation, trans=translation, int=interaction, solv=solvated PVD, vac=decoupled PVD (vacuum).
Fig. 2 depicts the complete thermodynamical cycle and its constituent steps. Starting from the equilibrated structure of the bound FpvA/PVD complex, PVD was progressively restrained in its average bound conformation (step 1, ∆G!"#$%!"#$ ).
Translation (step 2, ∆G!"#$%!"# ) and rotation (step 3, ∆G !"#$%
!"#$% ) restraints were then
progressively introduced. PVD was subsequently decoupled from FpvA (step 4, −∆G!"#$%!"# ) and the rotation (step 5, −∆G!"#!"#) and translation (step 6,−∆G!"#!"#$%)
structure of PVD in water, conformational restraints were introduced to bring the ligand into its bound conformation (step 8, ∆G!"#$!"#$). Finally, the cycle was closed by decoupling PVD from the solvent (step 7, −∆G!"#$!"# ), connecting with the endpoint of
step 6. The final binding free energy can be written out as:
∆G!"#$! = −∆G !"#$% !"#$ − ∆G !"#$%!"# − ∆G!"#$%!"#$% + ∆G!"#$%!"# + ∆G!"#!"# + ∆G!"#!"#$% − ∆G!"#$!"# + ∆G !"#$!"#$ (1)
The decoupling simulations (steps 4 and 7) were performed bidirectionally (creation and annihilation) using the free energy perturbation method (see Supporting Information for details). The corresponding variation in free energy was then extracted using the Bennett acceptance ratio.33 The associated errors reported include both a statistical component (derived from the variance of the free energy estimator) and a systematic component (which arises from the finite length of the simulations and residual hysteresis effects between the creation and annihilation pathways).34 432 ns of total simulation time per PVD were computed, and the convergence of results with simulation length was checked (see Supporting Information). The conformational restraints on PVD were imposed by applying a quadratic restraining potential to a collective variable defined as the root mean square deviation (RMSD) of the heavy atoms of PVD from their positions in the bound complex, after rigid-body alignment on the same set of atoms. This restraint was introduced (resp. removed) over 30 ns by coupling its action to a parameter λ, which was varied from 0 (no restraint) to 1 (full restraint) (resp. from 1 to 0). The restraining free energy was then computed by integrating the derivative of the system’s energy with respect to λ. As before, the statistical error was computed from the variance of the derivatives corrected for correlation times,35 while the systematic error due to the discretization of the biasing coordinate was estimated from the residual hysteresis between the forward and reverse transformations.36 The rotation restraint was implemented by
acting on the angle of the optimal rotation superimposing the heavy atoms of PVD onto their position in the bound complex. The translation restraint acted upon the distance from the center of mass of PVD to the center of mass of the FpvA active site. As for the conformational restraint, the free energy contributions and errors associated with the translational and rotational restraints were evaluated by integrating the derivative of the energy with respect to the transition parameter λ, which was varied from 0 to 1 or 1 to 0 over 15 ns. It should be mentioned that systematic errors arise from multiple sources of different nature, some of which (e.g., persistent long-time correlations, forcefield and integration issues…) are very difficult to evaluate;37 however, the use of a thermodynamical cycle raises the chance that they cancel out at least partially.27
Minimal distance restraint
The minimum distance restraint methodology and its parameters are described in detail in earlier publications38,39 and will only be outlined here. The restraint imposes a minimum distance between two non-overlapping groups of atoms by acting on all atom pairs (with one atom in each group) according to the following biasing potential: E = E! !,!!!!!"# = k d!− d!"# ! !,!!!!!"# (2)
where index i identifies atom pairs and di is the Euclidean distance between the
atoms of pair i. The minimum separation dmin and force constant k are user-defined
parameters. The overall biasing potential acting on the system is the sum of the individual contributions of all possible pairs of atoms. To avoid the two groups of atoms from drifting apart from each other when di ≥ dmin ∀i , a similar quadratic
E = k d!− d!"# !, d! = min d! (3)
In turn, the biasing forces are computed as the negative gradient of the potential and added to those derived from the force field. A double-cutoff scheme is used for the efficient culling of distant atom pairs (numerous when large groups of atoms are constrained), preserving optimal scalability compared to an equivalent, unbiased molecular dynamics simulation. In this framework, a margin region surrounds the restrained region; atoms in the margin are not restrained (being farther apart than the user-specified minimum distance), but monitored for entry into the restrained region, whereas other atoms are simply ignored. The extension of the margin beyond the restrained region was chosen to be 2 Å, and the list of monitored atom pairs was rebuilt every ten integration steps. These values struck the best balance between accuracy and computational cost (which increased by less than 5% compared to the corresponding unbiased simulation). The minimum distance restraint is implemented in C++ as a dynamically linked library and interfaced to the NAMD 2.9 molecular dynamics package40 using Tcl bindings. The restraint software is available from the authors upon request.
The two atom groups employed to control the dissociation of the FpvA/PVD complexes were the PVD heavy atoms on the one hand, and the heavy atoms of the PVD binding site of FpvA on the other (residues 200, 204, 213, 228, 230-231, 362, 391, 431, 444, 446, 448, 597, 599, 600). For each of the two complexes under study (FpvA/PVDI and FpvA/PVDG173), unbinding simulations were started from the
structure with the smallest RMSD to the average geometry observed during the unbiased “production” simulation (which had an interpartner distance of approximately 2.6 Å in both cases). From there, 23 simulations of 9 ns each (of which the first ns was discarded for equilibration) were sequentially performed, increasing the interpartner distance from 2.6 to 5.0 Å in steps of 0.1 Å (amounting to a total of
184 ns effective simulation time for each complex). Each simulation was started from the endpoint of the previous one. The free energy profile (or potential of mean force) along the minimum distance coordinate was obtained from the combined population densities of the simulation windows and the instantaneous values of the biasing potential, using the weighted histogram analysis method (WHAM).41 Error estimates and convergence assessments were performed as detailed in Supporting Information.
System setup
The starting structures for apo-FpvA, FpvA/PVDI and FpvA/PVDG173 were taken
from the Protein Data Bank (id. 2W75, 2W16 and 2W6U, respectively). Starting geometries for the isolated pyoverdines were also taken from these PDB entries, for lack of available solution structures. Geometrical parameters and atomic charges for the standard amino acid residues of the siderophores were taken from the AMBER99SB force field.42 For the nonconventional residues (chromophore, ornithine derivatives and aminoacids with isopeptide side-chain bonds), additional parameterization was required and proceeded as follows. Geometrical parameters were taken from the AMBER99SB force field where available and from GAFF43 otherwise. Charge derivation was performed by combining the RESP method with a systematic fragment-based approach, as implemented in RED44 and RED-Server.45 Ferric iron was treated as ionically bound to the siderophores, rather than restrained using bond potentials, and was imposed a formal charge value of +3. Van der Waals parameters for iron were those used by Giammona.46 The FpvA protein residues were described using AMBER99SB.
All structures were placed in a truncated octahedral box extending at least 10 Å from the molecular surface and solvated with TIP3P47 water, K+ and Cl- ions (using the Joung-Cheatham monovalent ion parameters48) in the proportions of a 0.15 M KCl solution. The systems were minimized to convergence. Positional restraints of 5 kcal mol-1 Å-2 were imposed on the solute heavy atoms, and the temperature of the
systems was raised from 0 to 300 K over 1 ns. The restraints were progressively scaled down over 500 ps and the systems were simulated without restraints for a further 2 ns, before production runs of 50 ns each were begun.
Molecular dynamics simulations – general protocol
Molecular dynamics simulations were performed using NAMD 2.940 on a local distributed-memory cluster, the MeCS computing platform at Université de Picardie – Jules Verne, and the Turing BlueGene/Q supercomputer at IDRIS, CNRS. The use of a 2 fs integration time step was made possible by constraining all hydrogen-containing chemical bonds. Constant pressure (1 bar) and temperature (300 K) were imposed using Langevin dynamics (5 ps-1 damping coefficient)49 and Nosé-Hoover Langevin piston (period 200 ps, decay 100 ps).50 Boundary conditions were applied, and long-range electrostatics were computed every two steps using the Particle Mesh Ewald method51 with a real-space cutoff of 10 Å inside a multiple-time stepping scheme.
Molecular docking protocol
Flexible docking calculations of PVD/Fe onto FpvA were carried out using Autodock Vina52 interfaced with Pymol/Autodock.53 The coordinates of the receptor and siderophores, taken from the PDB as previously explained, were converted into the PDBQT format using MGLTools.54 The crystal structure of the FpvA/PVDI complex was taken as the reference system. The explored volume was defined as a cube with an edge length of 60 Å and centered on the siderophore binding site, and discretized using a point grid with a spacing of 0.375 Å. The docking poses were ranked according to their scores (which attempt to mimic binding free energies); indeed, the top scoring hit for PVDI corresponded to a conformation which was near-perfectly superimposable onto the corresponding experimental structure of the FpvA/PVDI complex.
Miscellaneous
Poisson-Boltzmann calculations were performed using APBS.55 The interface contacts between FpvA and PVD along the dissociation pathways were obtained using INTERVOR.56 Mutual information analyses were carried out with Scikit-learn.57 All molecular graphics were produced using VMD.58 All plots and figures were generated with Matplotlib.59
Results
Simulating PVDI, PVDG173 and FpvA
In this study, we have chosen to model the FpvA/PVD complexes in an explicit solvent environment rather than in the biologically more realistic lipopolysaccharide (LPS) membrane. There are several justifications to this choice. Foremost is the crucial dependence of the convergence of free energy calculations on the equilibration of all degrees of freedom that are orthogonal to the biased coordinates (interpartner distance for the separation restraint method, coupling of the ligand to its environment for the double decoupling scheme). The LPS membrane of Gram-negative bacteria is known to feature collective motion on very long timescales, which forced Kirschner and coworkers60 to simulate the system at an artificially high temperature of 350 K to achieve adequate sampling when validating their LPS forcefield. Water equilibration timescales being shorter, replacement of the LPS membrane by water will favor convergence – as will the fact that a simulation box of water molecules contains fewer particles and entails reduced computational complexity due to the use of highly optimized, specific routines for water in modern molecular dynamics packages. Since it is reasonable to expect that the effect of the membrane is similar whether or not the PVD ligand is bound to FpvA, any error committed is very likely to cancel out when considering free energy differences –
unlike convergence issues, which tend to add up from one simulation window to the next. Second, the recognition and binding of PVDs by FpvA involves parts of the transporter that do not form direct contacts with the membrane. The occurrence of transient loop-LPS interactions has been suggested, but not unarguably proven by the few studies that have tackled the subject61 – mostly because the dependence of these contacts on the initial positioning of the transporter inside the membrane is very strong, and much too costly to adequately sample. In addition, the LPS membrane is much more polar in nature than typical phospholipid bilayers, making its replacement with water less detrimental; in particular, the outer leaflet (which has the greatest probability of being relevant for the current study) is composed of polar sugars and Ca2+ ions, and has been shown both experimentally62 and computationally60 to be heavily permeated by water molecules. In fact, the accepted practice of replacing the LPS membrane by a traditional lipid bilayer (as in reference63, and still employed to date64) can be expected from recent studies60 to be at least as detrimental as our own approach. Third, very few validated force fields are available, to date, to describe the outer membrane of Gram-negative bacteria; the only all-atom candidate60 (the other alternative being united-atom65) is based on the GLYCAM force field66 and uses 1-4 scaling factors that renders it incompatible with protein force fields such as AMBER99 in all MD software except for the very latest version of AMBER. Our approach was further validated by showing that neither apo-FpvA nor any of the apo-FpvA/PVD complexes studied herein featured major structural deviations from their experimental structures when simulated in an aqueous medium for 50 ns, due to the very high rigidity of the β-barrel scaffold (see Supporting Information for details), proving that the membrane does not play an active role in the stability of the receptor. We also did not include the signaling domain and TonB box of FpvA in the simulated system; this is consistent with the absence of the TonB protein, the lack of experimental structural data for the plug-TonB box linker region, and the fact that only FpvA recognition and binding are studied (which occur at the
opposite side of the receptor and, unlike PVD internalization, do not involve the TonB protein).
Evaluation of binding free energies
Starting from the equilibrated structures of the FpvA receptor bound to PVDI and PVDG173, the alchemical double decoupling method was employed to evaluate the
binding free energy of each PVD to the receptor. The results, and their decomposition into the individual steps of the thermodynamical cycle (Fig. 2) are presented in Table 1. A value of 14.4 kcal mol-1 was found for the binding free energy of PVDI, in good agreement with its experimental determination of 0.1 nM (13.7 kcal mol-1).17 For PVDG173, a value of 5.2 kcal mol-1 was computed. This result is all the
more interesting since no corresponding experimental determination is available to date, and is fortified by the good performance of the double decoupling method on PVDI. It also conforms to the experimental upper threshold value of 10,000 nM (6.9 kcal mol-1) suggested by Greenwald and coworkers.17
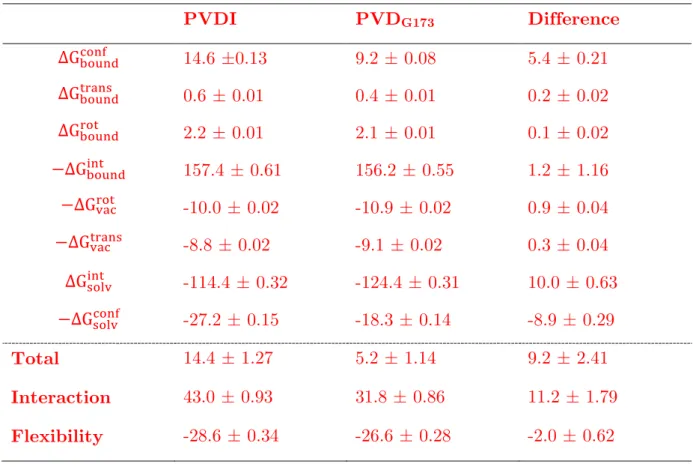
PVDI PVDG173 Difference ∆G!"#$%!"#$ 14.6 ±0.13 9.2 ± 0.08 5.4 ± 0.21 ∆G!"#$%!"#$% 0.6 ± 0.01 0.4 ± 0.01 0.2 ± 0.02 ∆G!"#$%!"# 2.2 ± 0.01 2.1 ± 0.01 0.1 ± 0.02 −∆G!"#$%!"# 157.4 ± 0.61 156.2 ± 0.55 1.2 ± 1.16 −∆G!"#!"# -10.0 ± 0.02 -10.9 ± 0.02 0.9 ± 0.04 −∆G!"#!"#$% -8.8 ± 0.02 -9.1 ± 0.02 0.3 ± 0.04 ∆G!"#$!"# -114.4 ± 0.32 -124.4 ± 0.31 10.0 ± 0.63 −∆G!"#$!"#$ -27.2 ± 0.15 -18.3 ± 0.14 -8.9 ± 0.29 Total 14.4 ± 1.27 5.2 ± 1.14 9.2 ± 2.41 Interaction 43.0 ± 0.93 31.8 ± 0.86 11.2 ± 1.79 Flexibility -28.6 ± 0.34 -26.6 ± 0.28 -2.0 ± 0.62
Table 1 Decomposition of the unbinding free energy of PVDI and PVDG173 from
FpvA, and associated uncertainties, as obtained (and using the notations from) the thermodynamic cycle on Fig. 2. All entries are in kcal mol-1.
The necessary summation of errors along the thermodynamical cycle accounts for total uncertainties of 1.1-1.3 kcal mol-1 for the computed binding free energies, which are quite comparable to typically reported ITC errors67 and do not put into question the meaningfulness of the binding free energy difference between PVDI and PVDG173.
However, it is possible that the method would not be able to discriminate between minute variations upon the same PVD scaffold, if the resulting FpvA binding free energies should fall within 2-2.5 kcal mol-1 of each other.
Strikingly, the decomposition of the binding free energies into their constituent terms shows that the higher affinity of FpvA for PVDI compared to PVDG173 is mainly due
to the less favorable interaction of the bound conformation of PVDI with water (a difference of 10 kcal mol-1); the interaction of PVDI with the FpvA binding site is
actually only 1 kcal mol-1 more favorable than the interaction of PVDG173, which falls
within the uncertainty range associated with this free energy difference. This is in agreement with the docking experiments we have performed on FpvA/PVDI and FpvA/ PVDG173, which predict near-equal binding free energies for both PVD
derivatives (10.9 kcal mol-1 for PVDI and 11.2 kcal mol-1 for PVDG173). In fact, we
have also performed docking calculations of other PVDs onto FpvA (see Table S1 in Supporting Information) and found docking scores to lie inside a 2 kcal mol-1 range in all cases, which cannot be claimed to be significant by the standards of the simplistic models used for the computation of docking scores. Since these scores take into account neither the flexibility of the ligand nor its interaction with water, they are comparable in nature to the alchemical decoupling simulations of PVDs from FpvA. Poisson-Boltzmann calculations on the bound conformations of both siderophores in implicit solvent also show more favorable electrostatic solvation energies for PVDG173
than for PVDI (152.4 kcal mol-1 vs. 140.2 kcal mol-1), supporting the results of our alchemical free energy simulations and the dominant role of interactions with water. The larger conformational freedom of PVDI in solution translates into a higher penalty for the restraining of the molecule in its bound conformation (a difference of 9 kcal mol-1), which is also consistent with the fact that the bound conformation of PVDI features a rather constrained ϕ backbone dihedral of 135° for serine 3 while the backbone geometry of the bound conformation of PVDG173 remains in well-populated
regions of the Ramachandran diagram that both unbound PVD structures also favor. Conversely, the flexibility of PVDI in the FpvA binding site is also higher than that of PVDG173, such that the contributions of flexibility to the binding free energies of
both PVDs differ by 2 kcal mol-1 only (a small, but statistically significant, difference compared to the 11 kcal mol-1 difference in interaction contributions). Even if it does not do much to discriminate between PVDI and PVDG173, the flexibility free energy
term is in both cases quite sizeable, counterbalancing the interaction term of which it represents up to 85% in absolute value.
Free energy profiles for FpvA/PVD dissociation
The double decoupling free energy calculations have proved able to reproduce the experimental binding free energy values and thresholds for the two PVDs under study. This is quite remarkable for such large ligands,31 even if there is a clear need for further validation on additional PVDs (providing the corresponding experimental binding free energies become available) before this good performance can unambiguously be confirmed. On the other hand, double decoupling simulations do not sample physically meaningful intermediate states; as such, they cannot provide information about the binding and unbinding pathway, the possible transition states thereupon, or the associated free energy barriers. To gain insight into these crucial aspects, we employed an enhanced sampling molecular dynamics method to simulate the controlled dissociation of the bound FpvA/PVD complexes, along a generalized minimal distance coordinate that reduces the bias imposed on the pathway (see Methods). The use of biasing forces is required to observe the dissociation of the complex on timescales amenable to simulation; however, the effect of the bias on the simulation can be removed a posteriori to recover the unbiased free energy profile along the dissociation coordinate. This can only be done rigorously if all variables orthogonal to the biased coordinate are equilibrated at every fixed value of the latter – yet this condition becomes increasingly difficult to meet for the rigid-body rotational and translational degrees of freedom of the ligand when the distance between partners increases. Hence, the controlled dissociation methodology is best suited to characterize intermediate states along the dissociation pathway and can rarely reach the completely dissociated state; as such, it had an appealing complementarity to the double decoupling scheme, which describes the endpoints of the complexation process but not the intermediates.
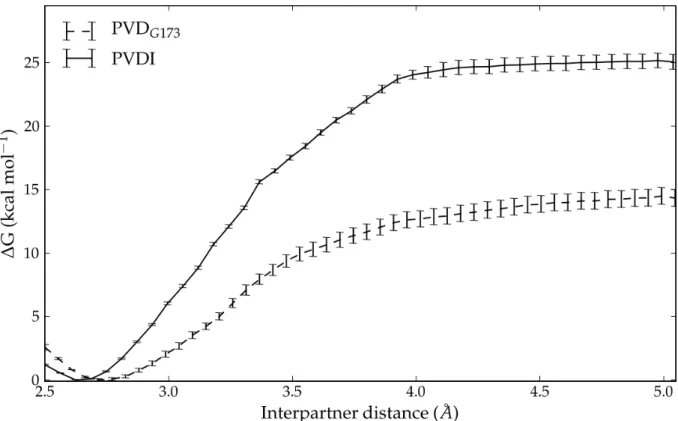
Fig. 3 Potential of mean force for the association and dissociation of PVDI
(continuous line) and PVDG173 (dashed line) from FpvA along the minimum
interpartner distance generalized coordinate (see text for details). Error bars correspond to twice the standard deviation in ΔG computed for the corresponding umbrella window (see Supporting Information for details on error estimates).
The free energy profiles for the dissociation of PVDI and PVDG173 from FpvA are
shown on Fig. 3. The complexes were separated until a plateau in the free energy profile was reached, which corresponds to the top of the dissociation barrier; up to this point, both the internal flexibility of the ligand and its rigid-body degrees of freedom remain contained and can be adequately sampled (see Supporting Information for justification). The profiles show a monotonous increase in free energy and plateau at values of 24.9 kcal mol-1 for PVDI and 14.3 kcal mol-1 for PVDG173.
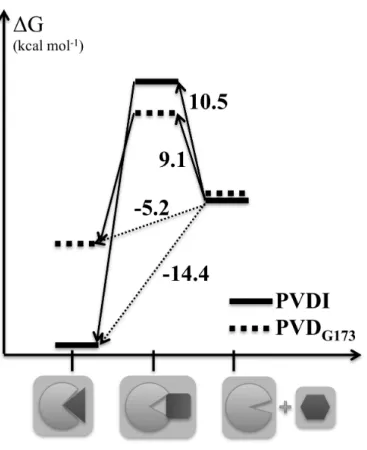
Supposing the existence of a single barrier between the bound and unbound states, and adopting the dissociated states of both complexes as the reference (i.e., zero-point) of binding free energies, the results of the double decoupling and controlled dissociation methods can be combined to obtain the schematic overall free energy landscapes depicted in Fig. 4. The barriers to complex formation (deduced from the
binding free energies and the barriers to dissociation) amount to 10.5 kcal mol-1 for PVDI and 9.1 kcal mol-1 for PVDG173: interestingly, despite FpvA’s much higher
affinity for PVDI, the kinetics of binding are in slight favor of the noncognate pyoverdine.
Fig. 4 Schematic representation of the free energy landscape associated with PVD
recognition and binding by FpvA. The free energy differences between the three states represented as cartoons along the abscissa (the bound state, left; the intermediate ‘recognition’ state, center; the dissociated state, right) are reported on the arrows connecting these states, for PVDI (full bars) and PVDG173 (dotted bars).
Structural analysis of the binding/unbinding pathways
To understand the structural and dynamical reasons behind this, we investigated the binding and unbinding pathways as revealed by the controlled dissociation simulations. First, we focused on the evolution of the structure and plasticity of both PVD ligands along the pathways. The structure of PVD at any moment in time can be positioned using its RMSD from the average bound and isolated conformations. For PVDI, these conformations are separated by a RMSD of 2.92 Å, compared to
2.21 Å for PVDG173. The smaller RMSD difference conceals the fact that free
PVDG173 features a labile, intramolecular hydrogen bond between serine 1 and
aspartate 5 that was found to exist 65% of the time in our simulations, but is not present in the bound conformation. PVDI, in comparison, does not feature such a dramatic change in intramolecular interactions; as previously mentioned, the main difference between unbound and bound states involves partial folding of the protein chain around serine 3: the corresponding ϕ backbone dihedral moves away from the well-populated range of left-handed helix geometries (65°) in the free state, toward a much more constrained value of 135° in the bound state.
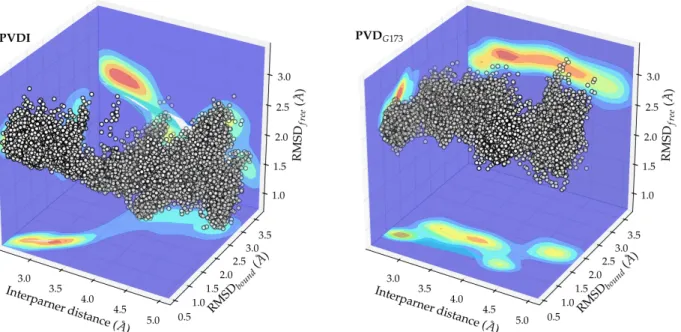
Fig. 5 Conformational space sampled by PVDI (left) and PVDG173 (right) along the
binding/unbinding pathway (interpartner distance, x axis), projected on the RMSD to the bound (y axis) and unbound (z axis) structures. The white dots represent individual conformations; the associated density of states is projected on each of the planes defined by the axes (dark blue – low density, to red – high density).
The density of states sampled during our simulations in the three-dimensional conformational subspace defined by the interpartner distance and the RMSD values to the bound and unbound structures is represented on Fig. 5 for PVDI and PVDG173. PVDI undergoes a clear-cut conformational transition, simultaneously
bound conformation as the interpartner distance grows, and gaining flexibility (as shown by the diffuseness of the RMSDfree values at large separation distances).
However, at a distance of around 3.4 Å the density of states becomes much more constricted, denoting a conformational bottleneck where the ligand is expected to adopt a precise conformation. This was found to involve the rigidification of the chromophore substituent chain (via Van des Waals interactions with Val229 of FpvA) and the arginine sidechain (via a hydrogen bond to Tyr600), the position of PVDI being locked by hydrogen bond interactions of both serine moieites to Tyr661 and Glu646 (see Fig. S6 of Supporting Information). On the unbinding free energy profile, this intermediate appears as a rather minute, but still quite visible, shoulder. PVDG173 behaves very differently: upon unbinding, it gains a much more limited
flexibility and does not come significantly closer structurally to the geometry observed in water. Remarkably, the RMSD to the bound state, which increases as soon as the unbinding process engages, dips again at 4.3 Å where some kind of preselection of the bound conformation seems to occur. Apart from this, there does not appear to be any conformational bottlenecks to the binding and unbinding processes.
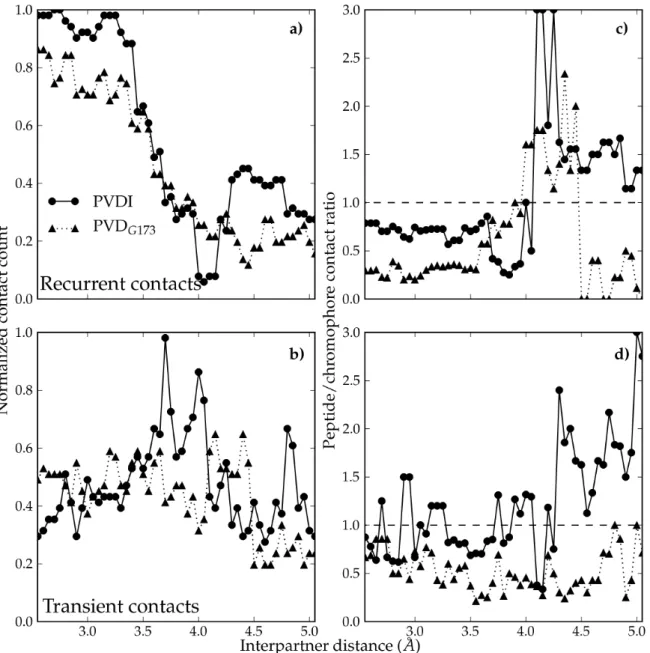
Fig. 6 Evolution of FpvA/PVD contacts along the binding pathway. Number of
recurrent (a) and transient (b) contacts, normalized to the largest number of contacts observed; ratio of the number of recurrent (c) and transient (d) contacts to FpvA made by the peptidic chain of PVD over the number of contacts made by the chromophore moiety. Data entries for PVDI (resp. PVDG173) are shown as circles on
a solid line (resp. triangles on a dotted line).
To complement this analysis, we monitored the evolution of the contacts between each of the two PVDs and FpvA along the unbinding pathway, which we classified into recurrent (occurring in 50% or more of frames at the corresponding interpartner distance) and transient (occurring in less than 50% of frames) (Fig. 6). The number
of recurrent contacts made by PVDI, stable until an interpartner distance of 3.4 Å, undergoes a sharp decrease from 3.4 to 4 Å (Fig. 6a), compensated by the increase of transient contacts in the same distance range (Fig. 6b). The number of recurrent contacts then increases again as the barrier region is reached. Such is not the case for PVDG173: the number of recurrent FpvA/PVDG173 contacts decreases much more
gradually from the onset of the process until around 4.4 Å, does not increase again in the barrier region, and is not compensated by a significant rise in transient contacts. The superior number of overall contacts (recurrent and transient) in PVDI compared to PVDG173, as well as the progressive rupture of permanent contacts in PVDG173 as
opposed to the simultaneous, concerted breaking of interactions in PVDI, explains the higher barrier to unbinding observed for the latter. The contact map analysis also confirms the pivotal role of the 3.4 Å intermediate for PVDI: it is the last state on the unbinding pathway to retain all important ligand/receptor interactions found in the bound complex. At lower separation distances, PVDI is able to deform without durably breaking any of these contacts.
We now divide the ligand/receptor contact map into the contacts made by the chromophore moiety (common to PVDI and PVDG173, as to most PVDs) and those
made by the variable peptide chain, and investigate the relative importance of both classes along the PVD unbinding pathways. As already shown experimentally, 21 in the bound conformation of both siderophores, recurrent contacts are primarily made by the chromophore (Fig. 6c) – especially in the case of PVDG173. Conversely, the
barrier area (4.1 Å and beyond) mostly features peptide-mediated contacts for PVDI, while chromophore-mediated contacts continue to dominate PVDG173 recognition. A
similar trend appears for transient contacts (Fig. 6d): the transient interface between FpvA and PVDG173 mostly involves the chromophore at all interpartner distances,
whereas for PVDI the contributions of chromophore and polypeptide chain are more balanced, with the latter becoming dominant at large separation distances. The crossover point for the dominance of chromophore-mediated vs. peptide-mediated
contacts for PVDI is located at 4.0-4.1 Å, which corresponds to the point at which the unbinding free energy profile suddenly plateaus. The fact that no such transition is observed for PVDG173 is consistent with the much more progressive plateauing of
the corresponding potential of mean force. For further information on the unbinding mechanisms of both PVDs from FpvA, the reader is referred to Figs. S4 and S5 in Supporting Information, where detailed interpartner distance-dependent contact maps are provided.
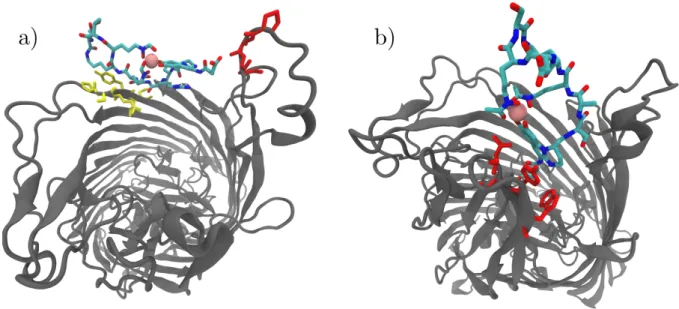
The structures of the barrier intermediate are strikingly different for FpvA/PVDI and FpvA/PVDG173 (Fig. 7). PVDI simultaneously contacts two of the three flexible
loop regions forming the lid of the FpvA pore: hydrogen bonds involving PVDI-specific aminoacids Arg2 and Thr7 (and to a lesser degree, Ser3 and Lys5) are made with residues 518-521 of the FpvA lid, in a way reminiscent of beta sheets; simultaneously, the unspecific chromophore substituent chain makes a hydrogen bonds to the backbone of FpvA lid aminoacids 657-659. PVDI spans the FpvA pore, with its long axis orthogonal to the pore axis. By contrast, in the barrier conformation, PVDG173 contacts FpvA via the much less flexible beta-sheet-turn
motif centered around residue 750 of its lid region, and is aligned parallel to the pore axis with the chromophore residue facing toward the periplasm (an alignment that is very close to that of the bound conformation). Hydrogen-bond contacts are created between the chromophore substituent chain and Thr797, while a π-type hydrogen bond links the chromophore ring system to Asn747. Interestingly, the intramolecular hydrogen bond between Ser1 and Asp5 seen in the free state of PVDG173 does not
exist in this barrier conformation, in good agreement with the previous observation that the RMSD of the siderophore to its unbound state does not notably decrease during the simulated dissociation process.
Fig. 7 Cartoon representation of the transition state structures of FpvA (grey
cartoons, as seen from the outside of the bacterium) bound to a) PVDI and b) PVDG173 (per-atom-type colored sticks/pink sphere for Fe3+). Residues on the FpvA
pore lid involved in the recognition of PVDs are represented as sticks: a) red: residues 657-659; yellow: 518-523; b) red: 745, 747, 752.
Dynamical analysis of the binding/unbinding pathways
Finally, we analyze the correlated deformation of the siderophores and the pore lid as the binding proceeds. The radius of gyration was employed as the measure of siderophore shape. As can be seen on the inset of Fig. 8, the radius of gyration of PVDI diminishes notably during binding, which is due to the partial folding of the peptide chain around Ser3; but the shape of PVDG173 is much less affected. We now
compute the mutual information contained in the radius of gyration on the one hand, and the geometry of the pore lid on the other. We quantify the latter as the area of the triangle formed between the backbone centers of mass of the three pore lid regions where recognition was seen to occur in the barrier intermediate states described above (residues 491-492/518-521, 657-661 and 745-752). For both PVDs, the mutual information is highly variable along the binding/unbinding pathway. Despite this, four interpartner distance ranges in which the deformations of PVDI and the FpvA pore vestibule are highly correlated can be identified (centered around d=3.3, 3.8, 4.2 and 4.8 Å); they can be linked to already mentioned stages in the
binding mechanism: PVD recognition by FpvA lid loops at d=4.8 Å, switch from peptide chain recognition to chromophore recognition at d=4.2 Å, conformational bottleneck maximizing PVD-FpvA contacts at d=3.4 Å… For PVDG173, the case is
much less clear-cut and dynamic correlations between PVD and pore vestibule shapes remain marginal. In addition to whether contacts to FpvA involve specific or generic portions of the siderophores, the difference between the specific and nonspecific binding mechanism can clearly be seen in the involvement (or lack thereof) of the flexible pore lid in the binding mechanism.
Fig. 8 Mutual information (MI) between the radius of gyration of PVD (shown as
inset) and the area of the FpvA pore vestibule (see text for details), as a function of interpartner distance (black: PVDI, grey: PVDG173). The area between the PVDI
and PVDG173 MI curves is colored depending on the relative position of both curves
(hatches on white background: MI is higher for PVDI; dots on grey background: MI is higher for PVDG173).
Discussion
We now sum up the insights harvested from the simulations and analyses performed and apply them to the formulation of guidelines for the design of high-affinity PVD analogues.
Our calculations indicate that the interaction of the PVDs with water is more important for the thermodynamic discrimination of binding candidates than the actual interaction with the FpvA binding pocket, which mostly involves nonspecific contacts. This assumption is consistent with the experimental analysis of the binding site interactions in the bound conformations: despite observing differences in interactions between high- and low-affinity pyoverdines, most notably at the interface between the first three aminoacids on the PVD chain and Trp599/Tyr600 on the FpvA L7 loop, Greenwald and coworkers acknowledge the fact that the overall binding affinity probably has as many influences as the numerous contacts between partners.17 It is also in line with Schons and coworkers’ assumption that the PVD peptide chain plays a more important role in the uptake of iron than in the recognition by FpvA.21 Finally, it is consistent with the homogeneity of molecular docking scores among PVDs. In addition, our simulations show that even the low-affinity PVDG173 forms long-lasting contacts with the L7 loop of FpvA as early in the
binding process as the high-affinity PVDI (from distances of 4.2 Å); albeit weaker in PVDG173 than in PVDI (long-range electrostatic interactions with the hydroxamate
moiety and hydrophobic interactions with the chromophore vs. strong electrostatic interactions with Arg2), these contacts help to equalize the FpvA/PVD interaction energy. Consequently, achieving high binding free energies can best be pursued by minimizing the stability of the bound conformation of PVD in water. In PVDG173,
the negatively charged Asp5 residue, which is not locked in a hydrogen bond in the bound conformation, is directly accessible to the solvent, while in PVDI the corresponding charged headgroup is the positive Arg2. Due to the offset between the
water molecule’s steric and dipole moment centers, it is well known that molecules with negative head charges are preferentially solvated over solutes with positive head charges,68 explaining the more favorable interaction of PVDG173 with water. The cost
of reaching the bound conformation of PVD from the unbound one is also a factor disfavoring the thermodynamics of binding: it can be enthalpic (such as the necessity to break a favorable intramolecular hydrogen bond in PVDG173), entropic (such as
the superior flexibility of PVDI limiting the statistical weight of the bound state), or a combination of both. A good PVD candidate should not be too flexible, nor feature self-interactions favoring the unbound state; it should contain positively charged groups rather than negatively charged ones. Among the noncognate pyoverdines whose affinity have been experimentally determined from binding assay experiments,17 this trend seems verified: PVDDSM50106, PVDATCC13525 and PVDPfl18.1
all feature lysine-rich peptide chains whose partly cyclic nature limit conformational freedom; on the other hand, weak or non-binding PVDs are either noncyclic (PVDPa6,
PVDATCC27853) and/or feature positively charged aspartate (PVDG173) or
diaminobutyrate (PVDPa6) moieties.
As important as the difference in free energy between the endpoints of the binding process is the height of the barrier that separates them, which was found to be sizeable in the two cases studied herein (around 10 kcal mol-1). The binding thermodynamics of a successful FpvA inhibitor should not be hampered by unfavorable kinetics; hence, optimizing the transition state structure is a necessary step in the conception of PVD analogues. Our study of the binding mechanisms of PVDI indicates that a combination of a sufficiently long peptide chain and the presence of hydrogen-bond donors both next to the chromophore and on the cyclic, C-terminal end of the peptide chain allows the siderophore to simultaneously contact opposite edges of the pore lid with no major deviation from its average unbound structure, stabilizing the barrier intermediate. This requires synchronicity between the movements of PVD and the pore lid and carries an entropic cost, which can
supposedly be minimized by PVD chains of specific sequences. Once this has been achieved, the rest of the binding process is facilitated by a concerted mechanism in which FpvA/PVD contacts that break are replaced by new ones, maintaining a near-constant number of favorable interactions and guiding the siderophore toward its binding site. These interactions help compensate for the cost of partially folding the peptide chain around residue 3, which is the largest structural transition between the bound and unbound states of PVDI but also other strongly binding PVDs (PVDDSM50106, PVDATCC13525). Conversely, the formation of the FpvA/PVDG173
barrier intermediate does not require correlation in the motions of the partners; however, PVDG173 forms fewer stabilizing contacts with the pore lid (nonspecific
chromophore-mediated interactions) and is conformationally remote from both its bound and unbound structures. Furthermore, the absence of correlated motion renders the rest of the binding process less favorable, with a much more gradual buildup of favorable interactions than in PVDI. The sequence requirements favoring the binding kinetics can thus be summarized as follows: a hydrogen bonding side chain at position 2, a small residue at position 3 to favor folding, and one or more hydrogen bond donor residues in the C-terminal domain. The first two points had been suggested previously based on the analysis of PVD sequences2,17; the present study provides the structural reasons for them. The last point has, to date, never been mentioned; based on the high variability of its sequence and its lack of contacts with FpvA in the bound state, Greenwald and coworkers have labeled the C-terminal part of the PVD chain as probably irrelevant to FpvA recognition and binding. From the binding and unbinding mechanisms revealed by our study, we can say with some confidence that the C-terminal part does play a role in the intermediate stages of recognition; however, the relevance of such kinetics aspects compared to thermodynamics has yet to be investigated. Additionally, the length of the peptide chain appears as important in forming stable recognition intermediates as the availability of hydrogen-bonding groups in the C-terminal region. On this aspect, the
kinetics and thermodynamics requirements diverge, the former favoring long chains while the latter favors short ones; cyclic side chains in PVD might have evolved as a way to accommodate both requirements simultaneously, by limiting conformational freedom while preserving chain lengths.
To further verify and generalize the criteria that a successful PVD analogue should possess, it will be necessary to study many more variations upon the PVD framework than the two species studied herein, which would imply tremendous computational costs with the all-atom free-energy methods employed herein. We are currently working on a coarse-grained approach to this problem. We hope that this work will spark the incentive for experimental binding assays and FRET studies69 on additional PVDs, providing further input and/or validation for the conception of a model of siderophore recogntion by the FpvA transporter.
Acknowledgements
The authors gratefully acknowledge financial support from Région Picardie (grant reference SIDERBACT – Projets Régionaux Structurants 2011). The calculations presented in this work were performed using HPC resources from the GENCI-IDRIS national supercomputer center (grant 2014-i2014077328) and the MeCS computing platform of Université de Picardie Jules Verne.
References
1 V. Gasser, L. Guillon, O. Cunrath and I. J. Schalk, J. Inorg. Biochem., 2015, http://dx.doi.org/10.1016/j.jinorgbio.2015.01.017.
2 E. Yeterian, L. W. Martin, L. Guillon, L. Journet, I. L. Lamont and I. J. Schalk, Amino Acids, 2010, 38, 1447.
3 M. Hannauer, E. Yeterian, L. W. Martin, I. L. Lamont and I. J. Schalk, FEBS Lett., 2010, 584, 4751.
4 B. Ghysels, B. T. Dieu, S. A. Beatson, J. P. Pirnay, U. A. Ochsner, M. L. Vasil and P. Cornelis, Microbiology, 2004, 150, 1671.
5 K. Poole, D. E. Heinrichs and S. Neshat, Mol. Microbiol., 1993, 10, 529.
6 M. Nader, L. Journet, A. Meksem, L. Guillon and I. J. Schalk, Biochemistry, 2011,
50, 2530.
7 I. J. Schalk, G. L. Mislin and K. Brillet, Curr. Top. Membr., 2012, 69, 37.
8 J. Greenwald, F. Hoegy, M. Nader, L. Journet, G. L. Mislin, P. L. Graumann and I. J. Schalk, J. Biol. Chem., 2007, 282, 2987.
9 I. J. Schalk, M. A. Abdallah and F. Pattus, Biochemistry, 2002, 41, 1663.
10 E. Yeterian, L. W. Martin, I. L. Lamont and I. J. Schalk, Environ. Microbiol. Rep., 2010, 2, 412.
11 M. A. Llamas, F. Imperi, P. Visca and I. L. Lamont, FEMS. Microbiol. Rev., 2014, 38, 569.
12 K. Yin, W. Zhang and L. Chen, Biosens. Bioelectron., 2014, 51, 90.
13 M. Trautmann, P. M. Lepper and M. Haller, Am. J. Infect. Control, 2005, 33,
S41.
14 B. Dhooghe, S. Noël, F. Huaux and T. Leal, Clin. Biochem., 2014, 47, 539.
15 D. Savoia, Future Microbiol., 2014, 9, 917.
16 E. Morales, F. Cots, M. Sala, M. Comas, F. Belvis, M. Riu, M. Salvadó, S. Grau, J. P. Horcajada, M. M. Montero and X. Castells, BMC Health Serv. Res., 2012, 12,
122.
17 J. Greenwald, M. Nader, H. Celia, C. Gruffaz, V. Geoffroy, J. M. Meyer, I. J. Schalk and F. Pattus, Mol. Microbiol., 2009, 72, 1246.
18 S. L. Hartney, S. Mazurier, M. K. Girard, S. Mehnaz, E. W. Davis, H. Gross, P. Lemanceau and J. E. Loper, J. Bacteriol., 2013, 195, 765.
19 H. Budzikiewicz, Curr. Top. Med. Chem., 2001, 1, 73.
20 S. Noël, V. Gasser, B. Pesset, F. Hoegy, D. Rognan, I. J. Schalk and G. L. Mislin, Org. Biomol. Chem., 2011, 9, 8288.
21 V. Schons, R. A. Atkinson, C. Dugave, R. Graff, G. L. Mislin, L. Rochet, C. Hennard, B. Kieffer, M. A. Abdallah and I. J. Schalk, Biochemistry, 2005, 44, 14069.
22 A. S. Griffin, S. A. West and A. Buckling, Nature, 2004, 430, 1024.
23 C. Cézard, N. Farvacques and P. Sonnet, Curr. Med. Chem., 2015, 22, 165.
24 I. J. Schalk and L. Guillon, Environ. Microbiol., 2013, 15, 1661.
25 C. Wirth, W. Meyer-Klaucke, F. Pattus and D. Cobessi, J. Mol. Biol., 2007, 368,
398.
26 H. Adams, G. Zeder-Lutz, I. Schalk, F. Pattus and H. Celia, J. Bacteriol., 2006,
27 Y. Deng and B. Roux, J. Phys. Chem. B, 2009, 113, 2234.
28 B. L. Tembre and J. A. Mc Cammon, Comp. Chem. (Oxford), 1984, 8, 281.
29 S. Boresch, F. Tettinger, M. Leitgeb and M. Karplus, J. Phys. Chem. B, 2003,
107, 9535.
30 D. L. Mobley, J. D. Chodera and K. A. Dill, J. Chem. Theory. Comput., 2007, 3,
1231.
31 J. C. Gumbart, B. Roux and C. Chipot, J. Chem. Theory. Comput., 2013, 9, 794.
32 J. C. Gumbart, B. Roux and C. Chipot, J. Chem. Theory. Comput., 2013, 9,
3789.
33 C. H. Bennett, J. Comput. Phys., 1976, 22, 245.
34 P. Liu, F. O. Dehez, W. Cai and C. Chipot, J. Chem. Theory. Comput., 2012, 8,
2606.
35 D. Frenkel and B. Smit, ‘Understanding Molecular Simulation – from Algorithms to Applications’, Academic Press: Waltham, MA, USA; 2002.
36 T. P. Straatsma and J. A. McCammon, J. Chem. Phys., 1991, 95, 1175.
37 A. Pohorille, C. Jarzynski and C. Chipot, J. Phys. Chem. B, 2010, 114, 10235.
38 M. Wilhelm, A. Mukherjee, B. Bouvier, K. Zakrzewska, J. T. Hynes and R. Lavery, J. Am. Chem. Soc., 2012, 134, 8588.
39 B. Bouvier and R. Lavery, J. Am. Chem. Soc., 2009, 131, 9864.
40 J. C. Phillips, R. Braun, W. Wang, J. Gumbart, E. Tajkhorshid, E. Villa, C. Chipot, R. D. Skeel, L. Kalé and K. Schulten, J. Comput. Chem., 2005, 26, 1781.
41 S. Kumar, J. M. Rosenberg, D. Bouzida, R. H. Swendsen and P. A. Kollman, J. Comput. Chem., 1992, 13, 1011.
42 V. Hornak, R. Abel, A. Okur, B. Strockbine, A. Roitberg and C. Simmerling, Proteins, 2006, 65, 712.
43 J. Wang, R. M. Wolf, J. W. Caldwell, P. A. Kollman and D. A. Case, J. Comput. Chem., 2004, 25, 1157.
44 F. Y. Dupradeau, A. Pigache, T. Zaffran, C. Savineau, R. Lelong, N. Grivel, D. Lelong, W. Rosanski and P. Cieplak, Phys. Chem. Chem. Phys., 2010, 12, 7821.
45 E. Vanquelef, S. Simon, G. Marquant, E. Garcia, G. Klimerak, J. C. Delepine, P. Cieplak and F. Y. Dupradeau, Nucleic Acids Res., 2011, 39, W511.
46 A. Giammona, PhD thesis, University of California Davis, 1984.
47 W. L. Jorgensen, J. Chandrasekhar, J. D. Madura, R. W. Impey and M. L. Klein, J. Chem. Phys., 1983, 79, 926.
49 A. T. Brünger, ‘X-PLOR: A System for X-ray crystallography and NMR’, Yale University Press: New Haven, CT, USA; 1993.
50 G. J. Martyna, D. J. Tobias and M. L. Klein, J. Chem. Phys., 1994, 101, 4177.
51 T. Darden, D. York and L. Pedersen, J. Chem. Phys., 1993, 98, 10089.
52 O. Trott and A. J. Olson, J. Comput. Chem., 2010, 31, 455.
53 D. Seeliger and B. L. de Groot, J. Comput. Aided Mol. Des., 2010, 24, 417.
54 G. M. Morris, R. Huey, W. Lindstrom, M. F. Sanner, R. K. Belew, D. S. Goodsell and A. J. Olson, J. Comput. Chem., 2009, 30, 2785.
55 N. A. Baker, D. Sept, S. Joseph, M. J. Holst and J. A. McCammon, Proc. Natl. Acad. Sci. U.S.A., 2001, 98, 10037.
56 B. Bouvier, R. Grünberg, M. Nilges and F. Cazals, Proteins, 2009, 76, 677.
57 F. Pedregosa, G. Varoquaux, A. Gramfort, V. Michel, B. Thirion, O. Grisel, M. Blondel, P. Prettenhofer, R. Weiss and V. Dubourg, J. Mach. Learn. Res., 2011, 12,
2825.
58 W. Humphrey, A. Dalke and K. Schulten, J. Mol. Graphics Modell., 1996, 14, 33.
59 J. D. Hunter, Comp. Sci. Eng., 2007, 9, 90.
60 K. N. Kirschner, R. D. Lins, A. Maass and T. A. Soares, J. Chem. Theory Comput., 2012, 8, 4719.
61 T. J. Piggot, D. A. Holdbrook and S. Khalid, Biochim. Biophys. Acta Biomemb., 2013, 1828, 284.
62 T. Abraham, S. R. Schooling, M. P. Nieh, N. Kucerka, T. J. Beveridge and J. Katsaras, J. Phys. Chem. B, 2007, 111, 2477.
63 J. D. Faraldo-Gómez, G. R. Smith and M. S. Sansom, Biophys. J., 2003, 85, 1406.
64 J. Parkin and S. Khalid, Biophys. J., 2014, 107, 1853.
65 T. J. Piggot, D. A. Holdbrook and S. Khalid, J. Phys. Chem. B, 2011, 115, 13381.
66 R. J. Woods, R. A. Dwek, C. J. Edge and B. Fraser-Reid, J. Phys. Chem., 1995,
99, 3832.
67 J. D. Chodera and D. L. Mobley, Annu. Rev. Biophys., 2013, 42, 121.
68 D. L. Mobley, J. R. Baker, A. E. Barber, C. J. Fennell and K. A. Dill, J. Phys. Chem. B, 2008, 112, 2405.
69 I. J. Schalk, C. Hennard, C. Dugave, K. Poole, M. A. Abdallah and F. Pattus, Mol. Microbiol., 2001, 39, 351.