HAL Id: hal-00303936
https://hal.archives-ouvertes.fr/hal-00303936
Submitted on 3 Jul 2006HAL is a multi-disciplinary open access
archive for the deposit and dissemination of sci-entific research documents, whether they are pub-lished or not. The documents may come from teaching and research institutions in France or abroad, or from public or private research centers.
L’archive ouverte pluridisciplinaire HAL, est destinée au dépôt et à la diffusion de documents scientifiques de niveau recherche, publiés ou non, émanant des établissements d’enseignement et de recherche français ou étrangers, des laboratoires publics ou privés.
Analysis of non-regulated vehicular emissions by
extractive FTIR spectrometry: tests on a hybrid car in
Mexico City
F. Reyes, M. Grutter, A. Jazcilevich, R. González-Oropeza
To cite this version:
F. Reyes, M. Grutter, A. Jazcilevich, R. González-Oropeza. Analysis of non-regulated vehicular emissions by extractive FTIR spectrometry: tests on a hybrid car in Mexico City. Atmospheric Chemistry and Physics Discussions, European Geosciences Union, 2006, 6 (4), pp.5773-5796. �hal-00303936�
ACPD
6, 5773–5796, 2006 Vehicular emissions by extractive FTIR spectroscopy F. Reyes et al. Title Page Abstract Introduction Conclusions References Tables Figures J I J I Back Close Full Screen / EscPrinter-friendly Version Interactive Discussion Atmos. Chem. Phys. Discuss., 6, 5773–5796, 2006
www.atmos-chem-phys-discuss.net/6/5773/2006/ © Author(s) 2006. This work is licensed
under a Creative Commons License.
Atmospheric Chemistry and Physics Discussions
Analysis of non-regulated vehicular
emissions by extractive FTIR
spectrometry: tests on a hybrid car in
Mexico City
F. Reyes1, M. Grutter1, A. Jazcilevich1, and R. Gonz ´alez-Oropeza2
1
Centro de Ciencias de la Atm ´osfera, Universidad Nacional Aut ´onoma de M ´exico, 04510 M ´exico D.F., Mexico
2
Facultad de Ingenier´ıa, Universidad Nacional Aut´onoma de M´exico, 04510 M´exico D.F., Mexico
Received: 2 May 2006 – Accepted: 26 May 2006 – Published: 3 July 2006 Correspondence to: M. Grutter (grutter@servidor.unam.mx)
ACPD
6, 5773–5796, 2006 Vehicular emissions by extractive FTIR spectroscopy F. Reyes et al. Title Page Abstract Introduction Conclusions References Tables Figures J I J I Back Close Full Screen / EscPrinter-friendly Version Interactive Discussion
Abstract
A methodology to acquire valuable information on the chemical composition and evo-lution of vehicular emissions is presented. The analysis of the gases is performed by passing a constant flow of a sample gas from the tail-pipe into a 10 L multi-pass cell. The absorption spectra within the cell are obtained using an FTIR spectrometer
5
at 0.5 cm−1 resolution along a 13.1 m optical path. Additionally, the total flow from the exhaust is continuously measured from a differential pressure sensor on a Pitot tube installed at the exit of the exhaust. This configuration aims to obtain a good speciation capability by coadding spectra during 30 s and reporting the emission (in g/km) of key and non-regulated pollutants, such as CO2, CO, NO, SO2, NH3, HCHO, NMHC,
dur-10
ing predetermined driving routines. The advantages and disadvantages of increasing the acquisition frequency, as well as the effect of other parameters such as spectral resolution, cell volume and flow rate, are discussed. With the aim of testing and evalu-ating the proposed technique, experiments were performed on a dynamometer running FTP-75 and typical driving cycles of the Mexico City Metropolitan Area (MCMA) on a
15
Toyota Prius hybrid vehicle. This car is an example of recent automotive technology to reach the market dedicated to reduce emissions and therefore pressing the need of low detection techniques. This study shows the potential of the proposed technique to measure and report in real time the emissions of a large variety of pollutants, even from a super ultra-low emission vehicle (SULEV). The emissions of HC’s, NOx, CO
20
and CO2 obtained here are similar to experiments performed in other locations with the same vehicle model. Some differences suggest that an inefficient combustion pro-cess and type of gasoline used in the MCMA may be partly responsible for lower CO2 and higher CO and NO emission factors. Also, a fast reduction of NO emission to very low values is observed after cold ignition, giving rise to moderate N2O and eventually
25
NH3 emissions. The proposed technique provides a tool for future studies comparing in detail the emissions of different technologies using alternative fuels and emission control systems.
ACPD
6, 5773–5796, 2006 Vehicular emissions by extractive FTIR spectroscopy F. Reyes et al. Title Page Abstract Introduction Conclusions References Tables Figures J I J I Back Close Full Screen / EscPrinter-friendly Version Interactive Discussion
1 Introduction
Automotive emissions are a major component in the formation of photochemical smog in many modern cities. For example in the Mexico City Metropolitan Area (MCMA), over 99% of carbon monoxide (CO), 83% of nitrogen oxides (NOx), 20% of ammonia (NH3) and 38% of volatile organic hydrocarbons (VOC) that are emitted to the atmosphere
5
originate from mobile sources according to the local emissions inventory (GDF, 2002). The substantial progress in automotive technology such as catalytic converters, fuel injection systems and improved gasoline formulations has allowed for a considerable reduction of emissions per car, but has considerably been offset by the rapid increase in car population and use.
10
One relatively recent innovation in car technology to enter the market is the gas-electric hybrid car. It has become a realistic way of further reducing gasoline con-sumption and lowering pollutant emissions in a considerable manner. Hybrid cars do not loose the autonomy of conventional vehicles since they are powered by an inter-nal combustion engine (IC) using regular gasoline and an alternating electrical
syn-15
chronous motor that provide torque either in parallel or in series. A battery pack is recharged by the IC when needed but also during deceleration or breaking while the electric motor acts as a generator. It has been shown in comprehensive studies (NREL, 2001; EPA, 1998) on hybrid systems of TOYOTA and HONDA, that these technologies can achieve notably high efficiencies and ultra-low emissions. The Honda Insight
cer-20
tification test data show that this vehicle had emissions that were well below the ul-tra low emission vehicle (ULEV) standard projected out to 100 000 miles. In fact, the CO, NOx and NMHC emissions were 66, 77 and 31% lower than the ULEV standards (NREL, 2001). Only the CO emissions were below the super ultra-low emission vehi-cles (SULEV) standard. The Toyota Prius certification test data show that this vehicle
25
had emissions that were well below the SULEV emissions standards projected out to 100 000 miles. EPA estimates a highest rated fuel economy of 66 mpg on the highway and 61 mpg in the city for the manual transmission Honda Insight and 51 mpg on the
ACPD
6, 5773–5796, 2006 Vehicular emissions by extractive FTIR spectroscopy F. Reyes et al. Title Page Abstract Introduction Conclusions References Tables Figures J I J I Back Close Full Screen / EscPrinter-friendly Version Interactive Discussion highway and 60 mpg in the city for the automatic Toyota Prius (EPA, 2005).
Advances like the gas-electric hybrid system to power automobiles and the growing concern for the protection of the environment have been forcing vehicle exhaust emis-sions to be reduced to an extremely low level with maximum achievable fuel economy. Such a decrease in pollutant concentrations is a challenge for measuring systems and
5
requires improvements in the analytical techniques as a whole, including the gas an-alyzers and the sample handling systems (Adachi, 2000). Gaseous emissions such as ammonia (NH3), N2O, aldehydes, aromatics, alcohols and other toxic and reactive compounds are receiving increased attention for their impact on human health and their potential in the formation of photochemical smog including secondary aerosols. New
10
experimental methods to continuously monitor these pollutants are being developed. The instrumental methods used to analyze these compounds are often expensive, im-precise, and require frequent and complex calibration procedures.
FTIR (Fourier Transform Infrared) spectroscopy is now considered a valuable and useful tool for emission analysis of vehicles due to its multicomponent analysis
capa-15
bility, sensitivity and time resolution (Adachi, 2000; Durbin, 2002). It is especially well suited for monitoring non-regulated pollutants when testing alternative fuels and newer emission-control technologies. The FTIR technique is a well established methodology which has been validated by several regulatory and standardization agencies for ex-tractive gas-sampling analysis (EPA, 1998a; NIOSH, 2000; VDI, 2000; ASTM, 2002;
20
CARB, 2004). It is known as a reliable, self-validating and powerful method, capable of monitoring several gaseous pollutants simultaneously.
As opposed to the widely used constant volume sampler (CVS), the FTIR technique does not require dilution, which in the case of ULEV or the SULEV becomes a prob-lem since the concentrations of pollutants are more difficult to detect and monitor with
25
sufficiently high-response times. The CVS systems may run into the problem that the concentrations from the low emission vehicles may be similar to the ambient air used for the dilution, affecting the analysis through interferences and unwanted chemical re-actions, as is the case for some hydrocarbons and nitrogen oxides. FTIR can measure
ACPD
6, 5773–5796, 2006 Vehicular emissions by extractive FTIR spectroscopy F. Reyes et al. Title Page Abstract Introduction Conclusions References Tables Figures J I J I Back Close Full Screen / EscPrinter-friendly Version Interactive Discussion the raw exhaust directly. Many highly reactive species in the exhaust can be measured
by FTIR even below the part-per-million levels, replacing several discrete analyzers which may require complicated calibration procedures.
The objective of this study was to develop a methodology to measure in real time detailed emissions of vehicular exhausts based on FTIR spectroscopy. A particular
in-5
terest was placed on evaluating emissions of regulated and non-regulated gases such as NH3, N2O, NO, CH4, hydrocarbons (C2H2, C2H4, C2H6), formaldehyde (H2CO) and methanol (CH3OH) as part of an ongoing project to improve the emission inventories used in air quality models.
2 Experimental section
10
The experiments were preformed using a Toyota 2002 Prius Hybrid System on a dy-namometer facility located at the Department of Engineering (UNAM), running typical driving cycles of the MCMA. Emission factors of the observed gases are obtained by using the FTIR spectroscopic measurements in conjunction with exhaust flow determi-nation from a Pitot tube installed at the tail-pipe.
15
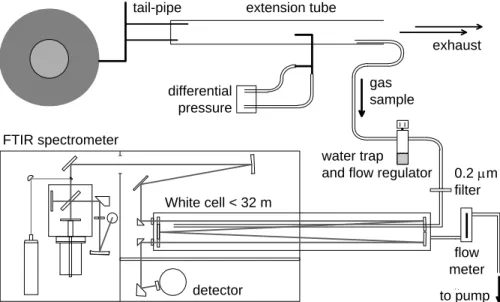
The general set-up used for vehicle exhaust analysis is depicted in Fig. 1. It consists of a test vehicle on a chassis dynamometer, a mass flow measurement system at the tail-pipe, a sample extraction line, a gas cell and an FTIR spectrometer. The gas sample is drawn from a stainless steel extension tube by a probe connected to an unheated Teflon hose (length: 2.3 m, ID: 3/16 in), which is pumped at a constant flow
20
of 26 liters min−1. Before entering the 10 liter gas cell, which was heated to 185◦C and held at a constant pressure of 400 mbar, the sample gas passes through a water trap and a 0.2 µm porous particle filter. The lag time between the tail-pipe and analytical region is 3 s.
ACPD
6, 5773–5796, 2006 Vehicular emissions by extractive FTIR spectroscopy F. Reyes et al. Title Page Abstract Introduction Conclusions References Tables Figures J I J I Back Close Full Screen / EscPrinter-friendly Version Interactive Discussion 2.1 On-line measurements of non regulated gases
The FTIR spectrometer used for the analysis is the same instrument deployed pre-viously for the measurement of ambient air in the MCMA both in the extractive con-figuration (Grutter, 2003a) and along a 426 m open-path (Grutter, 2003b). The inter-ferometer is a Nicolet® Nexus with a maximum unapodized resolution of 0.125 cm−1,
5
which is equipped with a ZnSe beamsplitter and a N2(l) cooled MCT detector. The op-erating spectral range is 700 to 4000 cm−1. The concentrations are retreived from the measured spectra with a non-linear least-squares algorithm. Reference spectra are synthetically generated from the HITRAN spectral database when available (Rothman, 2005), or from infrared libraries. In order to avoid interferences from ambient levels, a
10
spectrum before and after the experiment from ventilated laboratory air was taken and used as background.
A detailed discussion of the optimal parameters used for the analysis of exhaust gases from vehicles by FTIR spectroscopy has been reviewed elsewhere (Adachi, 2000; Larry, 1986). Basically, the main factors to be considered are spectral
reso-15
lution, scanning velocity, optical path length, cell volume and sampling flow-rate. The first three factors define the sensitivity of the measurement while the response time will be determined by the latter two. At lower spectral resolutions (≥1 cm−1), higher signal-to-noise leads to lower detection limits and higher response times, whereas selectivity will greatly be affected by interferences of other absorbing species. For this
applica-20
tion, the spectral resolution, mirror velocity and integrating time were set at 0.5 cm−1, 1.9 m/s and 25 s, respectively. The optical-path within the closed “White” cell was set at 13.1 m, corresponding to 16 passes, to avoid too large absorptions of certain gases. These parameters were chosen since rather than a fast response, the intention was to obtain good sensitivity and speciation capability. With the given cell volume and
25
sample flow rate, the sample renewal time within the cell was approximately ∼20 s. Experiments with higher response times (5 s) were also performed at lower spectral resolutions (1.0 cm−1) but are not included in the present contribution.
ACPD
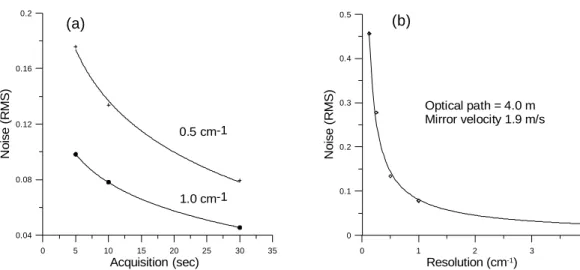
6, 5773–5796, 2006 Vehicular emissions by extractive FTIR spectroscopy F. Reyes et al. Title Page Abstract Introduction Conclusions References Tables Figures J I J I Back Close Full Screen / EscPrinter-friendly Version Interactive Discussion In Fig. 2a, one can observe the dependence of the relative spectral noise, calculated
as the root-mean-square (RMS) in the 2400–2500 cm−1 spectral window, with acqui-sition time for two different spectral resolutions. The spectral noise can be related to the sensitivity since the concentrations of the gases are retrieved from the measured spectra by a non-linear least-squares algorithm. Similarly, the noise is plotted against
5
the spectral resolution in Fig. 2b, where a fast decrease in sensitivity is observed for the higher spectral resolutions. In our case, the 0.5 cm−1 spectral resolution was chosen for the analysis.
2.2 Flow measurements
The mass flow rate was measured directly at the exhaust stream, although it is also
10
possible to determine it from the intake flow (prior to any compressor) or after the compressor prior to the engine. The exhaust stream is the most logical choice since this would be a direct measurement of the stream associated with the emissions that are being measured (Mridul, 2001). The vehicle tail-pipe was connected to a stainless steel extension tube (length: 1.4 m; ID: 2.5 in.), which was equipped with a Pitot tube at
15
the center cross-section allowing for the direct measurement of the dynamic and static pressures by means of a low-differential pressure transmitter (Cole-Parmer A068071-18, range 0–0.62 mbar) and a K-type thermo-couple. The signals where averaged and registered with a National Instruments®card (DAQ-6035) every 1 s running under the LabView® environment. From this information, the gas velocity within the duct and
20
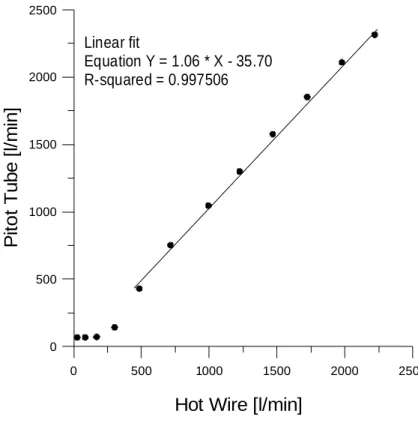
thus the flow rate could be calculated. A comparison and calibration of the flow rate from the Pitot tube in the 110–1340 liter min−1 range could be performed against a hot-wire system (Dantec. Stream Line 90N10). The plot of this procedure, presented in Fig. 3, shows a deviation from linearity in the lower end of this range, associated with the limited sensitivity of the Pitot tube system. Mass-flow rates for the tick-over mode,
25
ACPD
6, 5773–5796, 2006 Vehicular emissions by extractive FTIR spectroscopy F. Reyes et al. Title Page Abstract Introduction Conclusions References Tables Figures J I J I Back Close Full Screen / EscPrinter-friendly Version Interactive Discussion 2.3 Test vehicle
The results presented here correspond to a Toyota Prius Hybrid System (THS) model 2002, which was lent to the University by the Mexican Ministry of the Environment (INE-SEMARNAT) for a 2-week period. This vehicle is powered by an internal combus-tion engine (16-valve, 1.5-liter displacement, in line 4-cylinder engine) using the local
5
regular unleaded gasoline PEMEX Magna (DGN-SECOFI, 1994) and an alternating electrical synchronous motor. The electric drive is composed of a permanent mag-net AC synchronous motor, a generator, an inverter and a nickel-metal hydride battery pack, which is recharged during deceleration or breaking allowing it to operate as a regular light-duty vehicle. The 2002 hybrid motor is capable of producing 58
horse-10
power at 4000 rpm. For more details on the THS the reader is advised to access more specialized documentation (http://www.toyota.com/prius/).
2.4 Dynamometer and driving cycles
A chassis dynamometer built by the Department of Engineering of UNAM (Santiago et al., 2000) was used for testing the emissions of the hybrid vehicle. Five driving
cy-15
cles developed for different regions of Mexico City (Gonz´alez et al., 2003), followed one after the other with a 3 min pause between them, comprise the MCMA-sequence used in these experiments. Each cycle is between 323 and 1002 s long and the en-tire sequence is more than 1 h long. Cycles of the Federal Test Procedure (FTP-75) were also run at the dynamometer for comparison purposes. The general parameters
20
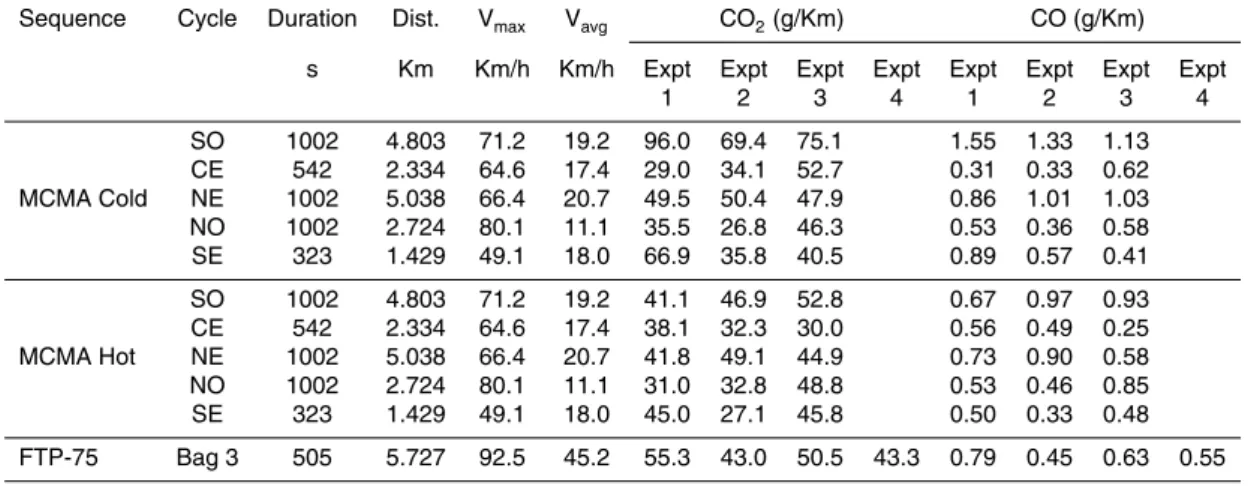
of the MCMA driving sequence, composed of 5 cycles labeled according to section of the city (SO=south-east, CE=center, NE=north-east, NO=north-west, SE=south-east), together with the FTP-75, are summarized in Table 1. As can be expected from the traffic conditions in Mexico City and the reduced number of highways, the MCMA sequence has a much lower average velocity than the FTP-75 cycle, commonly used
25
ACPD
6, 5773–5796, 2006 Vehicular emissions by extractive FTIR spectroscopy F. Reyes et al. Title Page Abstract Introduction Conclusions References Tables Figures J I J I Back Close Full Screen / EscPrinter-friendly Version Interactive Discussion
3 Results and discussion
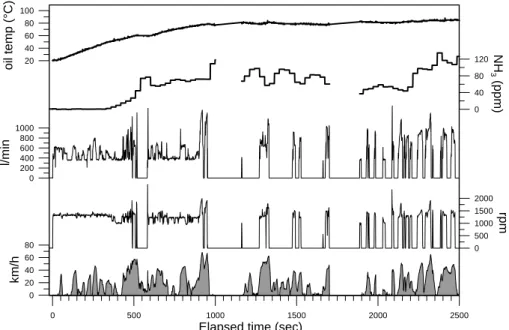
The test vehicle and dynamometer were instrumented so that the following parameters were registered during the driving sequence: velocity, rpm, torque, power, temperature of the oil, temperatures before and after the catalytic filters, voltage and current from the battery pack, flow and temperature at the tail-pipe. Moreover, fuel consumption and
5
distance were registered before and after every driving cycle. In Fig. 4, some of these parameters are plotted during a cold-start sequence. It can be seen by following the revolutions-per-minute (rpm) curve that the internal-combustion engine of the hybrid vehicle is permanently on during the first 6 to 9 min when started in cold conditions, al-though this may vary depending on the state-of-charge of the battery pack. The rpm’s,
10
which were measured directly at the spark-plugs by a reflective sensor HOA1405, cor-relate very well with the mass-flow measured at the tail-pipe by the Pitot tube.
The information acquired during the cycles, together with the concentration of var-ious gases measured at the tail-pipe with the FTIR spectrometer, allowed for the de-termination of emission factors either in mass units per volume of fuel consumed or
15
per distance traveled. Even though the concentration of the gases increases at the tail-pipe due to accumulation when the IC engine stops, as can be seen at ∼500 s in Fig. 4, the calculated emissions during these events cancels out since the mass flow at the tail-pipe is zero. These events become more frequent as the hybrid vehicle reaches a quasi steady-state. The evolution of certain gases, as will be shown later, can also
20
be followed and analyzed along specific driving conditions.
From the more that 15 MCMA-sequences run during a two week time period, only six of these (when all instruments where funcioning properly at the same time) were considered for calculating the emissions presented here. Three MCMA sequences at cold-start and three at hot-start conditions, together with four FTP-75 cycles run for
25
comparison purposes, are presented in Table 1. It can be observed from the table, that there is some variability in the emissions of CO2and CO obtained in the different runs. This is likely to be mostly due to the difference in the battery’s state-of-charge
ACPD
6, 5773–5796, 2006 Vehicular emissions by extractive FTIR spectroscopy F. Reyes et al. Title Page Abstract Introduction Conclusions References Tables Figures J I J I Back Close Full Screen / EscPrinter-friendly Version Interactive Discussion of the hybrid system in each individual run. Although not shown, the repeatability in
the calculated emissions was found to be considerably better when conventional IC vehicles were analyzed.
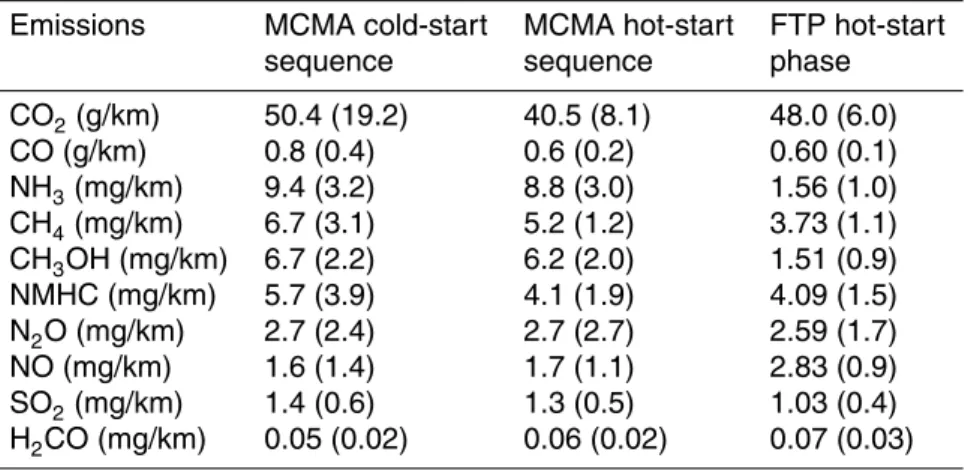
The average emissions from the various tests performed for the Prius 2002 vehicle under Mexico City driving conditions are presented in Table 2. The results obtained
5
during cold-start and hot-start conditions are presented separately. Only the hot-phase from the FTP-75 corresponding to bag #3 was run for comparison purposes and is also shown in the table. It is evident when comparing the results from the local to the more widely used driving sequence (FTP), that the emissions of some pollutants depend strongly on local driving patterns and habits and could have therefore an
im-10
portant implication when the emission factors of mobile sources are estimated from other locations.
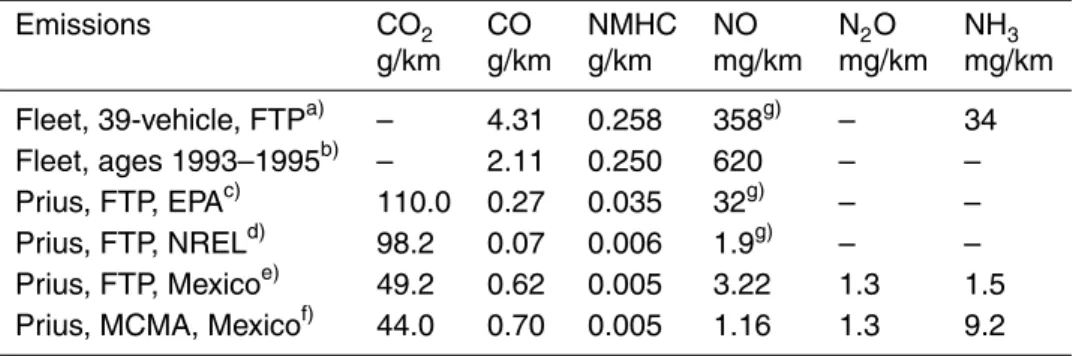
A summary of the results from other studies and this work is presented in Table 3. It can be observed from the table that the emissions from hybrid vehicles is considerably lower than from fleets of conventional vehicles tested in different locations. In general,
15
the emissions of CO2 from this study are a factor of two or more lower than from other studies performed on the Toyota Prius vehicle in other locations, whereas the CO emissions are 2–8 times higher. This could be indicative of a lower efficiency in the combustion process at a high altitude location (2240 m a.s.l.). NO emissions running in the FTP hot-start cycles are also slightly higher in this evaluation when compared
20
to the study performed by NREL, although here NO emissions is reported specifically rather than NOx(NO+NO2).
Another possible explanation of the reduced emissions obtained for CO2is that the dynamometer used in this study did not have the inertial weights which would better simulate the mass of the vehicle while accelerating and breaking. Rather, the rolls were
25
equipped with magnetic breaks, which applied a constant force during the driving cycle. This does not represent in reality the effect of inertia felt by the car. The magnitude of the applied resistance was chosen according to the experience acquired from previous studies although the vehicle could be experiencing a lower inertia in certain conditions
ACPD
6, 5773–5796, 2006 Vehicular emissions by extractive FTIR spectroscopy F. Reyes et al. Title Page Abstract Introduction Conclusions References Tables Figures J I J I Back Close Full Screen / EscPrinter-friendly Version Interactive Discussion from what it would feel on the road. The fuel consumption in our study, however, is fairly
similar to the ones reported for city conditions elsewhere. EPA reports 52 mpg (EPA, 1998) and NREL 57.3 mpg (NREL, 2001) for cold-start conditions. The consumption results in this study were 47.8 mpg during the cold-start sequence and 50.6 mpg dur-ing the hot-start sequence. Although the lack of inertial weights in this experiment
5
may account for some of the reduced CO2 observed, other factors such as gasoline composition and altitude are likely to have an important contribution. Moreover, the considerable higher CO and NO emissions found in this study compared to NREL fol-lowing the FTP-75 driving cycles, would suggest that these factors are affecting the emissions for which this vehicle was designed.
10
It can be observed from Tables 2 and 3 that in this study, the NH3and CH3OH emis-sions during the FTP-75 cycle (bag #3) are a factor of 6 and 3 lower, respectively, than in the MCMA cycle. NO emissions, on the other hand, are almost a factor of three lower in the MCMA cycle than during the FTP-75 cycle. Although the emissions of these gases are lower when compared to the emissions of fleets composed of
con-15
ventional vehicles, it is interesting to observe such large discrepancies when different driving patterns are analyzed. The lower driving speeds tend to release less NO per distance traveled but considerably more NH3and CH3OH than when driving at higher speeds (FTP). This has been stated elsewhere (Heeb et al., 2004) and made evident in this study, suggesting that important uncertainties may arise when estimating the
20
emission factors of mobile sources using different driving patterns from those practiced in that location.
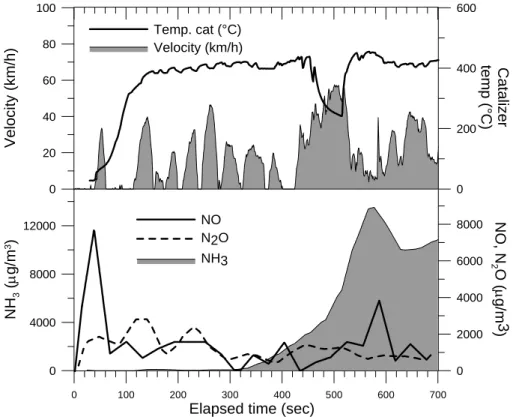
Figure 5 shows the evolution of NO, N2O and NH3as the temperature of the catalytic converter increases and reaches a specific working range. In this plot one can observe that the emission of NO is rapidly reduced to very low values after cold ignition, giving
25
rise to moderate N2O and eventually NH3 emissions. It is also evident that since the motor of the IC engine is constantly turning on and off, like it happens after 400 s in this particular example, the temperature within the catalytic filter is not stable and thus never reaches a steady state in hybrid vehicles. This could be affecting the efficiency
ACPD
6, 5773–5796, 2006 Vehicular emissions by extractive FTIR spectroscopy F. Reyes et al. Title Page Abstract Introduction Conclusions References Tables Figures J I J I Back Close Full Screen / EscPrinter-friendly Version Interactive Discussion of the filter since it is not working steadily during normal operation. The increase of NO
and NH3after the ∼2 min cool-down observed in the plot could be a proof of this. An important non-regulated gas emitted by cars is ammonia. It has been shown experimentally that NH3 emissions from vehicles may be more significant than previ-ously thought (Durbin et al., 2001; Fraser et al., 1998; Shores et al., 2000; Kean et
5
al., 2000; Baum et al., 2000; Gertler et al., 2001). This could contribute to increased levels of aerosols having health implications and playing an important role in the at-mospheric chemistry of urban air (Finlayson-Pitts et al., 2000). It has been shown that the large concentrations of gaseous NH3 detected in Mexico City, peaking >30 ppb in some places, are converted to the aerosols specifically in the accumulation mode
10
(Moya et al., 2004). The emissions of N2O has also been investigated and needs to be property regulated since it is an important greenhouse gas (Berges et al., 1993; Ballantyne et al., 1994; Michaels et al., 1998; Baronick et al., 2000) having a global warming potential 296 times greater of that of carbon dioxide (IPCC, 2001). The global atmospheric concentration of N2O has steadily increased 1.5 ppm/year in the past two
15
decades, and is now 16 % (46 ppb) larger than before the Industrial Era (1750). Since N2O and NH3are primarily formed in reactions that occur on the catalyst sur-face, their emission need to be investigated in specific atmospheric conditions and for specific fuel types. Only the more recent emissions inventory of the Mexico City Metropolitan Area (GDF, 2002), includes ammonia although the estimates are
calcu-20
lated based on studies made on other locations rather that from measurements per-formed locally. These estimates need to be reconsidered based on real observations in order to determine more precisely what fraction of the total ammonia and N2O emis-sions in the city originate from mobile sources.
4 Conclusions
25
In summary, the methodology described here serves as a valuable tool to determine car emissions of regulated and unregulated gases. In particular, it has been shown
ACPD
6, 5773–5796, 2006 Vehicular emissions by extractive FTIR spectroscopy F. Reyes et al. Title Page Abstract Introduction Conclusions References Tables Figures J I J I Back Close Full Screen / EscPrinter-friendly Version Interactive Discussion that it can be used to measure in real-time the emissions from a vehicles below the
ULEV standards. This study is the first of its kind reporting non-regulated emissions of a hybrid vehicle tested in a high altitude location and using the local gasoline and driving patterns of the MCMA. Results include the emissions of CO2, CO, CH4, NMHC, NO, N2O, NH3, SO2, H2CO and CH3OH both for the MCMA-sequence and the
FTP-5
75 (bag #3) driving cycle. This experimental set-up can be applied to the study of vehicles with alternative fuels, like compressed natural gas (CNG), liquefied petroleum gas (LPG), alcohol blends with Diesel and bio-Diesel. With no doubt, in the coming years the spectroscopic techniques will further develop to satisfy the demands of the automotive industry to accurately measure the exhausts gases of newer vehicles with
10
higher efficiencies and lower emissions. Furthermore, the detailed and on-line analysis of the composition of the exhaust gases can be used on investigations related to the optimization of emission control systems, as shown above.
Further work will follow to further optimize the parameter of the analytical method depending on the application. There is a strong need to evaluate the emissions in
on-15
road conditions, which together with GPS data, will serve to reproduce and compare the evaluations done over the dynamometer platform. The data acquired for specific rpm and torque will be used by the Advisor software (NREL Advisor, 2002), which will be capable of simulating the emissions of any given route for a specific type of vehicle. This information can be extrapolated for a given fleet so that the emissions
20
inventories due to mobile sources could be improved significantly for the MCMA or any given region.
Acknowledgements. This research has been funded by UNAM-DGAPA (PAPIIT-101002),
SEMARNAT-CONAYT (C01-0252) and the Earth Sciences Graduate Program of UNAM.
References
25
Adachi, M.: Emission measurement techniques for advanced powertrains, Measurement Sci-ence and Technology, 11(10), R113–R129, 2000.
ACPD
6, 5773–5796, 2006 Vehicular emissions by extractive FTIR spectroscopy F. Reyes et al. Title Page Abstract Introduction Conclusions References Tables Figures J I J I Back Close Full Screen / EscPrinter-friendly Version Interactive Discussion
ASTM: Standard test method for determination of gaseous compounds by extractive direct interface Fourier Transform Infrared (FTIR) Spectroscopy, American Society for Testing and Materials, PA, USA, 2002.
Ballantyne, V. F., Howes, P., and Stephanson, L.: Nitrous oxide emissions from light-duty vehi-cles, SAE Technical Paper, No. 940304, 1994.
5
Baronick, J., Heller, B., Lach, G., and Ramacher, B.: Impact of sulfur in gasoline on nitrous oxide and other exhaust gas components, Society of Automotive Engineers (SAE) Technical Paper, No. 2000-01-0857, 2000.
Baum, M. M., Kiyomiya, E. S., Kumar, S., and Lappas, A. M., and Lord III, H. C.: Multi-component remote sensing of vehicle exhaust by dispersive absorption spectroscopy. 1.
10
Effect of fuel type and catalyst performance, Environ. Sci. Technol., 34(13), 2851–2858, 2000.
Berges, M. G. M., Hofmann, R. M., Scharffe, D., and Crutzen, P. J.: Nitrous-oxide emissions from motor-vehicles in tunnels and their global extrapolation, Journal of Geophysical Re-search, 98, 18 527–18 531, 1993.
15
Bishop, G., Stedman, D., Delagarza, C. J., and D ´avalos, F.: On-Road remote sensing of vehicle Emission in Mexico, Environ. Sci. Technol., 31(12), 3505–3510, 1997.
CARB: Procedure for determination of nitrous oxide in automotive exhaust by Fourier Transform Infrared Spectroscopy, pp. 1–23, California Environmental Protection Agency, El Monnte, Ca, 2004.
20
DGN-SECOFI: Contaminaci ´on atmosf ´erica-especificaciones sobre protecci ´on ambiental que deben reunir los combustibles f ´osiles l´ıquidos y gaseosos que se usan en fuentes fijas y m ´oviles, in NORMA Oficial Mexicana NOM-086-ECOL-1994, 1–14, M ´exico DF, 1994. Durbin, T. D., Norbeck, J. M., Huai, T., and Rhee, S. H.: Investigation of emission rates of
ammonia and other toxic and low-level compounds using FTIR, Final Report for the South
25
Coast Air Quality Management District under contract No. 99131 by the Bourns College of Engineering Center for Environmental Research and Technology, September, Riverside, CA 92521, 2001.
Durbin, T. D., Wilson, R. D., Norbeck, J. M., Wayne, J. M., Huai, T., and Rhee, S. H.: Es-timates of the emission rates of ammonia from light-duty vehicles using standard chassis
30
dynamometer test cycles, Atmos. Environ., 36, 1475–1482, 2002.
EPA: Evaluation of a Toyota Prius Hybrid System (THS), United States Environmental Protec-tion Agency (USEPA), Ann Arbor, MI 48105, 1–63, 1998.
ACPD
6, 5773–5796, 2006 Vehicular emissions by extractive FTIR spectroscopy F. Reyes et al. Title Page Abstract Introduction Conclusions References Tables Figures J I J I Back Close Full Screen / EscPrinter-friendly Version Interactive Discussion
EPA: Method 320; Measurement of vapor phase organic and inorganic emissions by extractive Fourier transform infrared (FTIR) spectroscopy, in: Federal Register, Environmental Pro-tection Agency, 40 CFR Part 63, Appendix A to Part 63-Test Methods, (March 24, 1998), 14 219–14 228, 1998a.
EPA: Fuel Economy Guide, DOE/EE-0302, U.S. Department of Energy, 1–26, 2005.
5
Finlayson-Pitts, B. J. and Pitts, J. N.: Chemistry of the upper and lower atmosphere, Academic Press, San Diego, California, 2000.
Fraser, M. P. and Cass, G. R.: Detection of excess ammonia emissions from in-use vehicles and the implications for fine particle control, Environ. Sci. Technol., 32(8), 1053–1057, 1998. GDF: Inventario de Emisiones de la Zona Metropolitana del Valle de M ´exico, Gobierno del
10
Distrito Federal, Secretaria del Medio Ambiente, M ´exico D.F., 1–309, 2002.
Gertler, A. W., Sagebiel, J. C., and Cahill, T. A.: Measurements of ammonia emissions from vehicles in a highway tunnel, in Proceedings of the 11th CRC Onroad Vehicle Emissions Workshop, San Diego, CA, March, 2001
Gonz ´alez, O. R. and Galv ´an, Z. A.: Desarrollo de ciclos de manejo caracter´ısticos de la Ciudad
15
de M ´exico, in Memorias del IX Congreso Anual, Soc. Mex. de Ing. Mec., 535–544, 2003. Grutter, M.: Multi-Gas analysis of ambient air using FTIR spectroscopy over Mexico City,
Atm ´osfera, 16, 1–13, 2003a.
Grutter, M., Flores, E., Basaldud, R., and Ruiz-Su ´arez, L. G.: Open-path FTIR spectroscopic studies of the trace gases over Mexico City, Atmos. Ocean. Opt., 16(3), 232–236, 2003b.
20
Heeb, N. V. F., Br ¨uhlmann, A. M., L ¨uscher, S., Saxer, R. T., and Ch.Hug, P.: Presented at 13th Int. scientific symposium on transport and air pollution, September 13–15 Boulder, CO, USA, 149–156, 2004.
IPCC: Climate Change 2001: The Scientific Basis, Contribution of Working Group I to the Third Assessment Report of the Intergovernmental Panel on Climate Change, edited by:
25
Houghton, J. T., Ding, Y., Griggs, D. J., Noguer, M., van der Linden, P. J., Dai, X., Maskell, K., and Johnson, C. A., pp. 881, Cambridge University Press, Cambridge, United Kingdom and New York, NY, USA, 2001.
Kean, A. J., Harley, R., Littlejohn, D., and Kendall, G.: On-road measurement of ammonia and other Motor vehicle exhaust emissions, Environ. Sci. Technol., 34(17), 3535–3539, 2000.
30
Larry, P. H.: Comparison of Fourier Transform Infrared Spectrometry and 2,4=dinitrophenyl-hydrazine impinger techniques for the measurement of formaldehyde in vehicle exhaust, Analytical Chemistry, 58(1), 68–72, 1986.
ACPD
6, 5773–5796, 2006 Vehicular emissions by extractive FTIR spectroscopy F. Reyes et al. Title Page Abstract Introduction Conclusions References Tables Figures J I J I Back Close Full Screen / EscPrinter-friendly Version Interactive Discussion
Michaels, H., Fulper, C., and Kolowich, B.: Nitrous oxide emission factors for mobile sources, Presented at the AWMA Emission Inventory Conference, New Orleans, LA, 1998.
Moya, M., Grutter, M., and Ba ´ez, A.: Diurnal variability of size-differentiated inorganic aerosols and their gas-phase precursors during January and February of 2003 near downtown Mexico City, Atmos. Environ., 38, 5651–5661, 2004.
5
Mridul, G., Gregory, J. T., Daniel, K. C., Nigel, N. C., Benjamin, C. S., Wesley, C. R., and Donald, W. L.: Measurement of In-Use, on board emissions from heavy-duty diesel vehicles: Mobile emissions measurement system, SAE Technical Paper, No. 2001-01-3643, 2001. NIOSH: Method 3800; Organic and inorganic gases by FTIR spectroscopy, in NIOSH Manual
de Analytical Methods (NMAM), 1–47, 2000.
10
NREL: Benchmarking of OEM Hybrid Electric Vehicles at NREL, pp. 1–104, Center for Trans-portation Technologies and Systems. National Renewable Energy Laboratory, Golden, Col-orado, USA, 2001.
NREL: ADVISOR (Advanced Vehicle Simulator), U.S. Department of Energy (DOE) and Na-tional Renewable Energy Laboratory (NREL), 2002.
15
Rothman, L. S., Jacquemart, D., Barbe, A., Chris Benner, D., Birk, M., Brown, L. R., Carleer, M. R., Chackerian Jr., C., Chance, K., Coudert, L. H., Dana, V., Devi, V. M., Flaud, J.-M., Gamache, R. R., Goldman, A., Hartmann, J.-J.-M., Jucks, K. W., Maki, A. G., Mandin, J.-Y., Massie, S. T., Orphal, J., Perrin, A., Rinsland, C. P., Smith, M. A. H., Tennyson, J., Tolchenov, R. N., Toth, R. A., Vander Auwera, J., Varanasi, P., and Wagner, G.: The HITRAN
20
2004 molecular spectroscopy database, Journal of Quantitative Spectroscopy & Radiative Transfer, 96, 139–204, 2005.
Santiago, C. L. and Rinc ´on, G. P. I.: Instrumentation of the emission control laboratory at the engineering school of the National Autonomous University of Mexico, Instrumentation and Development, 4(5), 19–24, 2000.
25
Shores, R. C., Walker, J., Kimbrough, S., McCulloch, R. B., Rodgers, M. O., and Pearson, J. R.: Measurement of ammonia emissions from EPA’s instrumented vehicle, in: Proceedings of the 10th CRC On-Road Vehicle Emissions Workshop, 2000.
VDI: Remote sensing – Atmospheric measurements near ground with FTIR spectroscopy – Measurement of gaseous emissions and immissions - Fundamentals, VDI 4211 D ¨usseldorf,
30
ACPD
6, 5773–5796, 2006 Vehicular emissions by extractive FTIR spectroscopy F. Reyes et al. Title Page Abstract Introduction Conclusions References Tables Figures J I J I Back Close Full Screen / EscPrinter-friendly Version Interactive Discussion
Table 1. General information of the driving cycles used in this study with the emission results for
CO2and CO for 6 experiments running the Mexico City Metropolitan Area (MCMA) sequence. Four FTP-75 runs under hot conditions (Bag 3) are also shown.
Sequence Cycle Duration Dist. Vmax Vavg CO2(g/Km) CO (g/Km) s Km Km/h Km/h Expt Expt Expt Expt Expt Expt Expt Expt
1 2 3 4 1 2 3 4 SO 1002 4.803 71.2 19.2 96.0 69.4 75.1 1.55 1.33 1.13 CE 542 2.334 64.6 17.4 29.0 34.1 52.7 0.31 0.33 0.62 MCMA Cold NE 1002 5.038 66.4 20.7 49.5 50.4 47.9 0.86 1.01 1.03 NO 1002 2.724 80.1 11.1 35.5 26.8 46.3 0.53 0.36 0.58 SE 323 1.429 49.1 18.0 66.9 35.8 40.5 0.89 0.57 0.41 SO 1002 4.803 71.2 19.2 41.1 46.9 52.8 0.67 0.97 0.93 CE 542 2.334 64.6 17.4 38.1 32.3 30.0 0.56 0.49 0.25 MCMA Hot NE 1002 5.038 66.4 20.7 41.8 49.1 44.9 0.73 0.90 0.58 NO 1002 2.724 80.1 11.1 31.0 32.8 48.8 0.53 0.46 0.85 SE 323 1.429 49.1 18.0 45.0 27.1 45.8 0.50 0.33 0.48 FTP-75 Bag 3 505 5.727 92.5 45.2 55.3 43.0 50.5 43.3 0.79 0.45 0.63 0.55
ACPD
6, 5773–5796, 2006 Vehicular emissions by extractive FTIR spectroscopy F. Reyes et al. Title Page Abstract Introduction Conclusions References Tables Figures J I J I Back Close Full Screen / EscPrinter-friendly Version Interactive Discussion
Table 2. Emission results of the Toyota Prius 2002 tested on a dynamometer under typical
Mexico City conditions and during the hot FTP-75 cycle (Bag 3). The standard deviation from all test considered are given in brackets.
Emissions MCMA cold-start MCMA hot-start FTP hot-start
sequence sequence phase
CO2(g/km) 50.4 (19.2) 40.5 (8.1) 48.0 (6.0) CO (g/km) 0.8 (0.4) 0.6 (0.2) 0.60 (0.1) NH3(mg/km) 9.4 (3.2) 8.8 (3.0) 1.56 (1.0) CH4(mg/km) 6.7 (3.1) 5.2 (1.2) 3.73 (1.1) CH3OH (mg/km) 6.7 (2.2) 6.2 (2.0) 1.51 (0.9) NMHC (mg/km) 5.7 (3.9) 4.1 (1.9) 4.09 (1.5) N2O (mg/km) 2.7 (2.4) 2.7 (2.7) 2.59 (1.7) NO (mg/km) 1.6 (1.4) 1.7 (1.1) 2.83 (0.9) SO2(mg/km) 1.4 (0.6) 1.3 (0.5) 1.03 (0.4) H2CO (mg/km) 0.05 (0.02) 0.06 (0.02) 0.07 (0.03)
ACPD
6, 5773–5796, 2006 Vehicular emissions by extractive FTIR spectroscopy F. Reyes et al. Title Page Abstract Introduction Conclusions References Tables Figures J I J I Back Close Full Screen / EscPrinter-friendly Version Interactive Discussion
Table 3. Comparison of emission results of other studies with this work.
Emissions CO2 CO NMHC NO N2O NH3 g/km g/km g/km mg/km mg/km mg/km Fleet, 39-vehicle, FTPa) – 4.31 0.258 358g) – 34 Fleet, ages 1993–1995b) – 2.11 0.250 620 – – Prius, FTP, EPAc) 110.0 0.27 0.035 32g) – – Prius, FTP, NRELd) 98.2 0.07 0.006 1.9g) – – Prius, FTP, Mexicoe) 49.2 0.62 0.005 3.22 1.3 1.5
Prius, MCMA, Mexicof) 44.0 0.70 0.005 1.16 1.3 9.2
a)
(Durbin et al., 2001) average age 1996 b)
On-road measurements by Bishop (1997) in Monterrey, Mexico c)
(EPA, 1998), all 4 bags weighted d)
(NREL, 2001), all 4 bags weighted e)
This work, FTP-75, Hot-start phase (Bag #3 only) f)
This work, hot-start sequence g)
ACPD
6, 5773–5796, 2006 Vehicular emissions by extractive FTIR spectroscopy F. Reyes et al. Title Page Abstract Introduction Conclusions References Tables Figures J I J I Back Close Full Screen / EscPrinter-friendly Version Interactive Discussion EGU detector FTIR spectrometer White cell < 32 m tail-pipe exhaust extension tube to pump gas sample differential pressure flow meter 0.2µm filter water trap
and flow regulator
Figure 1. Schematic diagram of the exhaust analysis system composed of a flow measurement tube, a sample line, water extraction valve, filters, gas cell and FTIR spectrometer.
Fig. 1. Schematic diagram of the exhaust analysis system composed of a flow measurement
tube, a sample line, water extraction valve, filters, gas cell and FTIR spectrometer.
ACPD
6, 5773–5796, 2006 Vehicular emissions by extractive FTIR spectroscopy F. Reyes et al. Title Page Abstract Introduction Conclusions References Tables Figures J I J I Back Close Full Screen / EscPrinter-friendly Version Interactive Discussion EGU 0 5 10 15 20 25 30 35 Acquisition (sec) 0.04 0.08 0.12 0.16 0.2 No is e ( R MS) 0.5 cm-1 1.0 cm-1 (a) 0 1 Resolution (cm2 -1) 3 4 0 0.1 0.2 0.3 0.4 0.5 No is e ( R MS ) Optical path = 4.0 m Mirror velocity 1.9 m/s (b)
Figure 2. a) Spectral noise expressed as the root-mean-square (RMS) in the region 2400 – 2500 cm-1 as a function of acquisition time for 0.5 and 1.0 cm-1 resolutions. b) Spectral noise
versus spectral resolution keeping the acquisition time constant.
Fig. 2. (a) Spectral noise expressed as the root-mean-square (RMS) in the region 2400–
2500 cm−1as a function of acquisition time for 0.5 and 1.0 cm−1resolutions. (b) Spectral noise
versus spectral resolution keeping the acquisition time constant.
ACPD
6, 5773–5796, 2006 Vehicular emissions by extractive FTIR spectroscopy F. Reyes et al. Title Page Abstract Introduction Conclusions References Tables Figures J I J I Back Close Full Screen / EscPrinter-friendly Version Interactive Discussion
EGU
0 500 1000 1500 2000 2500
Hot Wire [l/min]
0 500 1000 1500 2000 2500Pi
to
t T
ube [
l/
m
in
]
Linear fit Equation Y = 1.06 * X - 35.70 R-squared = 0.997506Figure 3. Calibration curve of the tail-pipe flow rate measured continuously with Pitot tube
against a hot-wire system.
Fig. 3. Calibration curve of the tail-pipe flow rate measured continuously with Pitot tube against
a hot-wire system.
ACPD
6, 5773–5796, 2006 Vehicular emissions by extractive FTIR spectroscopy F. Reyes et al. Title Page Abstract Introduction Conclusions References Tables Figures J I J I Back Close Full Screen / EscPrinter-friendly Version Interactive Discussion
EGU 0 500 1000 1500 2000 2500
Elapsed time (sec)
0 500 1000 1500 2000 rpm 0 200 400 600 800 1000 l/m in 0 20 40 60 80 km /h 20 40 60 80 100 o il t e mp (° C) 0 40 80 120 NH 3 (ppm)
Figure 4. Example of some of the parameters registered from the Toyota Prius during the first 2500 s of the MCMA-driving sequence. This section corresponds to the first three cycles (SO, CE and part of NE) run during the cold-start phase.
Fig. 4. Example of some of the parameters registered from the Toyota Prius during the first
2500 s of the MCMA-driving sequence. This section corresponds to the first three cycles (SO, CE and part of NE) run during the cold-start phase.
ACPD
6, 5773–5796, 2006 Vehicular emissions by extractive FTIR spectroscopy F. Reyes et al. Title Page Abstract Introduction Conclusions References Tables Figures J I J I Back Close Full Screen / EscPrinter-friendly Version Interactive Discussion
EGU
0 100 200 300 400 500 600 700
Elapsed time (sec)
0 4000 8000 12000 NH 3 ( µg/ m 3) 0 2000 4000 6000 8000 NO, N 2O ( µ g/m 3 ) NO N2O NH3 0 20 40 60 80 100 Velocity (km/h) 0 200 400 600 Ca ta lize r te m p (° C) Temp. cat (°C) Velocity (km/h)
Figure 5. Evolution of the gas concentrations at the tail-pipe of the Toyota Prius for NO, N2Ο ανδ ΝΗ3 (in µg/m3) after cold-start of the first 700 s of the MCMA driving sequence
Fig. 5. Evolution of the gas concentrations at the tail-pipe of the Toyota Prius for NO, N2O and NH3(in µg/m3) after cold-start of the first 700 s of the MCMA driving sequence.