HAL Id: hal-01671217
https://hal.archives-ouvertes.fr/hal-01671217
Submitted on 10 Jul 2019HAL is a multi-disciplinary open access archive for the deposit and dissemination of sci-entific research documents, whether they are pub-lished or not. The documents may come from teaching and research institutions in France or abroad, or from public or private research centers.
L’archive ouverte pluridisciplinaire HAL, est destinée au dépôt et à la diffusion de documents scientifiques de niveau recherche, publiés ou non, émanant des établissements d’enseignement et de recherche français ou étrangers, des laboratoires publics ou privés.
Does CSR impact premiums in M&A transactions?
Mathieu Gomes, Sylvain Marsat
To cite this version:
Mathieu Gomes, Sylvain Marsat. Does CSR impact premiums in M&A transactions?. Finance Re-search Letters, Elsevier, 2018, 26, pp.71 - 80. �10.1016/j.frl.2017.12.005�. �hal-01671217�
1
Does CSR impact premiums in M&A transactions?
Mathieu GOMES
a, Sylvain MARSAT
aa
Université Clermont Auvergne, CRCGM, 11 bd Charles de Gaulle, F- 63000
Clermont-Ferrand, France.
Version accepted for publication in:
Gomes, M., Marsat, S., 2018. Does CSR impact premiums in M&A transactions? Finance Research Letters 26, 71-80
Abstract
Studies linking corporate social responsibility (CSR) to the market value of firms for marginal investors have found mixed evidence. However, the case of strategic acquirers has scarcely been analyzed. We investigate whether CSR is valued by acquirers in mergers and acquisitions (M&A) and find that CSR is positively associated with bid premiums. Interestingly, while environmental performance is generally valued by acquirers, social performance only commands a premium in cross-border transactions. Our findings suggest that acquirers value targets’ CSR involvement and may consider it as a way to reduce information asymmetry and targets’ specific risk.
Keywords: Corporate social responsibility, Mergers and acquisitions, Acquisition premium JEL Classification: G30, G34, M14
1. Introduction
A series of interviews with corporate buyers conducted by PwC in 20121 revealed that performance on corporate social responsibility (CSR) factors could largely impact deal valuation. More precisely, it revealed that good CSR performance was usually integrated in the valuation of the target company and that poor CSR performance could be used as a lever in negotiating a discount. Such qualitative evidence suggests CSR plays an important role in mergers and acquisitions (M&A). However, in spite of the growing CSR literature, attempts to empirically investigate its impact on M&A are scarce.
CSR has been discussed in academic studies for decades. The debate focuses on why firm would invest significant resources on CSR activities and features two opposing views. On the one hand, the shareholder expense view (Friedman, 1970) claims that the only social responsibility of business should be to increase profits and maximize shareholder value. On the other hand, the stakeholder view (Freeman, 1984; Porter and Kramer, 2006) suggests that ethical behavior and profit
1 Source: The Integration of Environmental, Social and Governance Issues in Mergers and Acquisitions Transactions, December 2012, PwC/PRI.
2 are not mutually exclusive and that CSR activities may actually enable firms to be more profitable. These views lead to opposite conclusions as to the impact of CSR on firm valuation and numerous attempts have been made in order to determine which one prevails. Despite much research on the topic (Servaes and Tamayo, 2013; Gregory et al., 2014; Aouadi and Marsat, 2016), the literature has failed to reach a firm and definitive consensus. The relation between CSR performance and firm value may be unclear because of the intangible nature of attributes often associated with CSR. These attributes, which include corporate reputation, culture, and employee’s knowledge and capabilities, can be a source of competitive advantage as per the resource-based view of the firm (Wernerfelt, 1984) insofar as they are difficult to create or replicate (Branco and Rodriguez, 2006). However, these intangible assets are also extremely hard to value.
In light of this difficulty, our paper approaches the problem from a different angle. Instead of examining the impact of CSR performance on the value of firms as perceived by marginal investors (i.e., conveyed by stock market prices), we evaluate the impact of CSR performance on the value assigned to firms by M&A bidders. This approach is particularly relevant for two main reasons. First, in every acquisition, there is an inherent information asymmetry between the acquirer and the target. As a result, M&A bidders perform extensive due diligence analysis of potential acquisition candidates in order to reduce this information asymmetry (Laamanen, 2007) and obtain a great deal of information about the target that is inaccessible to the public. It can therefore be argued that these acquirers have a deeper understanding of the value of a target than the market, and that they are better able to assess its organizational characteristics such as intangible CSR-related assets. Second, M&A bidders are by definition forced to assume a large amount of specific risk because of investment concentration and the high costs associated with the divestiture of acquired businesses. This is in stark contrast with the situation of marginal investors who have the ability to diversify their portfolios and liquidate positions at minimal costs. In other words, while marginal investors are mainly concerned with systematic risk, M&A bidders are largely concerned with targets’ specific risks. Because good relationships with stakeholders decrease firm-specific risk insofar as they build goodwill that reduces cash-flow shocks when negative events materialize (Godfrey et al., 2009), the CSR performance of M&A targets should be of particular importance for acquirers.
3 Given the growing importance attributed to CSR, understanding its value implications is worth further investigation. Although anecdotal evidence suggests a positive link between CSR performance and deal valuation, attempts to examine this matter empirically are almost nonexistent. A notable exception is Chen and Gavious (2015), who study the link between CSR involvement and sale price for a sample of 134 Israeli M&A transactions. In this particular context, the authors find no relationship between CSR involvement and target valuation. Our study aims at complementing this finding and differs from Chen and Gavious (2015) in the following ways. First, we conduct our analysis on a worldwide sample of M&A transactions. Second, we use the bid premium instead of the sale price of the firm’s share in the M&A transaction. This measure has the advantage of capturing the difference between the market’s perception and the acquirer’s assessment of the target, and can be interpreted as a measure of the willingness of the acquirer to pay the target above its pre-takeover market value (Simonyan, 2014). We can therefore specifically assess if the excess amount offered by the acquirer is related to CSR performance, i.e., whether acquirers value this information differently compared with marginal investors because of increased exposure to specific risk and improved knowledge of the target. The premium also captures expected synergies resulting from the deal, which makes it interesting in our case as Aktas et al. (2011) show that more synergistic deals occur with targets that exhibit better CSR performance2. Finally, the premium could also convey information about the way acquirers assess the risk of market manipulation by target insiders (Cumming et al., 2016). Because CSR attributes can be expected to have an impact on such behaviors, studying the link between CSR and premiums could be particularly insightful. Third, while Chen and Gavious (2015) use CSR data from the Maala report, we use CSR scores provided by Thomson Reuters ASSET4. In addition, our international sample enables us to distinguish between domestic and cross-border deals. This distinction is important given the increased complexity of cross-border M&As, which embed greater information asymmetry and a higher risk of improper evaluation compared with domestic operations (Gatignon and Anderson, 1988). Moreover, monitoring the target by the acquirer is even more difficult in cross-border deals as the cost of acquiring reliable and objective information to
2 In control bids (bidders looking to acquire more than 50% of the target), the premium also includes a control premium. No general model exists to estimate this control premium, which adds to the difficulty of explaining the bid premium’s variance. We acknowledge this limitation and thank an anonymous referee for pointing it out.
4 monitor the target in the post-acquisition phase increases considerably (Fama and Jensen, 1983; Cho and Ahn, 2017). Within this framework, extra-financial information is likely to be especially valuable in the assessment of foreign targets.
Using an international sample of 588 deals announced over the 2003-2014 period, we find that targets’ CSR performance is positively associated with bid premiums. We also show that acquirers value CSR performance differently depending on whether the deal involves a domestic or a foreign target. Specifically, while overall and environmental performance are generally positively valued, social performance only commands a premium in the case of cross-border deals, suggesting M&A bidders seek further reduction in information asymmetry through the analysis of “social assets” to compensate for the higher uncertainty associated with cross-border operations.
The contributions of this paper are manifold. First, to the best of our knowledge, we are the first to investigate the worldwide impact of CSR on bid premiums. Second, we show that the assessment of CSR is contingent on the type of investors we focus on. Indeed, while value implications for marginal investors appear to be ambiguous, their significance for better informed corporate acquirers is clear. Overall, we contribute to and build on two main areas in the literature. On the one hand, we complement studies related to the value implications of CSR. On the other hand, we complement previous findings on the determinants of bid premiums.
Our paper proceeds as follows. Section 2 presents the data. Section 3 then introduces our tests and empirical findings. Finally, section 4 concludes.
2. Data
2.1. Measuring CSR
To measure CSR, we use data provided by Thomson Reuters ASSET4. The ASSET4 database includes 5,000 global publicly listed companies and provides history up to fiscal year 2002 for close to 1,000 companies. Specifically, in year t, a firm is assigned a z-score for each of the CSR dimensions (environment and social), benchmarking its performance against the rest of the firms based on all the information available in fiscal year t-1. The resulting percentage is therefore a relative measure of performance, z-scored and normalized to be comprised between 0 and 100%. In this study, for each
5 deal we use the last available ASSET4 scores before the announcement date. Following Lys et al. (2015), we compute a firm’s overall CSR score (CSR) by averaging the scores assigned to the environmental and social dimensions3.
2.2. Computing bid premiums
Premiums are usually computed based on the target price around 40 days before deal announcement. The rationale underlying this lag is to make sure the premium is computed over a price unaffected by potential takeover rumors. We follow Betton et al., (2009) and define the premium as the acquisition price per share offered to target shareholders less the target’s stock price 42 days prior to the acquisition announcement, deflated by the target’s stock price 42 days prior to the acquisition announcement4.
2.3. Sample selection
The selection of our sample is derived in multiple steps. We download a list of international deal offers over the 2003-2014 period from Thomson Financial Securities Data Company (SDC). In line with most studies on the subject, we select all offers where the bidder initially owns less than 50% of the target firm and seeks to acquire more than 50% of the target firm5. Bloomberg and Reuters news services were used to check the information’s accuracy. We then merge this list of deals with the ASSET4 database and remove the bids for which we do not have environmental and social scores for the target. Finally, we merge this sample with the Datastream database to get the necessary controls. We follow standard practice and exclude financial firms. Our final sample contains 588 deal offers6.
3 Appendix A contains a description of the social and environmental factors, as outlined in the ASSET4 documentation.
4 In order to make sure our results are not driven by our lag choice of 42 days, we run our models with premiums computed using a lag ranging from 35 days to 45 days. Results remain virtually the same and are available upon request.
5 We focus on control bids following most previous studies on takeover premiums (Ayers et al., 2003; Betton et al., 2009; Dionne et al., 2015; Rossi and Volpin, 2004). Given the fact we are trying to assess the impact of target CSR on premiums, it makes sense to focus on deals involving a change in control rather than just the acquisition of minority stakes. In addition, the coverage of transfers of minority stakes (below 50%) is likely to be severely affected by cross-country differences in disclosure requirements. Selecting only transfers of stakes above 50% minimizes these disclosure biases (Rossi and Volpin, 2004).
6 Our sample comprises both successful and unsuccessful deals. For robustness purposes, we conduct additional tests focusing on successful deals only (400 observations), using the final price paid instead of the offered price. Results remain virtually the same and are available upon request.
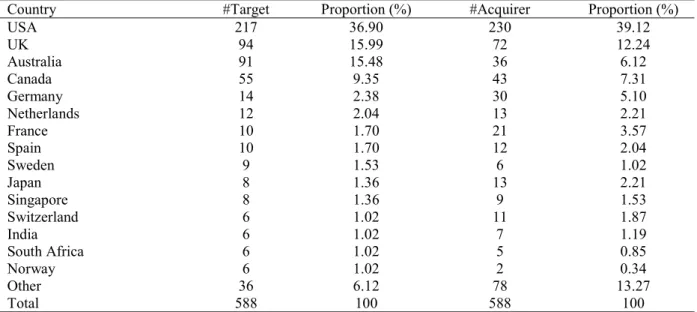
6 Table 1 presents the number of observations per year, the number of cross-border deals, as well as average CSR scores of targets (for overall, environment, and social dimensions). The number of deals ranges from 3 in 2003 to 95 in 2014. The countries and industries involved in the sample appear in Tables 2 and 3, respectively. The US represent the largest proportion with 36.9 percent of targets and 39.1 percent of acquirers, followed by the UK. Overall, 31 countries are represented. Industries that are the most represented are services and manufacturing with 37.8 percent and 29.8 percent of our sample, respectively.
Table 1
Sample distribution by year
Year #Deal Proportion (%) #Cross Border Avg. CSR Avg. Environment Avg. Social
2003 3 0.51 1 0.52 0.46 0.63 2004 5 0.85 0 0.46 0.47 0.45 2005 10 1.70 3 0.60 0.64 0.56 2006 58 9.86 21 0.55 0.47 0.63 2007 67 11.39 34 0.44 0.43 0.45 2008 50 8.50 17 0.45 0.39 0.50 2009 32 5.44 17 0.54 0.54 0.54 2010 66 11.22 28 0.51 0.50 0.52 2011 76 12.93 27 0.45 0.44 0.46 2012 76 12.93 32 0.41 0.40 0.42 2013 50 8.50 17 0.48 0.47 0.49 2014 95 16.16 42 0.47 0.44 0.49 Total 588 100 239 0.48 0.45 0.50
This table provides the sample distribution by announcement year. #Deal denotes the number of deals per year. #Cross Border denotes the number of cross-border deals. Avg. CSR, Avg. Environment, and Avg. Social represent the yearly average scores of targets in the overall, environment, and social dimensions, respectively.
Table 2 Home country
Country #Target Proportion (%) #Acquirer Proportion (%)
USA 217 36.90 230 39.12 UK 94 15.99 72 12.24 Australia 91 15.48 36 6.12 Canada 55 9.35 43 7.31 Germany 14 2.38 30 5.10 Netherlands 12 2.04 13 2.21 France 10 1.70 21 3.57 Spain 10 1.70 12 2.04 Sweden 9 1.53 6 1.02 Japan 8 1.36 13 2.21 Singapore 8 1.36 9 1.53 Switzerland 6 1.02 11 1.87 India 6 1.02 7 1.19 South Africa 6 1.02 5 0.85 Norway 6 1.02 2 0.34 Other 36 6.12 78 13.27 Total 588 100 588 100
This table breaks down the sample by country of domicile. #Target and #Acquirer denote, respectively, the number of targets and acquirers per country.
7 Table 3
Industry
Industry (2-digit SIC code) #Target Proportion (%) #Acquirer Proportion (%)
Agriculture, forestry, and fisheries (01-09) 5 0.85 1 0.17
Mineral industries and construction (10-17) 118 20.07 91 15.48
Manufacturing (20-39) 217 36.90 175 29.76
Transportation and communications (40-48) 63 10.71 38 6.46
Utilities (49) 37 6.29 31 5.27
Wholesale and retail trade (50-59) 47 7.99 30 5.10
Service industries (70-89) 101 17.18 222 37.76
Total 588 100 588 100
This table breaks down the sample by industry. #Target and #Acquirer denote, respectively, the number of targets and acquirers per industry.
2.4. Control variables
Based on studies in this area of research, we include the following control variables: Size (natural logarithm of the market value of equity at previous year-end), MTB (market-to-book), Leverage (total debt divided by total assets), Growth (average sales growth over the three years preceding the announcement date), Runup (logarithm of the ratio of the share price of the target on the day before the announcement to the share price 42 days before the announcement), Liquidity (current ratio), R&D (R&D expenditures scaled by total assets), ROE (return on equity), CAPEX (capital expenditures scaled by total assets), Blockholder (dummy equal to one if the bidder held more than 5% of the target’s shares before deal announcement), Hostile (dummy equal to one if the transaction is defined as hostile by SDC), Cash (dummy equal to one if the transaction is fully paid in cash7), Competing (dummy equal to one if there was a competing bidder for the target), and Cross Border (dummy equal to one if target and acquirer come from different countries). We also control for institutional factors using the shareholder protection indicator developed by Rossi and Volpin (2004). Finally, we include a dummy variable equal to one if the transaction is horizontal (i.e., when acquirer and target belong to the same industry), and zero otherwise. Precision regarding the rationale underlying the choice of these controls is provided in Appendix B. Outliers are dealt with by winsorizing the top and bottom 1% of continuous variables.
7 In our study, we consider both cash-only and stock deals. For robustness purposes, we also conducted all tests featured in this paper using only cash deals (386 observations). None of our conclusions are altered under this specification.
8 3. Results
3.1. CSR and bid premiums
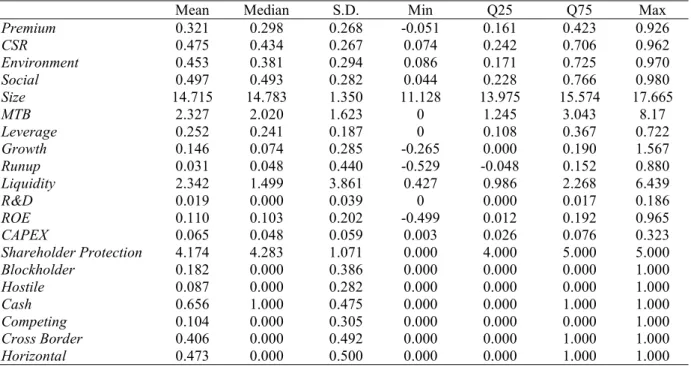
Table 4 presents the summary statistics. The average acquisition premium is 32.1 percent with a standard deviation of 26.8 percent, which is consistent with previous research (Betton et al., 2008). The CSR score averages 0.534 with a standard deviation of 0.212. In order to assess the marginal impact of CSR on premiums, we run the following regression:
= + + + + + ℎ + + + & + + + ℎ ℎ + ℎ + + ℎ + + + + + + + (1) Table 4 Summary statistics
Mean Median S.D. Min Q25 Q75 Max
Premium 0.321 0.298 0.268 -0.051 0.161 0.423 0.926 CSR 0.475 0.434 0.267 0.074 0.242 0.706 0.962 Environment 0.453 0.381 0.294 0.086 0.171 0.725 0.970 Social 0.497 0.493 0.282 0.044 0.228 0.766 0.980 Size 14.715 14.783 1.350 11.128 13.975 15.574 17.665 MTB 2.327 2.020 1.623 0 1.245 3.043 8.17 Leverage 0.252 0.241 0.187 0 0.108 0.367 0.722 Growth 0.146 0.074 0.285 -0.265 0.000 0.190 1.567 Runup 0.031 0.048 0.440 -0.529 -0.048 0.152 0.880 Liquidity 2.342 1.499 3.861 0.427 0.986 2.268 6.439 R&D 0.019 0.000 0.039 0 0.000 0.017 0.186 ROE 0.110 0.103 0.202 -0.499 0.012 0.192 0.965 CAPEX 0.065 0.048 0.059 0.003 0.026 0.076 0.323 Shareholder Protection 4.174 4.283 1.071 0.000 4.000 5.000 5.000 Blockholder 0.182 0.000 0.386 0.000 0.000 0.000 1.000 Hostile 0.087 0.000 0.282 0.000 0.000 0.000 1.000 Cash 0.656 1.000 0.475 0.000 0.000 1.000 1.000 Competing 0.104 0.000 0.305 0.000 0.000 0.000 1.000 Cross Border 0.406 0.000 0.492 0.000 0.000 1.000 1.000 Horizontal 0.473 0.000 0.500 0.000 0.000 1.000 1.000
This table reports summary statistics of variables used in the regressions.
In addition to the set of control variables described in section 2, we control for year, country, and industry8 fixed effects to address unobserved heterogeneity. We tested econometric specifications for multicollinearity by using the variance-inflation factor (VIF). None of the main variables exceeded a
9 VIF of 2.76, well below the generally perceived cut-off level of 10. We can therefore conclude that multicollinearity is not an issue of concern in this study.
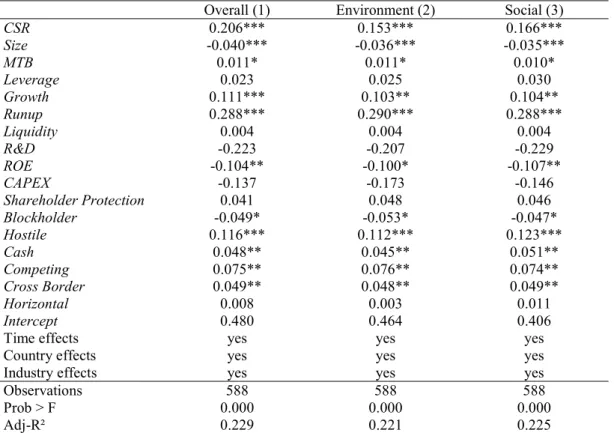
Table 5 displays regression results. We see in column 1 that the coefficient associated with CSR is positive and statistically significant. This result reveals that target CSR is positively associated with acquisition premiums ceteris paribus. The coefficients associated with the control variables are generally in line with prior research. To complement our findings, we analyze the impact of CSR performance in each of the two underlying dimensions, i.e., environment, and social. Results are reported in columns 2 and 3, and show that, overall, environmental and social performances are positively related to bid premiums, which confirms that acquirers assign importance to targets’ CSR performance. More precisely, the regression coefficients imply that acquisition premiums are increased by 5.5, 4.5, and 4.7 percentage points for each standard deviation unit-increase in overall, environmental, and social scores, respectively.
Table 5
CSR and bid premiums
Overall (1) Environment (2) Social (3)
CSR 0.206*** 0.153*** 0.166*** Size -0.040*** -0.036*** -0.035*** MTB 0.011* 0.011* 0.010* Leverage 0.023 0.025 0.030 Growth 0.111*** 0.103** 0.104** Runup 0.288*** 0.290*** 0.288*** Liquidity 0.004 0.004 0.004 R&D -0.223 -0.207 -0.229 ROE -0.104** -0.100* -0.107** CAPEX -0.137 -0.173 -0.146 Shareholder Protection 0.041 0.048 0.046 Blockholder -0.049* -0.053* -0.047* Hostile 0.116*** 0.112*** 0.123*** Cash 0.048** 0.045** 0.051** Competing 0.075** 0.076** 0.074** Cross Border 0.049** 0.048** 0.049** Horizontal 0.008 0.003 0.011 Intercept 0.480 0.464 0.406
Time effects yes yes yes
Country effects yes yes yes
Industry effects yes yes yes
Observations 588 588 588
Prob > F 0.000 0.000 0.000
Adj-R² 0.229 0.221 0.225
This table presents the estimation of the effect of CSR on bid premiums. *, **, and *** refer to significance at the 10%, 5%, and 1% confidence levels, respectively.
10 3.2. Domestic vs. cross-border deals
Cross-border M&As entail more risk but also presume increased potential rewards, representing good opportunities to acquire new knowledge and capabilities (Shimizu et al. 2004). Moreover, cross-border deals are associated with increased shareholder gains compared with domestic acquisitions (Danbolt and Maciver, 2012), thereby justifying higher premiums. From an empirical point of view, the positive relationship between cross-border and the premium as exhibited in table 5 is in line with the findings of Rossi and Volpin (2004). Since knowledge and capabilities in acquisitions (Shimizu et al. 2004) are largely assessed by the social performance, it follows that the cross-border nature of deals may impact premiums through an interaction with CSR performance.
In order to disentangle the potential impact of the cross-border nature of acquisitions, we introduce an interaction term between CSR and the Cross Border binary variable to capture the incremental impact of CSR performance for cross-border transactions. In addition, to make sure any potential relationship between premiums and the interaction term is not driven by institutional differences, we also control for the difference in shareholder protection between the bidder and target country. Among the 588 deals in our sample, 349 are domestic transactions and 239 are deals involving bidders and targets coming from different countries. Our modified regression model is as follows: = + + + ( × ) + + + + ℎ + + + & + + + ℎ ℎ + ∆( ℎ ℎ ) , + ℎ + + ℎ + + + + + + + (2)
11 Table 6
CSR and bid premiums: domestic vs. cross-border deals
Overall (1) Environment (2) Social (3)
CSR 0.171*** 0.175*** 0.082 Cross Border 0.003 0.072* -0.063 CSR × Cross Border 0.083 -0.069 0.205*** Size -0.040*** -0.036*** -0.035*** MTB 0.012* 0.011* 0.011* Leverage 0.026 0.017 0.036 Growth 0.109*** 0.098** 0.098** Runup 0.292*** 0.288*** 0.297*** Liquidity 0.004 0.003 0.003 R&D -0.205 -0.181 -0.173 ROE -0.106** -0.100* -0.110** CAPEX -0.138 -0.175 -0.160 Shareholder Protection 0.046 0.046 0.057 ∆(Shareholder Protection)b-s -0.007 -0.008 -0.009 Blockholder -0.051* -0.053* -0.052* Hostile 0.117*** 0.116*** 0.123*** Cash 0.045* 0.042* 0.049** Competing 0.072** 0.076** 0.069** Horizontal 0.006 0.006 0.006 Intercept 0.504 0.460 0.438
Time effects yes yes Yes
Country effects yes yes Yes
Industry effects yes yes Yes
Observations 588 588 588
Prob > F 0.000 0.000 0.000
Adj-R² 0.228 0.220 0.236
This table presents the estimation of the effect of CSR on bid premiums. *, **, and *** refer to significance at the 10%, 5%, and 1% confidence levels, respectively.
Results are reported in Table 6. The direct cross-border effect itself proves to be hardly significant. Overall, CSR performance and environmental performance are positively associated with acquisition premiums. This relationship can be explained by the fact that a strong environmental performance reduces the risk of facing problems related to negative environmental spillovers (e.g., pollution-related lawsuits), therefore decreasing specific risk. A strong environmental performance also has the potential to increase a firm’s image and moral capital (Godfrey et al., 2009). Interestingly, we find that the positive incremental impact of social performance is only significant for cross-border deals. This suggests that social performance is particularly important in international transactions which are inherently more uncertain and complex. Indeed, cultural and regulation differences between targets and bidders may obscure the true value of assets to be acquired and the ability of the bidder to manage relationships with foreign stakeholders (Benou et al., 2007). Besides, Aguilera and Dencker (2004) show that human resources management play a significant role in the valuation of cross-border M&As, since they are more complex and contingent on national contexts. Indeed, as the target is
12 embedded in a different national environment, including legal, economic, institutional and cultural practices, its ability to manage human resources and its network of relationships efficiently constitutes a specific asset of particular interest to foreign acquirers. The acquirer is then presumed to acquire more knowledge and capabilities from this international expansion (Shimizu et al. 2004). It follows that acquirers may be willing to pay a premium related to social performance, including working conditions, relationships with suppliers, business partners, contractors, and communities, all of which are largely contingent upon the national context of the target.
3.3. Dealing with potential endogeneity
To make sure our CSR measure does not proxy for other unobserved variables, we estimate instrumental variable regressions. For the choice of instruments, we base our work on Ioannou and Serafeim (2012) that show that a firm’s CSR performance is impacted by a time-invariant component associated with its membership in the country-industry pair, and a time-varying component at the country level. In other words, a firm’s CSR performance is impacted by the CSR performance of other firms within the same industry-country pair, and by the CSR performance of other firms in the same country over time. We follow Cheng et al. (2014), and Arouri and Pijourlet (2017), and use the country-year mean of CSR scores and the country-industry mean of CSR scores, computed using the entire ASSET4 database. Results are reported in Table 7 for both models and show our results do not suffer from endogeneity issues9.
4. Conclusion
The results of our study reveal that M&A bidders value targets’ CSR performance positively. Interestingly, we find that the social dimension of CSR is only valued in cross-border deals, consistent with firms assigning more importance to social performance when buying foreign targets in order to mitigate the amount of additional risk and information asymmetry inherent in such transactions.
Our findings contribute to the literature by enhancing our understanding of premiums in M&A transactions in an international setting. For the acquirer, CSR performance might offer positive signals
9 For the sake of brevity, the first-stage results are not reported here but are available upon request. Both instruments are statistically
13 such as higher goodwill and lower specific risk. They also further our knowledge of the value implications of CSR for firms. Our work has managerial implications for target shareholders insofar as increasing CSR performance could increase potential takeover gains. Future research could be aimed at further disentangling the importance of CSR for acquirers by studying more precisely the sub-components of each CSR dimension and to better understand the channels through which premiums are affected.
Table 7
CSR and bid premiums using 2SLS
Model 1 Model 2
Overall
(1) Environment (2) Social (3) Overall (4) Environment (5) Social (6)
CSR 0.571*** 0.453*** 0.577*** 0.605*** 0.497*** 0.047 Cross Border 0.060*** 0.056*** 0.061*** 0.100* 0.109** -0.060 CSR × Cross Border -0.084 -0.001 0.238*** Size -0.070*** -0.063*** -0.066*** -0.070*** -0.062*** -0.066*** MTB 0.016** 0.016** 0.015** 0.016** 0.016** 0.015** Leverage -0.010 -0.008 0.001 -0.014 -0.016 0.012 Growth 0.168*** 0.151*** 0.166*** 0.166*** 0.147*** 0.161*** Runup 0.280*** 0.283*** 0.278*** 0.277*** 0.280*** 0.287*** Liquidity 0.007* 0.007 0.006 0.007 0.006 0.006 R&D -0.267 -0.224 -0.304 -0.259 -0.206 -0.255 ROE -0.111** -0.099** -0.124** -0.111** -0.099* -0.125** CAPEX 0.046 -0.041 0.086 0.044 -0.046 0.063 Shareholder Protection 0.128*** 0.115*** 0.124*** -0.006 0.010 0.009 ∆(Shareholder Protection)b-s -0.001 -0.002 -0.002 Blockholder -0.036* -0.047* -0.027* -0.035* -0.046* -0.031* Hostile 0.106*** 0.093*** 0.126*** 0.107*** 0.096** 0.124*** Cash 0.054** 0.044** 0.065** 0.053** 0.042** 0.065*** Competing 0.075** 0.078** 0.072** 0.077** 0.080** 0.067** Horizontal 0.017 0.004 0.030 0.019 0.007 0.023 Intercept 0.296 0.400 0.182 0.802** 0.776** 0.713**
Time effects yes yes yes yes yes yes
Country effects yes yes yes yes yes yes
Industry effects yes yes yes yes yes yes
Observations 588 588 588 588 588 588
Prob > Chi² 0.000 0.000 0.000 0.000 0.000 0.000
Adj-R² 0.305 0.308 0.256 0.220 0.217 0.245
This table presents the estimation of the effect of CSR on bid premiums using instrumental variables and two-stage least-square regression (only second-two-stage results are reported). *, **, and *** refer to significance at the 10%, 5%, and 1% confidence levels, respectively.
Acknowledgment
We gratefully acknowledge the financial support of the “Value & CSR” chair. The funding source had no involvement in this research. We are grateful to Douglas Cumming (the editor), and two anonymous referees for their constructive comments. We also thank Pr. Mohamed Arouri for his helpful suggestions. The ideas, methodology, and findings expressed in this paper remain our sole responsibility.
14 Appendix A. Description of ASSET4 categories (from ASSET4 documents)
Environmental component
Emission reduction: The emission reduction category measures a company's management commitment and effectiveness towards reducing environmental emission in the production and operational processes. It reflects a company's capacity to reduce air emissions, waste, hazardous waste, water discharges, spills or its impacts on biodiversity and to partner with environmental organizations to reduce the environmental impact of the company in the local or broader community.
Product innovation: The product innovation category measures a company's management commitment and effectiveness towards supporting the research and development of eco-efficient products or services. It reflects a company's capacity to reduce the environmental costs and burdens for its customers, and thereby creating new market opportunities through new environmental technologies and processes or eco-designed, dematerialized products with extended durability.
Resource reduction: The resource reduction category measures a company's management commitment and effectiveness towards achieving an efficient use of natural resources in the production process. It reflects a company's capacity to reduce the use of materials, energy or water, and to find more eco-efficient solutions by improving supply chain management.
Social component
Customer/Product Responsibility: The customer/product responsibility category measures a company's management commitment and effectiveness towards creating value-added products and services upholding the customer's security. It reflects a company's capacity to maintain its license to operate by producing quality goods and services integrating the customer's health and safety, and preserving its integrity and privacy also through accurate product information and labelling.
Society/Community: The society/community category measures a company's management commitment and effectiveness towards maintaining the company's reputation within the general community (local, national and global). It reflects a company's capacity to maintain its license to operate by being a good citizen (donations of cash, goods or staff time, etc.), protecting public health (avoidance of industrial accidents, etc.) and respecting business ethics (avoiding bribery and corruption, etc.).
Society/Human Rights: The society/human rights category measures a company's management commitment and effectiveness towards respecting the fundamental human rights conventions. It reflects a company's capacity to maintain its license to operate by guaranteeing the freedom of association and excluding child, forced or compulsory labor.
Workforce/Diversity and Opportunity: The workforce/diversity and opportunity category measures a company's management commitment and effectiveness towards maintaining diversity and equal opportunities in its workforce. It reflects a company's capacity to increase its workforce loyalty and productivity by promoting an effective life-work balance, a family friendly environment and equal opportunities regardless of gender, age, ethnicity, religion or sexual orientation.
Workforce/Employment Quality: The workforce/employment quality category measures a company's management commitment and effectiveness towards providing high-quality employment benefits and job conditions. It reflects a company's capacity to increase its workforce loyalty and productivity by distributing rewarding and fair employment benefits, and by focusing on long-term employment growth and stability by promoting from within, avoiding lay-offs and maintaining relations with trade unions.
Workforce/Health and Safety: The workforce/health and safety category measures a company's management commitment and effectiveness towards providing a healthy and safe workplace. It reflects a company's capacity to increase its workforce loyalty and productivity by integrating into its day-to-day operations a concern for the physical and mental health, well-being and stress level of all employees.
Workforce /Training and Development: The workforce/training and development category measures a company's management commitment and effectiveness towards providing training and development (education) for its workforce. It reflects a company's capacity to increase its intellectual capital, workforce loyalty and productivity by developing the workforce's skills, competences, employability and careers in an entrepreneurial environment.
15 Appendix B. Description of control variables
Table B1
Variable Rationale Expected sign
Size Larger targets are associated with higher integration costs (Comment and
Schwert, 1995) and should therefore be associated with lower premiums. - MTB A negative relation should be anticipated between the market-to-book ratio
and the premium if a low ratio illustrates the undervaluation of the target, whereas a positive relation between the market-to-book ratio and the premium should be seen if a low ratio signals restricted investment opportunities (Dionne et al., 2015).
+/-
Leverage A target that has considerable debt is less attractive, and the premium paid
to obtain it should be lower (Dionne et al., 2015). -
Growth Buyers may be interested in targets that perform poorly because of the gains that could be realized if the current managers were replaced. In this case, the relation between the performance of the target and the premium should be negative. However, poor performance is often associated with fragile financial health and is therefore likely to hinder the target’s ability to negotiate. In this case, the relation between performance and the premium should be positive (Dionne et al., 2015).
+/-
Runup The higher the runup, the higher should the premium paid to acquire the target be (Betton et al., 2009), in line with the markup price effect identified by Schwert (1996).
+ Liquidity Liquidity gives information about the target’s financial position and could
therefore affect premiums (Ayers et al., 2003). +/-
R&D Target’s R&D activities can yield important synergistic resources offering private benefits, and could be expected to be positively related to premiums (Laamanen, 2007).
+ ROE Bidders could be expected to offer higher premiums for high-earning
firms. However, strong earnings could also reduce potential gains insofar as takeover gains can come from the replacement of inefficient management. This, in turn, would point toward a negative association between ROE and premiums.
+/-
CAPEX The intensity of capital expenditures can be expected to impact potential
takeover synergies. +/-
Shareholder
Protection Premiums are expected to be higher in countries with stronger shareholder protection because 1) shareholder protection reduces the cost of capital and therefore increases (potential) competition among bidders and the premium paid by the winning bidder, and 2) diffuse ownership is more common in countries with higher shareholder protection, which forces bidders to pay a higher takeover premiums than otherwise (Rossi and Volpin, 2004).
+
Blockholder This variable measures the effect of information asymmetry (Dionne et al.,
2015) and bidder’s bargaining power (Ayers et al., 2003). -
Hostile Hostile transactions usually command a higher premium (Ayers et al.,
2003; Dionne et al., 2015). +
Cash A wholly cash payment, which implies a prominent tax effect, should
increase the premium significantly (Comment and Schwert, 1995). +
Competing The presence of more than one potential buyer creates competition that could increase the premium that the target could obtain from the buyer (Ayers et al., 2003; Dionne et al., 2015).
+ Cross Border Cross-border deals embed greater information asymmetry and a higher risk
of improper evaluation compared with domestic operations (Gatignon and Anderson, 1988).
+/- Horizontal The horizontal/vertical nature of deals can be expected to impact
bargaining power and potential takeover synergies. +/-
This table reports the rationale underlying the choice of control variables used in our multivariate regressions as well as the sign of their predicted relationship with acquisition premiums.
16 References
Aguilera, R.V., Dencker, J.C., 2004, The role of human resource management in cross-border mergers and acquisitions. The International Journal of Human Resource Management, 15(8), 1355-70.
Aktas, N., De Bodt, E., Cousin, J.G., 2011. Do financial markets care about SRI? Evidence from mergers and acquisitions. Journal of Banking & Finance, 35(7), 1753-1761.
Aouadi, A., Marsat, S., 2016. Do ESG controversies matter for firm value? Evidence from international data. Journal of Business Ethics, Forthcoming, 1-21. doi: 10.1007/s10551-016-3213-8
Arouri, M., Pijourlet, G., 2017. CSR performance and the value of cash holdings: International evidence. Journal of Business Ethics, 140(2), 263-284.
Ayers, B.C., Lefanowicz, C.E., Robinson, J.R., 2003. Shareholder taxes in acquisition premiums: The effect of capital gains taxation. The Journal of Finance 58(6), 2783-2801.
Benou, G., Gleason, K.C., Madura, J., 2007. Impact of visibility and investment advisor credibility on the valuation effects of high‐tech cross‐border acquisitions. Financial Management, 36(1), 69-89.
Betton, S., Eckbo, B.E., Thorburn, K.S., 2008. Corporate takeovers. Handbook of corporate finance: Empirical corporate finance 2, 291-430.
Betton, S., Eckbo B.E., Thorburn, K.S., 2009. Markup pricing revisited. Working paper, Concordia University. Branco, M.C., Rodrigues, L.L., 2006. Corporate social responsibility and resource-based perspectives. Journal of Business Ethics, 69(2), 111-132.
Chen, E., Gavious, I., 2015. Does CSR have different value implications for different shareholders? Finance Research Letters 14, 29-35.
Cheng, B., Ioannou, I., Serafeim, G., 2014. Corporate social responsibility and access to finance. Strategic Management Journal, 35(1), 1-23.
Cho, H., Ahn, H.S., 2017. Stock payment and the effects of institutional and cultural differences: A study of shareholder value creation in cross-border M&As. International Business Review 26, 461-475.
Comment, R., Schwert, G.W. 1995. Poison or placebo? Evidence on the deterrence and wealth effects of modern antitakeover measure. Journal of Financial Economics 39, 3-43.
Cumming, D.J., Ji, S., Johan, S., Tarsalewska, M., 2016. Market Manipulation and M&As. Available at SSRN: https://ssrn.com/abstract=2757907
Dionne, G., La Haye, M., Bergerès, A.S., 2015. Does asymmetric information affect the premium in mergers and acquisitions?. Canadian Journal of Economics 48(3), 819-852.
Fama, E.F., Jensen, M.C., 1983. Separation of ownership and control. Journal of Law and Economics 26, 301-325.
Friedman, M., 1970. The social responsibility of business is to increase its profits. The New York Times Magazine, 13-Sep-1970, 32-33.
Gatignon, H., Anderson, A., 1988. The multinational corporation’s degree of control over foreign subsidiaries: An empirical test of a transaction cost explanation. Journal of Law, Economics, and Organization 4(2), 305-336. Godfrey, P.C., Merrill, C.B., Hansen, J.M., 2009. The relationship between corporate social responsibility and shareholder value: An empirical test of the risk management hypothesis. Strategic Management Journal 30(4), 425-445.
Gregory, A., Tharyan, R., Whittaker, J., 2014. Corporate social responsibility and firm value: Disaggregating the effects on cash flow, risk and growth. Journal of Business Ethics, 124(4), 633-657.
Ioannou, I., Serafeim, G., 2012. What drives corporate social performance? The role of nation-level institutions. Journal of International Business Studies, 43(9), 834-864.
Laamanen, T., 2007. On the role of acquisition premium in acquisition research. Strategic Management Journal, 28(13), 1359-1369.
Lys, T., Naughton, J. P., Wang, C., 2015. Signaling through corporate accountability reporting. Journal of Accounting and Economics, 60(1), 56-72.
Porter, M.E., Kramer, M.R. 2006. The link between competitive advantage and corporate social responsibility. Harvard Business Review, 12, 78-92.
Rossi, S., Volpin, P.F., 2004. Cross-country determinants of mergers and acquisitions. Journal of Financial Economics, 74(2), 277-304.
Servaes, H., Tamayo, A., 2013. The impact of corporate social responsibility on firm value: The role of customer awareness. Management Science, 59(5), 1045-1061.
Schwert, G.W., 1996. Markup pricing in mergers and acquisitions. Journal of Financial Economics 41(2), 153– 192.
Shimizu, K., Hitt, M.A., Vaidyanath, D., Pisano, V., 2004. Theoretical foundations of cross-border mergers and acquisitions: A review of current research and recommendations for the future. Journal of International Management, 10(3), 307-53.
17
Simonyan, K., 2014. What determines takeover premia: An empirical analysis. Journal of Economics and Business, 75, 93-125.