Data-Driven Flight Procedure Simulation and Noise
Analysis in a Large-Scale Air Transportation System
by
Luke L. Jensen
B. S., University of Washington (2011) S.M., Massachusetts Institute of Technology (2014) Submitted to the Department of Aeronautics & Astronautics in
Partial Fulfillment of the Requirements for the Degree of
Doctor of Philosophy in Aeronautics & Astronautics
at the
Massachusetts Institute of Technology
June 2018
Massachusetts Institute of Technology 2018. All rights reserved.
Signature redacted
Department of Aer'nautics & Astronautics May 24, 2018
Signature
Certified by:
Certified by:
redacted
Prof. R. John Hans tmn Professor of Aeronautics & Astronautics, MIT Thesis Supervisor
Signature redacted
Prof. Warre Hob rg Visiting Professor of Aeronautics & AstronautiN4IT
Signature redacted
Certified by:
Dr. Brian Yutko Vice President of Research & Development, Aurora Flight Sciences
MASSACHUSETTS INSTITUTE
MASSACHUSETTS INSTITUTE OF TECHNOLOGY
JUN
2
8 2018
Signature redacted
Prof. Hamsa Balakrishnan Associate Professor of Aeronautics & Astronautics, MIT Chair, Graduate Program Committee Author:
Accepted by:
---Data-Driven Flight Procedure Simulation and Noise
Analysis in a Large-Scale Air Transportation System
by Luke L. Jensen
Submitted to the Department of Aeronautics & Astronautics
on May 25, 2018 in partial fulfillment of the requirements for the degree of Doctor of Philosophy in Aeronautics & Astronautics
Abstract
Aircraft noise is a growing source of community concern around airports. Despite the introduction of quieter aircraft, increased precision of onboard guidance systems has resulted in new noise impacts driven by overflight frequency effects. Noise issues present a potential barrier to the continued rollout of advanced operational procedures in the US. This thesis presents a data-driven approach to simulating and communicating noise effects in the flight procedure development and modernization process, with input from multiple stakeholders with varying objectives that are technical, operational, and political in nature.
First, a system-level framework is introduced for developing novel noise-reducing arrival and departure flight procedures, clarifying the role of the analyst given diverse stakeholder objectives. The framework includes relationships between baseline impact assessment, community negotiation, iterative flight procedure development, and formal implementation processes. Variability in stakeholder objectives suggests a need to incorporate noise issues in conjunction with other key operational objectives as part of larger-scale US air transportation system modernization.
As part of this framework development, an airport-level noise modeling method is developed to enable rapid exposure and impact analysis for system-level evaluation of advanced operational procedures. The modeling method and framework are demonstrated by evaluating potential benefits of specific advanced procedures at 35 major airports in the US National Airspace System, including Performance Based Navigation guidance and a speed-managed departure concept.
Thesis Supervisor: R. John Hansman
Table of Contents
Chapter 1. M otivation and Objectives ... 17
1.1 Problem Introduction...17
1.2 PBN Track Concentration...19
1.3 Sociotechnical System Fram ework for Procedure Developm ent... 22
1.4 System Noise Benefits of Specific Operational Procedures...24
1 .5 T h esis O u tlin e ... 2 5 Chapter 2. Literature Review and Background on Aircraft Noise... 27
2.1 Physics of Aircraft Noise ... 27
2.2 Effects of Aircraft Noise...31
2.3 Noise Reduction Literature Review ... 38
2.4 M odeling Aircraft Noise ... 40
2 .5 N o ise M etrics ... 4 5 2.6 Noise M anagem ent Objectives... 50
2.7 Environm ental Regulations...53
2.8 Capturing Annoyance from Overflight Frequency ... 55
2.9 M ulti-Stakeholder System Modeling Literature Review ... 59
2.10 Change Propagation in Air Transportation System s... 61
Chapter 3. Noise Analysis M ethods... 63
3.1 Fleet Developm ent...64
3.2 Procedure Developm ent...66
3.3 Aircraft Perform ance M odels ... 68
3.4 Detailed Trajectory Generation... 70
3.5 Noise M odeling...71
3.6 Flight-Level Schedule Development... 77
3.7 Calculating Integrated Impacts ... 80
3.8 Population Im pact M odeling ... 80
3.9 Noise Im pact Reporting and Visualization... 84
Chapter 4. Characteristics and Constraints for RNAV and RNP Approaches... 87
4.1 RNAV Approach Design Param eters and Criteria... 88
4.2 RNP Approach Design Param eters and Criteria... 98
4.3 Im plications of RNAV and RNP Approach Design Param eters ... 101
4.4 RNAV and RNP Characteristics for Existing Procedures...103
4.5 RNAV Visual Flight Procedures ... 108
4.6 Nonstandard Instrum ent Flight Procedures and W aivers...110
Chapter 5. System Noise Reduction Potential of RNAV and RNP Approaches ... 111
5.1 Track Generation Method ... 111
5.3 Population Exposure Calculation ... 116
5.4 Average Hourly and Daily Schedule Generation ... 118
5.5 RNAV Procedures with Vertical Guidance...119
5.6 RNAV Procedures without Vertical Guidance...129
5 .7 R N P P ro ced u res...1 34 5.8 Comparison of PBN Approach Guidance Methods for Noise Reduction...140
5.9 Evaluating System-Level Population Exposure Rollup...146
5.10 Approach to Tradeoff Evaluation in Procedure Selection...149
Chapter 6. System Noise Reduction Potential for Reduced Speed Departures...159
6.1 Technical Basis for Reduced Speed Departures ... 159
6.2 Speed Limitations for Existing Departure Procedures ... 162
6.3 Noise Modeling Approach for Reduced Speed Departures...164
6.4 System Noise Reduction Analysis for Reduced Speed Departures...168
Chapter 7. Framework for Noise-Reduction Procedure Development...173
7.1 System Dynamic Model for Noise-Motivated Procedure Development...174
7 .2 B a selin e C o n d itio n s...1 7 6 7.3 Procedure Change Process ... 178
7.4 Im p lem entation P rocess ... 184
7.5 Case Study at Boston Logan Airport...188
Chapter 8. Conclusion...205
8.1 Thesis Framework and Analysis Results Summary...205
8 .2 K ey O u tco m es ... 2 0 7 8.3 Research Recommendations and Future Work...208
Appendix A OEP-35 Airports...213
Appendix B Full RNAV and RNP Approaches: Population Exposure Results...215
Appendix C Reduced Speed Departures: Population Exposure Results ... 221 R eferen ces ... 22 7
Table of Figures
Figure 1. Aircraft fight tracks for operations at BOS before (2010) and after (2015) RNAV implementation (Source: Massport Noise and Operations Management System)20 Figure 2. 65 dB DNL contour vs. noise complaint locations (red circles)...21 Figure 3. Sociotechnical system framework for flight procedure development...24 Figure 4. Sound pressure level time history at a single observer location illustrating LMAx and SEL
m e tric s ... 3 2 Figure 5. Noise stage levels and certification values for common turbojet aircraft types as a
function of certification year (Source: FAA [26])... 33 Figure 6. Schultz Curve relating A-weighted DNL to community annoyance [19]...34 Figure 7. A-weighting filter function for determining equivalent instantaneous loudness within
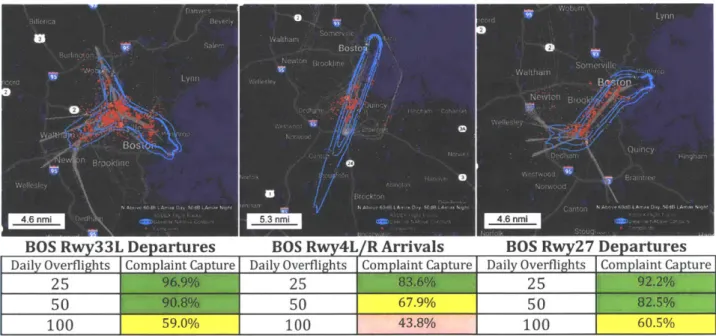
the frequency range of hum an hearing... 47 Figure 8. BOS 33L departures complainant coverage for all scenarios by DNL contour level
S o u rce : B ren n er 2 0 1 7 ... 5 7 Figure 9. BOS 33L departures complainant coverage for peak day by NABOVE thresholds Source:
B re n n e r 2 0 1 7 ... 5 7 Figure 10. Complaints captured by peak-day NABOVE contours at BOS (60dB day, 50dB night)58 Figure 11. Multi-stakeholder system transformation model developed by O'Neill [108]...60 Figure 12. System dynamic transition model developed by Mozdzanowska [116]...61 Figure 13. Noise analysis flowchart for single-event and cumulative impact evaluation of new
p ro ce d u res ... 6 3 Figure 14. Top 40 aircraft types by movement count at the OEP-35 airports in 2017...65 Figure 15. CIFP translation to trajectory centerline for noise analysis ... 68 Figure 16. Force-balance approach used to calculate thrust and drag for profile definitions [124]
... 7 0 Figure 17. 60dB LMAX contour for a Boeing 737-800 on a straight-in final approach segment with
resulting contour half-width function shown in black... 73 Figure 18. Contour generated by applying the half-width functions orthogonal to an RNAV
p ro ced u re cen terline ... 7 4 Figure 19. Contours generated directly by AEDT for a Boeing 737-800 on a standard arrival
profile with a turn of 00, 300, or 600 on the final approach segment...75 Figure 20. Contour half-width functions at the turn location based on contours from AEDT for a
Boeing 737-800 on a standard arrival profile with a turn of 0', 300, or 600 on the final ap p ro a ch seg m en t...7 5 Figure 21. Full contour comparison between AEDT output and rapid contour generation method
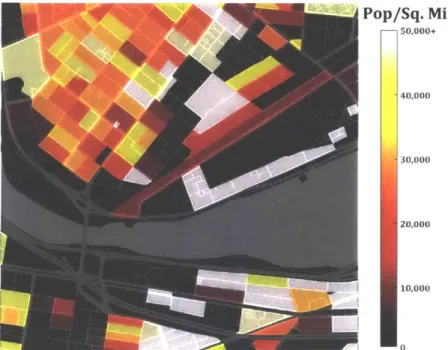
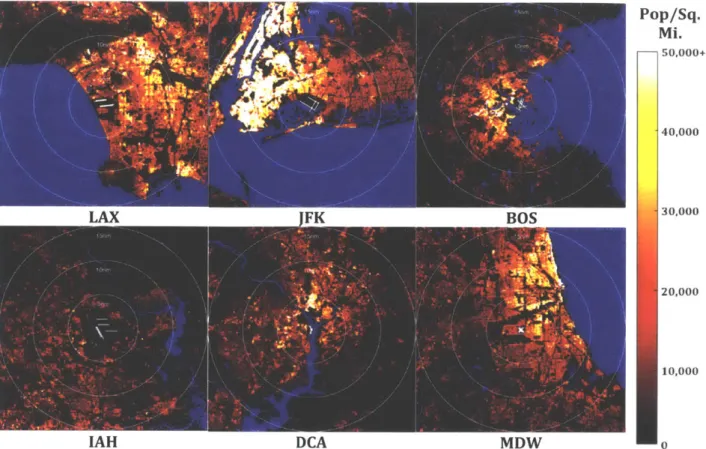
for a 737-800 approach procedure to Runway 4R at BOS containing a 60' turn76 Figure 22. Representative census blocks and population counts with calculated areas...81 Figure 23. 2010 US Census block-level absolute population counts converted to geospatial
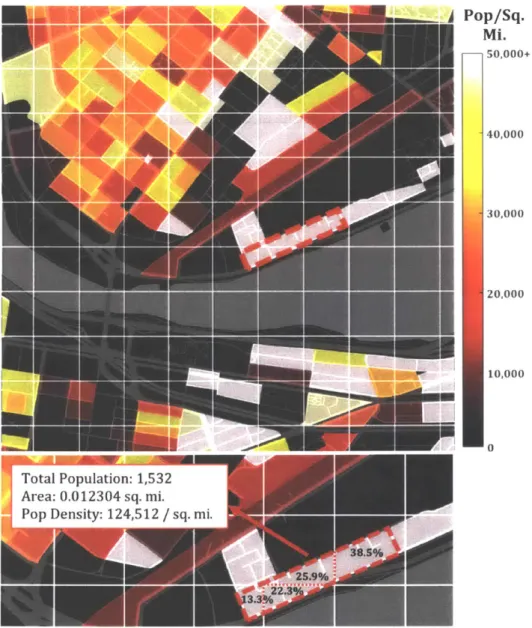
p o p u latio n d en sity ... 8 1 Figure 24. Demonstration of area-based census data redistribution method for gridded
p o p u latio n calcu latio n ... 8 2 Figure 25. Re-Gridded 2010 Block-Level US Census Population Data ... 83 Figure 26. Re-gridded population data for six examples from the OEP-35 airports...84
Figure 27. Conceptual difference between conventional navigation, RNAV, and RNP...87 Figure 28. Flyby vs. flyover w aypoints ... 88 Figure 29. Profile view for RNP Runway 19 approach at DCA with variable minimums depending
on RNP level on the final approach segm ent... 89 Figure 30. Illustration of minimum segment length between two fly-by RNAV waypoints ... 93 Figure 31. 2-segment RNAV approach segment with 450 total heading change distributed
betw een final turn and interm ediate turn ... 94 Figure 32. Required Obstacle Clearance for initial and intermediate straight RNAV approach
segm ents connecting fly-by w aypoints... 95 Figure 33. Obstacle clearance surface for vertically-guided RNAV final approach segments96 Figure 34. Schematic of final approach segment geometry for RNAV procedures...98 Figure 35. Intermediate and final approach geometry for RNAV and RNP procedures...104 Figure 36. Example published RNAV (left) and RNP (right) instrument approach procedures with
w aypoint geom etry near criteria lim its...107
Figure 37. Example of a charted visual procedure and RNAV Visual serving the same runway109 Figure 38. Assumed as-flown turn anticipation geometry for FB waypoints...113 Figure 39. Example lateral tracks for RNAV (a) and RNP (b) arrival procedures...114 Figure 40. Radar-based median arrival profile for a B737-800 (a) and resulting thrust profile
calculated usin g BA D A -4 (b) ... 1 15 Figure 41. Approach LMAX contour widths for 7 fleet types following radar median approach
p ro file s ... 1 1 6 Figure 42. Illustration of population grid rotation at LGA airport showing the baseline
north-oriented airport layout, a generic noise contour, and runway-aligned population grids ... 1 1 7 Figure 43. Noise-minimal RNAV approach with vertical guidance for LAX runway 25L (B737-800
6 0 d B Lm A x) ... 1 2 0 Figure 44. Noise-minimal RNAV approach with vertical guidance for BOS runway 33L (B737-800
6 0 d B Lm x) ... 1 2 0 Figure 45. Noise-minimal RNAV approach with vertical guidance for ORD runway 10L (B737-800
5 0 d B L A x) ... 1 2 1 Figure 46. Threshold Sensitivity of Noise-Minimal RNAV Approach with Vertical Guidance for
KBWI Runway 33R (B737-800 50dB vs. 60dB LMAX)...123
Figure 47. Threshold Sensitivity of Noise-Minimal RNAV Approach with Vertical Guidance for KBWI Runway 10 (B737-800 50dB vs. 60dB LMAx)...123
Figure 48. 2017 Daytime 60dB LMAx noise reduction potential from RNAV procedures with vertical guidance for all OEP-35 runw ays...125
Figure 49. 2017 Nighttime 50dB LMAx noise reduction potential from RNAV procedures with vertical guidance for all OEP-35 runw ays...127
Figure 50. Comparison between noise-minimal RNAV approach with and without vertical gu idan ce at LG A runw ay 4 ... 130 Figure 51. 2017 Daytime 60dB LMAx noise reduction potential from RNAV procedures without
vertical guidance for all OEP-35 runw ays...131
Figure 52. 2017 Nighttime 50dB LmAx noise reduction potential from RNAV procedures without vertical guidance for all OEP-35 runw ays...131
Figure 53. ORD Runway 28C noise-minimal RNP procedure relative to a straight-in baseline (B oeing 737-800, 60dB LMAX)...135
Figure 54. DCA runway 19 noise-minimal RNP procedure relative to a straight-in baseline (Boeing 737-800, 60dB LMAX) compared with published RNAV (RNP) to the same ru n w a y ... 1 3 5 Figure 55. 2017 Daytime 60dB LMAx noise reduction potential from RNP procedures for all
OEP-3 5 ru n w ay s ... 1 3 7 Figure 56. 2017 Nighttime 50dB LMAx noise reduction potential from RNP procedures for all
OEP-3 5 ru n w a y s ... 1 3 7 Figure 57. Population exposure reduction (B737-800, 60dB LMAx) for PBN procedures at the
highest-benefit 75 runw ays in the OEP-35...142
Figure 58. JFK runway 13R noise-minimal procedure centerlines for RNAV with and without vertical guidance and RNP relative to a straight-in baseline (Boeing 737-800, 60dB L M A X) ... 1 4 3 Figure 59. JFK runway 13L noise-minimal procedure centerlines for RNAV with and without
vertical guidance and RNP relative to a straight-in baseline (Boeing 737-800, 60dB L M A X) ... 1 4 3
Figure 60. MSP runway 35 noise-minimal procedure centerlines for RNAV with and without vertical guidance and RNP relative to a straight-in baseline (Boeing 737-800, 60dB
L M A X) ... 1 4 4 Figure 61. SEA runway 34L noise-minimal procedure centerlines for RNAV with and without
vertical guidance and RNP relative to a straight-in baseline (Boeing 737-800, 60dB L M A X) ... 1 4 4
Figure 62. TPA runway 19L noise-minimal procedure centerlines for RNAV with and without vertical guidance and RNP relative to a straight-in baseline (Boeing 737-800, 60dB L M A X) ... 1 4 5
Figure 63. LGA runway 4 noise-minimal procedure centerlines for RNAV with and without vertical guidance and RNP relative to a straight-in baseline (Boeing 737-800, 60dB
L M A X) ... 1 4 5 Figure 64. System-level change in Person-Event Impact from implementing noise-preferred PBN
procedures for every jet arrival at the OEP-35 airports in 2017...147 Figure 65. Airport-level change in PEI from implementing noise-preferred PBN procedures for
every jet arrival at the OEP-35 airports in 2017...148
Figure 66. Impact of maximizing net population reduction vs. benefit leverage ratio using RNAV procedures with vertical guidance for MSP runway 30R...150 Figure 67. Pareto set for the objectives of net population reduction and benefit leverage ratio for
RNAV approaches with vertical guidance for MSP Runway 30R ... 151 Figure 68. Map view of set for the objectives of net population reduction and benefit leverage
ratio for RNAV approaches with vertical guidance for MSP runway 30R...152 Figure 69. Pareto set for the objectives of net population reduction and benefit leverage ratio for
RNAV approaches with vertical guidance for IAD runway 1L...153 Figure 70. Map view of population and benefit leverage-preferred RNAV procedure at IAD
ru n w a y 1 L ... 1 5 3 Figure 71. Subset of RNAV procedure designs showing notional track length implications for
Figure 72. Pareto set trading net population reduction (60dB LMAx) and track length reduction for RNAV approaches with vertical guidance for MSP Runway 30R (west arrivals)156 Figure 73. Pareto set tracks for RNAV approaches with vertical guidance for MSP Runway 30R
trading net population reduction (60dB LMAx) and track length reduction (west a rriv a ls) ... 1 5 6 Figure 74. Pareto set trading net population reduction (60dB LMAx) and track length reduction for
RNAV approaches with vertical guidance for MSP Runway 30R (east arrivals)157 Figure 75. Pareto set tracks for RNAV approaches with vertical guidance for MSP Runway 30R
trading net population reduction (60dB LMAx) and track length reduction (east a rriv a ls) ... 1 5 8
Figure 76. Standard jet departure profile...160
Figure 77. LMAx noise contours for a 737-800 departure with target climb speeds varying from 160 kn ots to 2 50 kn ots...16 1 Figure 78. Speed constraint notations on Las Vegas STAAV Eight RNAV SID...164
Figure 79. Reduced speed departure profile for the Embraer 170 with speed target of 220 Knots In d icated A irsp eed ... 1 6 5 Figure 80. Reduced speed departure profile for the Boeing 737-800 with speed target of 220 K n ots In d icated A irsp eed ... 166
Figure 81. Reduced speed departure profile for the Boeing 777-300 with speed target of 240 K n ots In d icated A irsp eed ... 166
Figure 82. 60dB LMAx contour half-widths for reduced speed departures...167
Figure 83. 70dB LMAx contour half-widths for reduced speed departures...168
Figure 84. GLDMN Five RNAV SID from Runway 13 at LGA...169
Figure 85. B737-800 noise benefits from a reduced-speed departure on the GLDMN Five RNAV SID from LGA runw ay 13 (60dB LMAX)...169
Figure 86. B737-800 noise benefits from a reduced-speed departure on the PORTT4 RNAV SID from EWR runway 22R, ELIOT Transition (60dB LmAx)...171
Figure 87. B737-800 noise benefits from a reduced-speed departure on the PATSS5 RNAV SID from BO S runw ay 33L (60dB LMAX)...171
Figure 88. B737-800 60dB LMAx noise reduction potential from reduced speed departures as a function of average 2017 daytime jet departure frequency from the associated ru n w a y ... 1 7 2 Figure 89. System dynamic model for noise-motivated procedure development...175
Figure 90. NEPA environm ental review process...185
Figure 91. Summary of FAA JO 7100.41A: PBN Implementation Process...187
Figure 92. Comparison between flight track density from BOS Runway 33L jet arrivals between 2010 and 2015 (Source: HM M H via [141]) ... 191
Figure 93. jetBlue RNAV Visual approach procedure to Runway 33L (blue) compared with an example RNAV draft nonprecision instrument approach procedure...193
Figure 94. Noise exposure reduction for the Boeing 737-800 arriving Runway 33L descending via procedure recommendation 1-Ala on 3' descent profile ... 195
Figure 95. Comparison between flight track density from BOS Runway 33L jet departures between 2010 and 2015 (Source: HMMH via [141]) ... 197
Figure 96. Comparison between flight track density from BOS Runway 27 jet departures between 2010 and 2015 (Source: HM M H via [141]) ... 198 Figure 97. Noise exposure reduction for the Boeing 737-800 departing runway 33L via the
BLZZR4 departure on a standard climb profile compared to a 220-knot reduced speed departure. N oise M odel: NASA A N OPP...200
Figure 98. Noise exposure reduction for the Boeing 777-300 departing runway 33L via the BLZZR4 departure on a standard climb profile compared to a 240-knot reduced speed departure. Noise M odel: NASA A N OPP...201
Figure 99. Noise exposure reduction for the Embraer E-170 departing runway 33L via the BLZZR4 departure on a standard climb profile compared to a 220-knot reduced speed departure. N oise M odel: NA SA A N OPP...201
Figure 100. Noise exposure reduction for the Boeing 737-800 departing runway 27 via the BLZZR4 departure on a standard climb profile compared to a 220-knot reduced speed departure. N oise M odel: NASA A N OPP...202
Figure 101. Unconstrained best-case cumulative person-event impact benefit for PBN guidance technologies at the OEP-35 airports with a notional comparison to RNAV Visual p ro ce d u re s ... 2 0 6 Figure 102. M ap Depiction of OEP-35 A irports...214
List of Acronyms and Abbreviations
Term Definition
AAO
Adverse
Af
cle
AEDT Aviation Environmental Design Tool
AEP Airport Environment Program
AGL Above Ground Level
ASDE-X Airport Surface Detection Equipment Model X ASPM Aviation System Performance Metrics
ATC Air Traffic Control
BADA
Base of Aircraft Data
Baro-VNAV Barometic Vertical Navigation
BOS
Boston Lo n Airport
BWI Baltimore Washington International Airport
CATEX Categorical Exclusion
CEQ
Council on Environmental uality
CJFP Coded Instr en Flight PdBA
A-weighted Decibels
DCA
Washington National Airport
DLR
German Aerospace Center
DNL
Day-Ni ht.Average Level
DTA
Distance of Turn Anticipation
EA
Environmental Assessment
EIS
Environmental Impact Statement
E JEnvironmental
Justice
FAA
Federal Aviation Administration
FAA/AFS
FAAElight Sta
ce Bra: h
FMS
Flight Management System
FONSI
Finding of No Signifiant Impact
FROP
Final Roll-Out Point
Groundj3M:AuUmen
GLS
GBAS Landing System
GPA
Glide Path Angle
GPS
Global Positioning System
IAF
Initial Approach Fix
IAP
Instrument Aproach Procedure
WAO
!4tion
IF
Intermediate Fix
ILS
Instrument Landing System
INM
Integrated Noise Model
IW
York-KIAS
Knots Indiated Airspeed
Term Definition
LAX Los Angeles International Airport LGA New York La Guardia Airport LMAX Maximum Sound Pressure Level
LNAV Lateral Navi ation
LOA Letter of Agreement
LPV Lo daizer Performance with
v?
nceMAGENTA Model for Assessing Global Exposure to the Noise of Transport Aircraft MAP Missed Approach Point
Massport Massachusetts Port Authority MCA Multiple Criteria Analysis
MSP Minnea>olis -St. Paul Air ort
NADP Noise Abatement Departure Procedure
NAS National Airspace System
NASA National Aeronautics and Space Administration
NCP Noise Compatibilityf ,gram
NDI Noise Depreciation Index
NEPA National Environmental Policy Act
NextGen FAA Next Generation Air Transportation System
NIRS Noise Integrated Routing System
NPD Noise-Power-Distance
CS Obs 1e-Clearance Surface ODP Obstacle Departure Procedure
OEP-35 Operational Evolution Partnership 35 airports ORD Chicago O'Hare Airport
PANX
Parametric Aircrafi NPBN Performance-Based Navigation
PEI Person-Event Impact
PFAF Precision Final Approach Fix
PNL Perceived Noise Level
RF Radius-to-Fix Leg Type
RNAV Area Navigation
RNP Required Navigation Performance RNP-AR RNP with Authorization Required ROC Required Obstacle Clearance
Record, on
RVFP RNAV Visual Flight Procedure
SEA Seattle-Tacoma International Airport
SEL Sound Exposure Level
SID Standard Instrument DeI
>e
SOP Standard Operating ProcedureSPL Sound Pressure Level
STAR Standard Terminal Arrival Route TASOPT Transport Aircraft System Optimization
Term Definition
TF Track-to-Fix Leg Type
TPA Tampa International Airport
VDA
Vu'a1 Descent
Aogle-VEB Vertical Error Budget
VNAV Vertical Navigation
VOR VHF Omnidirectional Range
Fpproach
Reference Speed
AQ
'-WAAS Wide-Area Augmentation System
Chapter 1. Motivation and Objectives
1.1
Problem Introduction
This thesis describes a system-level framework for developing new arrival and departure flight procedures, evaluating noise, and communicating impacts to communities and other stakeholders. Noise impacts are one of several key sociotechnical factors driving change in the modern air transportation system. A diverse set of stakeholder objectives and feedback mechanisms guide the system dynamic process of procedure inception, development, and implementation. The continued rollout of advanced satellite-based navigation and guidance technologies requires systematic integration of feedback from communities as well as operational stakeholders, considering the full diversity of objectives and stakeholder inputs. The methodological and analytical framework introduced in this thesis is applied to an example system-level best-case benefits analysis of modern satellite-based navigation procedures and reduced speed departure procedures.
Aircraft noise is an increasingly common source of community concern with respect to air transportation activity. The role of noise assessment in traditional procedure design incorporates community feedback in a manner that misses key elements driving complaints, often resulting in strained relations between airports and surrounding populations. While it is well understood that noise generation and propagation to the surface is an unavoidable consequence of aviation activity, operational and technological modifications can be used to reduce impact. Despite a reduction in single-event aircraft noise over time[1], changes in flight volume, procedure design, flight patterns, and community expectations have resulted in an increase in complaints.
Arrival and departure procedure modification for community noise reduction is complicated due to variable stakeholder priorities and complex technical constraints. Flexibility in aircraft flight tracks is limited by aircraft performance, navigation technology, traffic separation requirements, airspace capacity, and regulatory considerations. Furthermore, the success criteria for a procedure modification may be different for various communities surrounding an airport. A beneficial change
for one neighborhood may correspond to a detrimental noise increase for another. Stakeholder incentives are variable both across broad groups (airline incentive structures differ from surrounding communities and airports) as well as within groups (individual communities may favor solutions not in the best interest of other populations).
Operating under the assumption that airports provide valuable connectivity that drives economic activity on a regional and global level, it is important to preserve passenger and cargo throughput as part of any noise solution. All flights must take off and land from a limited set of runways at an airport, placing a constraint on where flights may be distributed in the immediate vicinity of the airport. Community expectations with respect to quality of life may not include personal evaluation of benefits from air transport. For example, an individual may rely on an early-morning flight to reach an important meeting one early-morning, only to be awakened by the same flight departing overhead the following morning. Despite the personal benefit arising from airport activity, being awakened by aircraft noise may generate a strong sense of annoyance nonetheless. While not all people impacted by noise utilize air transportation directly, most benefit from economic activity induced by thriving air transportation. It is important to explore opportunities to reduce annoyance from aircraft noise while simultaneously acknowledging the economic importance of airport activity.
In typical procedure redesign processes, community stakeholders have high-level noise reduction objectives and procedure modification concepts that do not account for complex technical constraints and opportunities. Analysts and regulators in the procedure development process may not be positioned to communicate these constraints and opportunities in a timely and effective manner, resulting in a disconnect between community desires and the realistic opportunity space for system modification. With a better understanding of the interactions and processes connecting these technical and political components, there is an opportunity to improve the system evolution process to more efficiently account for community desires while meeting technical and operational
objectives.
The framework introduced in this thesis is demonstrated in the context of representative case studies evaluating specific advanced operational procedures with potential noise reduction implications. These procedures are introduced in a generic sense, evaluated at specific airports, and
applied to a simplified system-level analysis to determine potential noise implications. The benefits mechanisms and potential operational implications expected from each procedure are explored in the context of the noise evaluation framework developed in this thesis. These case studies suggest several best practices for noise-motivated arrival and departure procedure development.
1.2
PBN Track Concentration
The drivers of aircraft noise complaints have shifted over the past decade. While noise has been a focal point of airport environmental planning and policy for decades, recent developments in navigation and surveillance technology have enabled new high-precision approach and departure operational procedures using GPS and Performance-Based Navigation (PBN) standards. These procedures have proven effective for reducing fuel consumption and streamlining some aspects of air traffic control. In addition, the procedures have resulted in increased access and improved safety at airports with challenging terrain or airspace constraints. However, flight tracks that were previously dispersed over wide areas due to less precise navigation or air traffic control (ATC) vectoring are more concentrated on specific published tracks with effects on underlying communities. Figure 1 shows flight track concentration for arrivals and departures at Boston Logan International Airport (BOS) before and after implementation of arrival and departure procedures using Area Navigation (RNAV), a type of PBN procedure. The change in flight path concentration that results from RNAV arrival and departure routes is qualitatively evident from the figure.
Arrivals
Departures
V--2010
-20102015 - 2015
Figure 1. Aircraft fight tracks for operations at BOS before (2010) and after (2015) RNAV implementation (Source: Massport Noise and Operations Management System)
PBN procedure implementation is a central component of air traffic control modernization under the Federal Aviation Administration's (FAA) Next Generation Air Transportation System (NextGen). The original objective of the procedures was to increase safety, fuel efficiency, and airport throughput while reducing pilot and ATC workload. In terms of noise, the new procedures were required to maintain or improve population exposure levels relative to existing procedures in accordance with federal environmental guidelines. This "no net harm" objective was defined relative to the existing regulatory noise metric (Day-Night Average Level, or DNL) and threshold (65 dB DNL) for significant exposure. In order to avoid triggering the need for costly and time-consuming Environmental Impact Statement based on NextGen procedure modifications, new RNAV and Required Navigation Performance (RNP) procedures were required to maintain or reduce the number of people exposed to these regulatory significant noise levels. In an effort to accelerate the development and implementation of RNAV procedures, Congress approved a special "categorical exclusion" from typical environmental assessment requirements under the National Environmental Policy Act (NEPA) for RNAV procedures. This approach to noise analysis and evaluation, combined with a development procedure that did not incorporate community stakeholder feedback early in the process, meant that the negative community reaction to PBN procedures was largely unanticipated.
Community concerns related to aircraft noise followed implementation of RNAV arrival and departure procedures are occurring at airports throughout the National Airspace System (NAS). It became evident that regulatory "noise significance" metrics and levels did not adequately capture annoyance and complaints arising from flight concentration. As an example of this phenomenon, Figure 2 shows the geographic location of noise complaints after RNAV deployment at BOS relative to the 65dB DNL contour. It is seen that most complaints occur well outside the 65dB contour. Vocal opposition and requests for reconsideration of RNAV procedures based on noise annoyance were directed to airports, the FAA, and political representatives. Noise became a fundamental political constraint to continued RNAV deployment throughout the NAS, increasing scrutiny on environmental review policies and NextGen priorities.
Arrivals in green Departures in bluer
Each marker represents a unique complaint address
Figure 2. 65 dB DNL contour vs. noise complaint locations (red circles)
Communities around the US have expressed frustration with flight track concentration and noise arising from PBN implementation, resulting in increased political and legal action at airports throughout the country [2]. At the same time, operational and safety benefits of PBN and the worldwide implementation of new procedures make it difficult to revert to non-PBN procedures.
Ideally, PBN technology and procedures could be used to reduce overflight noise while retaining operational benefits [3]. The challenges associated with flight track concentration may be addressable through a clearer system-level view of noise evaluation processes, methods, and metrics. This thesis introduces a noise analysis framework that acknowledges the diversity of stakeholder priorities and interplay between complex sociotechnical factors in the noise management process. The presentation of this framework involves several key elements:
" Development of a noise analysis method and corresponding visualizations to enable feedback and negotiation between stakeholders from different technical and operational contexts, particularly with respect to available advanced operational procedures for noise reduction
" Discussion of several promising operational techniques available for noise reduction, including expected noise benefits at the 35 US Operational Evolution Partnership
(OEP-35) airports and potential barriers to entry for each concept
* Introduction to a real-world case study involving procedure development incorporating stakeholder feedback within the sociotechnical framework developed above, utilizing noise analysis tools and visualizations to enable productive design iteration and refinement while respecting operational and safety requirements
" Discussion of emergent characteristics of particular operational procedures on a system level, including potential benefits and opportunities for advanced PBN procedure
implementation
1.3
Sociotechnical System Framework for Procedure Development
Arrival and departure procedure redesign programs may be initiated in response to operational, environmental, or technological drivers. Operationally-motivated procedures are normally intended to increased throughput, efficiency, and safety for runways and airspace. Procedures intended to reduce environmental impact may be initiated in response to community feedback and complaints or broad-based policy objectives with respect to noise, air quality, and emissions. In some cases, new technological capabilities in terms of navigation capability or aircraft performance standards may
allow for the design of new arrival and departure procedures to supplement or replace existing procedures that made use of older technology. Such redesign efforts enabled by technology infusion
into the NAS may enable both operational and environmental benefits.
As discussed above, PBN navigation technology has enabled new and precise arrival and departure procedures. The design and implementation process of new RNAV and RNP procedures around the NAS has focused primarily on operational drivers (lowering minima for runways in the vicinity of terrain, increasing efficiency, and improving safety) while treating noise as a constraint on a "do no harm" basis according to existing metrics, thresholds, and NEPA review requirements. Regardless of the motivation and objectives for a new procedure development program, compliance with environment review and reporting regulations is mandatory. When developmental drivers are primarily operational, environmental evaluation and public feedback may not be considered during the preliminary development process.
It is clear that implementation of NextGen procedures in the NAS could be more successful if community feedback on noise impact was included in the procedure iteration process. While noise cannot be the sole concern in procedure development, consideration at a stage prior to NEPA review in the pre-implementation process has the potential to address community objections more effectively and increase buy-in for the eventual solution. This thesis introduces a framework for noise evaluation that incorporates environmental and operational objectives. This framework (shown in Figure 3) begins with the baseline procedure and noise environment (shown in the upper left) driving community responses and complaints (upper right). Communities react and request changes through a technical analysis process, which also accounts for operational system constraints and stakeholder values (shown in the lower right). Formal procedure requests from this process are ultimately forwarded to a formal pre-implementation process (shown on the left), including regulatory (NEPA) environmental review and operational implementation processes. Successful implementation pre-implementation processes result in new or modified procedures being integrated into the baseline noise environment. For this thesis, the framework and its implications for the procedure design process are discussed in the context of a specific PBN arrival and departure redesign effort at Boston Logan Airport.
Flight-Level Oganity
Schedule and Negotiation
Procedure Set Airport Noise Community Reaction Environment and Complaint Process
Change Request(s):
New/Modified -Objectives
Procedure Environmental/Operational Issues - Evidence
- Stated Values/Beliefs Preimploementation Process Change Process
NEPA Operational Review IImplementation Formal Procedure Request System Constraints Safety Flyability Design Criteria
Runways, terrain, etc.
Stakeholder Values
ATC
Operators Traveling public
,.Analyst AnalystDesignAsueAssumed
Objectives Proposed Action(s) Noise Models Impact Model impact: Data & Visualizations
Figure 3. Sociotechnical system framework for flight procedure development
1.4
System Noise Benefits of Specific Operational Procedures
Advanced arrival and departure procedures have the potential to reduce noise through two
pathways:
* Increased use of modern guidance and navigation technology
* Modifications to how airplanes are flown on existing procedures, including management
of aircraft speed, thrust, altitude, and/or configuration
Such procedure modifications could also increase the options available to procedure designers
and communities when discussing redesign efforts, providing opportunities for community
engagement and successful outcomes consistent with air traffic control modernization efforts. This
thesis discusses the potential system noise reduction potential examples from both advanced
operational procedure pathways (advanced navigation and profile management), providing specific
examples of the opportunity space for procedure modification under the flight procedure development framework.
1.5
Thesis Outline
Chapter 2 provides a background on the aircraft noise problem. This includes an introduction to the physics of noise generation and propagation, human response and impact, noise modeling techniques and tradeoffs, and regulatory frameworks constraining procedure design with respect to operational and environmental objectives.
Chapter 3 introduces an analysis framework used in this project for evaluating noise and population impacts from modifications to arrival and departure procedures. Noise metric selection and communication of impacts to communities are discussed.
Chapter 4 provides a summary of current design standards and other considerations for PBN approach procedure design. The key design constraints for RNAV and RNP procedures are discussed along with a discussion of current characteristics for published approaches around the NAS.
Chapter 5 provides an analysis of noise-reduction potential from PBN arrival procedures at every runway end for 35 major airports in the US OEP-35 airports. The potential benefits from RNAV and RNP procedures are discussed through an analysis at all 282 runways in the OEP-35.
Chapter 6 provides an analysis of noise-reduction potential from reduced-speed departure constraints applied to RNAV departure procedures at the major airports in the US.
Chapter 7 introduces the multi-stakeholder sociotechnical system framework for evaluating flight procedures. Implications for procedure design and implementation are discussed. An example procedure development process at Boston Logan Airport is introduced to illustrate practical opportunities and challenges using such a framework.
Chapter 8 draws conclusions about implementing an arrival and departure procedure design process that incorporates both operational and environmental objectives. The primary contributions of the thesis are summarized. Considerations for arrival and departure procedure design efforts are
discussed to maximize the positive environmental potential of NextGen technologies in conjunction with operational and safety objectives.
Chapter 2. Literature Review and Background on
Aircraft Noise
2.1
Physics of Aircraft Noise
Aircraft noise is a physical phenomenon defined as undesirable sound arising from an aircraft source. Noise generation arises from a combination of engine sources, aircraft aerodynamics (such as the turbulent flows around landing gear and high-lift devices), propulsive mixing and pressure fields in the aircraft wake, and mechanical interactions within the engine and aircraft systems.
2.1.1 Noise Sources on an Aircraft
Broadly speaking, aircraft noise emanates from both aerodynamic and engine sources. Engine noise from a turbojet arises from several independent sources. Each of these sources is associated with a directivity pattern as well as frequency and tonal characteristics that impact the far-field noise experienced by an observer on the ground. Fan noise occurs due to shock formation at the tips of engine intake fan blades at high thrust settings and due to wake interactions between fan blades. Additional core noise components occur due to mechanical/aerodynamic interactions and vibrations in the compressor, bypass duct, combustor, and turbine sections of the engine. Each of these noise sources can be mitigated with tailored component aerodynamics, engine material tuning, and acoustic liners in the engine nacelle [4]. Jet noise is generated at the shear layer between the high-velocity exhaust stream exiting the rear of the engine and the surrounding ambient airflow and/or bypass stream. The velocity differential in the shear layer is dissipated through vorticity and turbulence that is ultimately experienced as noise. The physics of this dissipation is fundamentally difficult to model due to the chaotic nature of turbulence, making theoretical jet noise prediction an area of fertile continued research and experimentation [5].
Engine noise was traditionally louder than airframe noise such that modeling efforts could focus on engine sources with only low-fidelity treatment of airframe sources without a major loss in overall
sound level prediction. With the reduction in engine noise corresponding to increasing bypass ratios and modern engine materials, airframe sources have become a larger contributor to the total perceptible noise signature from an aircraft. Airframe noise is generated due to bluff-body turbulence (large-scale irregular vortex shedding from large components including the fuselage, high-lift devices, and wings) and small-scale turbulence from parasitic components such as landing gear, high-lift device tracks and fairings, and flap/slat edge interactions [6].
The larger-scale bluff body noise sources, often referred to as clean-airframe noise, results from the shear mixing between turbulent boundary layers and the free-stream velocity. The theoretical far-field noise contribution from this effect is proportional to the fifth power of aircraft velocity, meaning that clean-airframe noise is significantly higher for fast-moving aircraft [7]. Airframe noise generated by landing gear and other parasitic sources is much more complicated from a detailed flow modeling perspective, involving both direct vortex shedding by components as well as aerodynamic interactions with downstream physical components and flow fields [6]. This effect is highly dependent on aircraft-specific configuration details. For example, the Airbus A320 family has a well-known airframe noise component arising due to fuel vent openings in the wings generating an audible whistle tone. While this tone specifically is addressable through the addition of vortex generators upstream of the vent openings [8], the original tonal noise problem would have been very difficult to predict with conventional modeling capability.
2.1.2 Propagation and Perception
The perceptible loudness associated with a sound is proportional to the sound pressure level (SPL) of an acoustic wave striking the eardrum. Noise is typically quantified in decibels, a logarithmic unit that compares the magnitude of SPL in a sound wave to a reference level representative of the minimum sound perceptible to average human listeners. A ten-decibel increase in SPL corresponds to an approximate doubling in perceived loudness [9]. While the absolute SPL provides important information about the annoyance associated with a particular noise event, additional characteristics also play key roles in perceptibility and noise quality. In general, annoyance from noise is a function of sound intensity, spectral composition, tonality, exposure frequency, time of day, and personal preference among other factors.
To the first order, a transient broadband noise is not perceptible to a human observer when background environmental noise exceeds the SPL of the noise event and has similar spectral characteristics. However, much as a distinctive voice or laugh can be discerned in a crowded room, a noise below surrounding environmental SPL levels may be both perceptible and displeasing due to spectral and tonal variation from the background [10]. Aircraft noise signatures are often highly tonal due to steady-state mechanical movements inside the engine (e.g., rotational movement of engine components) and speed-based aerodynamic effects (including whistle tones excited at specific frequencies).
The magnitude and character of aircraft noise experienced on the surface is also impacted by the slant distance between the source and observer, atmospheric attenuation and refraction, surface composition, sound reflection and interference, terrain, and structural insulation. In the absence of other factors, simple spherical wavefront spreading results in a reduction in SPL of 6dB for a doubling of observer slant range distance. For realistic aircraft noise sources, sound energy is concentrated by directivity, resulting in reduction in expected attenuation from wavefront spreading.
Additional attenuation in the atmosphere occurs through conversion of sound energy to heat due to molecular excitation and interaction. The magnitude of atmospheric attenuation is highly dependent on temperature and humidity. Attenuation increases for higher-frequency noise sources, meaning that low-frequency spectral and tonal components are audible farther from the noise source than high-frequency components at the same source pressure level [11]. Meteorological conditions also play an important role, with non-linear influence from both temperature and humidity. In general, total attenuation is greatest in low-humidity conditions due to increased overall air density. There is also strong temperature dependence, although the functional relationship is non-monotonic and dependent on humidity and sound frequency [12]. Taken cumulatively, the variability of atmospheric attenuation based on temperature and humidity complicate modeling efforts for noise propagation to the surface, leading to potential modeling discrepancies when standard atmospheric conditions are assumed for all operations.
Temperature profiles with altitude, wind direction, and small-scale turbulence in the atmosphere also contribute to variations in noise absorption and propagation pathways from an
aircraft source to the surface. To the first order, sound waves refract (or bend) away from the surface in standard temperature profiles (warmer at lower altitudes) and toward the surface in temperature inversion conditions (increase in temperature with altitude). Wind profiles also contribute to sound wave refraction due to any wind velocity gradient with altitude. Increasing wind speed with altitude results in refraction toward the surface in the downwind direction and away from the surface in the upwind direction [11].
Surface composition has a strong effect on noise experienced on the surface. Surfaces are broadly categorized into acoustically "hard" and "soft" surfaces, indicating the degree to which sound pressure waves are reflected or absorbed. Acoustically hard surfaces are characterized by strong reflection, reducing attenuation on the ground and causing noise propagation distances to increase. This is commonly experienced over open water, for example. Acoustically soft surfaces reflect sound waves to a lesser degree and absorb more energy directly. Vegetation and soil reduce sound wave reflection. Acoustically hard surfaces also result in stronger ground effects including multi-path interactions between direct and reflected sound waves. Depending on the geometry of the noise source, reflecting surface, and observer, this can increase or decrease the absolute noise level experienced at an observer location through constructive or destructive interference between sound waves.
Sound propagation to an observer is also affected by barriers between the source and observer, whether natural or artificial. In the outdoor environment, topographic features or manmade structures impact wavefront propagation, normally providing a noise shielding effect. In addition, sound insulation of inhabited structures and dwellings reduces the noise experienced inside those structures. The quality and construction of windows, doors, walls, and ventilation systems have a strong impact on attenuation of noise from the outdoor environment to the indoor environment.
The physical characteristics of aircraft noise generation, propagation, and perception are sufficiently complicated to pose challenges for rapid and efficient computational modeling. Source noise fidelity and spectral characteristics, atmospheric assumptions, surface modeling, and underlying population data all impact the accuracy of noise models relative to empirical
measurement data. Section 2.4 introduces the typical approaches used for aircraft noise modeling and propagation.
2.2
Effects of Aircraft Noise
This thesis focuses on the impact from aircraft noise on underlying population in terms of annoyance as expressed in broad community sentiment and complaints. A growing body of research aims to quantify human health and sociological impacts attributable to aircraft noise to a degree of confidence sufficient for policymaking. Broadly speaking, negative consequences arise from sleep interruption, learning disruption for children, and increased risk to cardiovascular health due to stress and other intermediary effects [13]. This section presents a brief introduction to the impacts of aircraft noise on human populations, motivating the importance of noise reduction research and mitigation efforts.
2.2.1 Annoyance from Noise
The ultimate objective of any noise study is to quantify the psychological impact of noise on people in surrounding communities. If a given combination of sound characteristics does not produce annoyance, there should be no concern with that sound source. However, the meaning of'annoyance' and the resulting analysis techniques are widely debated amongst experts and impacted communities [14].
Noise is a key component impacting the total environmental footprint from aviation, along with emissions (climate impacts and air quality) [15]. Despite subjectivity in the definition and evaluation of noise, many in the literature have attempted to quantify annoyance as a function of sound exposure. An SPL time history from a typical aircraft overflight event is shown in Figure 4. While absolute pressure level does not translate directly to human annoyance from noise, the characteristics of overflight events are used to calculate acoustic metrics such as Sound Exposure Level (SEL) and Maximum Sound Level (LMAX), both of which are used in population impact analysis. These metrics and other integrated derivatives are presented in more detail in Section 2.5.
80 75 -1 0dB 70 -SEL 65 Background 60 0 0 5 10 15 20 25 30 Seconds (s)
Figure 4. Sound pressure level time history at a single observer location illustrating LMAX and SEL metrics
Annoyance measures generally account for the absolute magnitude of sound pressure level, tonal characteristics, frequency exposure, and other environmental variables. Early research in the field of aircraft acoustics attempted to identify which characteristics were primary drivers for perceived annoyance [16]. Kryter extended this research into early sound metric development that weighted particular frequency bands more heavily than others and accounted for tonality in an attempt to capture human annoyance response [17]. Perceived Noise Level (PNL) has been supplemented by a wide array of alternative metrics since Kryter's early work, notably DNL [18]. Different metrics are suitable for different types of analysis, leading to further complications in terms of translating quantitative noise metrics to community annoyance values.
Schultz established the first formal functional relationship between DNL and perceived annoyance using a survey approach [19]. This "Schultz Curve" was the basis for selecting 65 dB DNL as the significant noise threshold for the purpose of legal interpretation in the US. Others have extended this survey-based approach using larger data sets, also examining annoyance from other transportation methods [20]. In the intervening years, Fidell and others have evaluated the underlying assumptions driving the dose-response methods and metrics pioneered by Schultz and attempted to identify refinement opportunities (i.e. [21]). Finegold et al revisited the concept of annoyance to better emphasize disruptive noise exposure (i.e. sleep awakenings) compared to other types of annoyance [22]. Guski integrated social science surveys and international expert opinions to
MLA
establish differences in annoyance characteristics by country, indicating a strong cultural component
to how noise is perceived [14].
Recent studies indicate that community sensitivity to aircraft noise has increased over time [23],
[24]. This is despite the fact that aircraft have become quieter in terms of single-event noise levels.
The FAA has implemented regulatory noise limitations based on the certification noise levels for
turbojet aircraft. The total effective perceived noise from three measurement locations must fall
underneath a threshold of increasing stringency over time. These thresholds are referred to as noise
"stages" [25]. Figure 5 shows the increasing noise stringency from Stage 2 (the earliest and least
stringent standard applicable to early jets) to Stage 5 (the latest standard applicable to new
certifications). The figure also shows actual certification noise levels for common turbojet aircraft
types, illustrating that aircraft noise levels are reducing over time at a rate that exceeds regulatory
requirements.
15 z CL a5 0 -5 -I -15z
. -25 E U STAGE 2 * B737 200 * -727-200 * DC-9-10 * DC8-55F *B707 300 8727-100 B747-100 STAGE 3 747-100*F SDC9-14 MD10-1OF 8747-300 A30082/B4F 8767-200+ +MD83 8747 400 *m 3 MD+87 A30OF STAGE 4 M75-2 20-20& + 737-$00+ 8737-900 3757-200MDII +873-700ST E B771-200# A340-300 MD717-200 * A340-600 A300-300 B747 MD90-30 * *737-8 A3804800 B787-9RR 9 A320CFM A787 9GE *4 A350 941 * A32OPW 1960Figure 5. Noise stage
1970 1980 1990 2000 2010 2020
Year of Certification
levels and certification values for common turbojet aircraft types as a
function of certification year (Source: FAA [261)
Technology improvements are expected to continue to reduce noise contour area [27], although
this is not guaranteed to reduce community annoyance. Research by Brink indicates that changing
aircraft noise exposure (i.e. increased flight frequency or redesigned flight procedures) leads to stronger annoyance responses than steady-state noise [28]. In addition, research has consistently shown the importance of non-acoustic variables in determining community response to noise. Research by Job indicated that sound exposure accounted for less than 20% of variation in reported annoyance from community members, with the remainder associated with non-acoustic variables [29]. Non-acoustic variables that may have a stronger impact on annoyance than absolute sound levels were identified by Guski, such as general attitude toward aviation as well as sensitivity to noise regardless of level [30].
The general approach to quantifying annoyance is to correlate the measurable noise metrics introduced above with levels of subjective annoyance reported by sample subjects. These survey methods result in statistical distributions which are converted to annoyance functions using simple regression methods. Using these annoyance functions, appropriate regulatory thresholds for noise metrics can be established. For example, early synthesis done by Schultz led to the establishment of 65 dB Day-Night Average Level as a key regulatory cutoff for community noise mitigation programs, as shown in Figure 6. The analysis performed by Schultz compiled experimental data from 18 social surveys on noise annoyance correlated to annual average Day-Night Level arising from a combination of aviation, rail, and road noise [19].
100 -, , , , , ,
m
All 11 DATA POINTS
Given EqualWeight
S80- All SURVEYS
Given EqualWeight 90% of the Data Points
00
0 L
40 50 70 so 90
A-weighted Day-Night Level (dB)
The original work establishing the correlation between annual average DNL and community annoyance did not evaluate finer-resolution time impacts, such as frequency-driven annoyance occurring during peak utilization periods of transportation infrastructure. While the annual-average method is convenient for policy and regulatory purposes, its practical application is complicated by the large variation in community expectations between people and over time. Significant research effort has been devoted to quantifying annoyance levels. These studies attempt to refine methodology for collecting annoyance attitude data as well as the mathematical regression models used to fit these results. While refined models are available as a result of this work, most have not been implemented by regulators or analysts on account of longstanding legal precedent and policy use of existing metrics and tools [18]. Correlating measurable sound characteristics with community annoyance is central to the fundamental premise of noise regulation, which is to mitigate impacts of aircraft noise on quality of life for surrounding communities. Therefore, this correlation remains one
of the great research and implementation challenges for aviation environmental specialists.
2.2.2 Sleep and Learning Effects from Noise
Noise-induced delay of sleep onset and/or sleep disruption is associated with negative health and lifestyle outcomes including elements of general fatigue, immune system degradation, cardiovascular and endocrine system function, and psychiatric symptoms [31]. Measurable physiological responses to noise may be observed at sound pressure levels as low as 33 dB [32], although thresholds that cause awakenings are generally higher and are not consistent across samples. Local variables such as background noise levels, habituation patterns of residents, and sociopolitical norms result in highly contextual noise thresholds for sleep disturbance [33]. Nonetheless, sleep disturbance is one of the most acutely disruptive and noticeable byproducts of aircraft noise.
In terms of learning effects, several epidemiological studies appear to show that chronic noise exposure may impair reading and memory as well as standardized test scores ([34], [35]). The mechanism for this effect appears to be through communication disruption and distraction during school hours, as well as high correlation with heightened noise exposure outside of school hours and