Publisher’s version / Version de l'éditeur:
Vous avez des questions? Nous pouvons vous aider. Pour communiquer directement avec un auteur, consultez la première page de la revue dans laquelle son article a été publié afin de trouver ses coordonnées. Si vous n’arrivez pas à les repérer, communiquez avec nous à [email protected].
Questions? Contact the NRC Publications Archive team at
[email protected]. If you wish to email the authors directly, please see the first page of the publication for their contact information.
https://publications-cnrc.canada.ca/fra/droits
L’accès à ce site Web et l’utilisation de son contenu sont assujettis aux conditions présentées dans le site LISEZ CES CONDITIONS ATTENTIVEMENT AVANT D’UTILISER CE SITE WEB.
Research Paper (National Research Council of Canada. Division of Building
Research); no. DBR-RP-359, 1967
READ THESE TERMS AND CONDITIONS CAREFULLY BEFORE USING THIS WEBSITE. https://nrc-publications.canada.ca/eng/copyright
NRC Publications Archive Record / Notice des Archives des publications du CNRC :
https://nrc-publications.canada.ca/eng/view/object/?id=ff43e8e1-9da1-4bd4-8b13-7ec7fe9ad47d
https://publications-cnrc.canada.ca/fra/voir/objet/?id=ff43e8e1-9da1-4bd4-8b13-7ec7fe9ad47d
NRC Publications Archive
Archives des publications du CNRC
This publication could be one of several versions: author’s original, accepted manuscript or the publisher’s version. / La version de cette publication peut être l’une des suivantes : la version prépublication de l’auteur, la version acceptée du manuscrit ou la version de l’éditeur.
Access and use of this website and the material on it are subject to the Terms and Conditions set forth at
Properties and Behaviour of Freezing Soils
Williams, P. J.
NORGES
GEOTEKN
N O R W E G I A N G E O T E C H N I C A L I N S T I T U T E
P U B L I K A S J O N
NR
eP U B L I C A T I O N
P.
J. WILLIAMS:
Properties and Behaviour
of Freezing Soils.
Avec r6sum6s franqaises.
Norwegian Geotechnical Institute and the Division of Building Research, National Research Council of Canada as an interrelated program. This publication is also available in North America from the National Research Council, Ottawa ; order No. NRC
9854.
PROPERTIES AND BEHAVIOUR
O F F R E E Z I N G SOILS
B Y
Pages 23 and 26:
After Williams rend 1963 for 1962 (b)
After Williams rend 1966 for 1964 (b)
After Miller read 1966 for 1964 Pages 51: 52: 58, 63, 64:
After Williams rend 1967 for 1966 (c) . ,
page 64:
T bi-ll;)vl
Equation should read: In- = -
To L
The papers on pages 1-10, 11-26, and 51-72 are reprinted from Geotechnique: Vol. XIV, 2, 1964; Vol. XIV, 3, 1964; and Vol. XVI, 3, 1966 respectively.
The paper on pages 27-35 appeared in Proceedings, Per-
mafrost International Conference. Nat. Acad. Sci. - N. R. C.
P U ~ I . 1287, 1966.
The paper on pages 73-90 first appeared in <<The Engineer,,,
Vol. 223, 5796, pp. 293-298, 1967.
The cover and the papers on pages 2 7 4 8 and 73-119 are printed in Norway.
FOREWORD
The characteristic behaviour and properties of frozen soils arise because ice and water
coexist under the conditions imposed by the porous structure of the soil. The results of
an investigation into the relative amounts of ice and water in frozen soils led to a series
of related studies, described in the present volume, each of which was suggested by the
conclusions arising from the preceding one.
The first paper in this volume describes experimental measurements of the apparent
specific heat of frozen soils. The second describes the determination, from similar meas-
urements, of the proportions of ice and water present in frozen soils. The temperature
at which a certain quantity of unfrozen water occurs in the frozen soil was found to be
related to the pressure at which an equivalent quantity of water occurs in a conventional
suction-moisture content test. This implies a dependence of pore water pressures on
temperature in frozen soils. This is confirmed by experimental investigations described
in the third paper, of the mechanical effects of the pressures of the unfrozen water in
frozen soil at various temperatures.
The fourth paper analyzes theoretically the relationships of temperature to the pres-
sures of the ice and water phases, in terms of interfacial energy and the restricted sizes
of ice-water interfaces within the soil. It is shown that where interfaces are sufficiently
large not to be affected significantly by surface adsorption forces of the soil particles,
a relatively simple physical picture based on capillary theory gives relationships in good
agreement with the experimental observations. In practice the limits, for all soils, within
which this picture is realistic correspond to temperatures between
0" C and about
-2"C.
This range is, of course, of prime importance in many engineering and geological con-
siderations.
Striking advances recently made in thermodynamic analysis from the point of view
of adsorption phenomena promise interpretation of similar experimental observations
for lower temperatures, where much of the remaining pore water is under the influence
of surface forces. The ideas and concepts involved will probably have considerable
practical significance but as yet are unfamiliar to many. They lie outside the scope of
the present work, although appropriate literature references are included.
The fifth paper extends the concepts of the preceeding paper to an experimental
investigation of conditions at the frost line (the boundary between frozen and unfrozen
soil). It appears possible to predict whether frost heaving will occur and under which
field conditions from simple measurements of the pressure at which air will intrude into
the pores of a saturated soil sample. The sixth paper describes experimental investigations
of the manner in which air may replace water in the pores of the soil. It clarifies the
extent to which the behaviour of air and water in soil, and ice and water in soil, are
analogous.
The seventh and final paper differs in nature from the others. It attempts a simple,
composite presentation of the soil freezing processes based on the work described in
the previous papers. The main equations relating pressures in the soil, ice and water,
of frozen and adjacent unfrozen ground, to temperature are reviewed. The implications
mechanical and thermal properties of frozen soil. It is intended that this paper can be
read without detailed reference to the other papers. Both engineering and geological
applications are considered. The extrapolation to field conditions of knowledge gained
from laboratory experiments, in the absence of a correspondingly comprehensive pro-
gramme of field research, involves some degree of speculation. It remains to be seen
whether factors associated with field conditions and as yet unexplored will prove on
occasion to be of dominant significance.
In general each paper was prepared and in some cases published shortly after com-
pletion of the research it describes. The investigations have been carried out over six
years. Occasionally discussion of minor points occurs which, in the light of the sub-
sequent work, appears irrelevant. In some cases, papers also included in the present
volume are referred to only by the journal, volume and date of their original publication.
It is hoped that the papers are consistent in development of the picture of the soil
freezing process, in the use of symbols and in terminology.
The investigations were carried out at the Division of Building Research, National
Research Council, Canada, and at the Norwegian Geotechnical Institute during tenure
of a Fellowship
1963-65,awarded by the Royal Norwegian Council for Scientific and
Industrial Research. The Institute and its Director, Dr. Laurits Bjerrum, provided the
stimulus and facilities which led to the publication of the present volume. Mr. Rolf
Kirkedam has kindly given considerable editorial assistance. More specific acknowledge-
ments are made at the end of each article, but note must be made here of the author's
gratitude to colleagues too numerous to name who have discussed, often at length,
aspects of the work.
CONTENTS
Foreword
...
Symbols
. . .
Definitions
...
Experimental determination of apparent specific heats of frozen soils
...
...
Unfrozen water content of frozen soils and soil moisture suction
...
Suction and its effects in unfrozen water of frozen soils
Unfrozen water in frozen soils: Pore size
-Freezing temperature -Pressure
relationships
...
Pore pressures at a penetrating frost line and their prediction
...
Replacement of water in soil pores by air
...
The nature of freezing soil and its field behaviour
...
I11
VI
VII
1.-
11'-
27
\-(Symbols appearing only once are defined in the text where they occur.)
area
latent heat of freezing of water
molar latent heat of fusion
molar latent heat of sublimation
negative pressure (suction) expressed
as height of a column of water
pressure of air
logarithm of suction expressed as
height (cm) of column of water (see
also footnote p. 16, and 'Definitions')
pressure of gas phase
pressure of ice
pressure of liquid phase
pressure of solid phase
pressure of water
radius
radius or equivalent radius of air-
water interface
radius equivalent to size of largest
continuous openings through soil
pore system
radius or equivalent radius of ice-air
interface
radius or equivalent radius of ice-
water interface
radius or equivalent radius of liquid-
gas interface
radius or equivalent radius of solid-
gas interface
radius or equivalent radius of solid-
liquid interface
molar entropy of gas
molar entropy of liquid
molar entropy of solid
temperature
temperature
"
C, at which soil water
has a given suction in the absence of
effects due to salts in solution
freezing point depression due to dis-
solved salts
freezing point depression due to dis-
solved salts at temperature
xpore water pressure
pore water pressure immediately
adjacent to air penetrating capillary,
or soil pores
pore water pressure immediately
adjacent to ice at penetrating frost
line
pore water pressure immediately
adjacent to ice at penetrating frost
line at depth
xpore water pressure at depth
xunder
conditions of hydrostatic equilibrium
volume
molar volume of gas
molar volume of liquid, also specific
volume of water
molar volume of solid
depth from ground surface
depth or thickness
maximum depth below ground sur-
face at which frost heave can occur
depth of water table from ground
surface
bulk density of soil
finite increment
infinitesimal increment of
contact angle
micron
(= 1.
10-4cm) also molar
chemical potential
density of water
total stress, also interfacial energy
effective stress
interfacial energy (surface tension)
air-water
interfacial energy (surface tension)
ice-air
interfacial energy (surface tension)
ice-water
interfacial energy liquid-gas
interfacial energy solid-gas
interfacial energy solid-liquid
shape factor
DEFINITIONS
Frost line:
The boundary between frozen and unfrozen soil.
Negative pore pressure:
Pore water pressure less than atmospheric.
Negative teinperature:
Temperatures below
0" measured on the Centigrade scale.
'Increasing negative temperature' refers to a state of cooling.
Pore wa!er pre.s.~:l.ure: pore pressure:
Pressure of water in pores of soil, or pressure of
water external to soil pores but continuous with it and a t the same pressure.
Saturated soil:
Soil, the pores of which are filled with water and/or ice. Pores at the
surface of the soil are also considered completely filled, such that there is no
curvature a t the air-water or air-ice interfaces. Scattered entrapped air bubbles
within the soil pores are ignored.
Suction: (1)
The difference between the pore water pressure and the air pressure external
to the soil, as a result of curvature of the air-water interfaces. If the external air
pressure is atmospheric the suction is numerically equal to the negative pore pres-
sure. Some authors, referred to in the text, use the term in a more general sense
to describe the potential or free energy of the soil moisture.
(2)
The difference in pressure between the ice and water in a frozen soil, due to
the curvature of the ice-water interfaces, when the pressure of the ice is equal to
the external atmospheric air pressure.
Surface tension:
The tension which apparently exists in a n interface between
int. al.a
liquid and a gas, a liquid and a solid, or a solid and a gas. Ascribed to the effects
of attractive forces between the molecules at the interface, it is often referred to
as interfacial tension, or interfacial energy. The latter term is also used synonym-
ously with surface tension in the present volume. See also descriptive illustration,
p.
91.
EXPERIMENTAL DETERMINATION OF APPARENT SPECIFIC
HEATS OF FROZEN SOILS
by P . J. WILLIAMS*
SYNOPSIS
A property of water in porous materials is t h a t i t freezes a t temperatures below 0°C. There is no single freezing temperature for water in soils. As ice is formed the freezing point of t h e decreasing quantity of unfrozen water falls further below 0°C. Latent heat of fusion is thus involved in temperature changes over a range extending t o several degrees below 0°C. The latent heat and specific heat to- gether constitute a n apparent specific heat.
Apparent specific heats for various silt, clay and organic soils have been measured in a calorimeter. The apparent specific heats generally rise a s tem- peratures approach O°C, and in a clay soil may be
ten times a s great a t -1°C a s a t -5°C. The
apparent specific heats for a given temperature depend on whether the soil is freezing or thawing, and on various other factors. The precise determin- ation of heat quantities involved in temperature changes in soil in situ is difficult, mainly because of the several factors influencing t h e freezing of the soil moisture.
Une propriete de l'eau dans les corps poreux est:
qu'elle gble k des te~nperatures inferieures a 0°C.
I1 n'y a pas de temperature unique de congelatioil
de l'eau dans le sol. Au fur e t B mesure que la
glace se forine, le degre de congelation descend a u dessous de 0°C. Une clialeur de fusion latente est donc en cause lors des changements de temperature couvrant plusieurs degrbs au dessous de 0°C. L a chaleur latente et la chaleur specifique constituent ensemble une chaleur apparente specifique.
Les chaleurs specifiques apparentes pour des limons, des argiles et des sols organiques divers ont Ct.6 mesurkes dans un calorimktre. D'une manikre generale, la chaleur specifique apparente s'61kve lorsque la temperature s'approche de O°C, e t dans
le sol argileux elle peut &tre dix fois plus grande
B
- 1 "C q u ' i -5°C. L a chaleur speciiique apparente
pour une temperature donnee depend soit du gel, soit du degel du sol, e t d'autres facteurs divers. L a determination precise des quantit6s de chaleur en cause lors des changements de temperature dans le
sol, sur place, est difficile, surtout ii cause de plusieurs
facteurs qui influencent la congelation de l'humidite se trouvant dans le sol.
INTRODUCTION
When water in finely porous materials freezes, much of it does so a t temperatures lower
than O°C. This phenomenon is important in the freezing and thawing of soils. Half of the
water in clay soils may be unfrozen a t -2OC and generally, smaller quantities in coarser-
grained soils. The equilibrium freezing point temperature is different in different parts of the
soil water,
SOthat the process of freezing or thawing of soils generally talces place over a wide
range of temperature. Consequently, the quantity of heat required to raise or lower the tem-
perature of soil within this range is made large by the latent heat of freezing (Williams, 1962).
In this present Paper, the term "apparent specific heat" refers to such heat quantities to
distinguish them from "true" specific heats which are not associated with change of phase.
This Paper describes determinations made with a calorimeter of the specific heats and
apparent specific heats of various soils, for temperatures above 0°C and down to --10°C.
The use of such values in estimating the apparent specific heats of soils met with in field
problems is discussed briefly.
CALORIMETRIC INVESTIGATIONS
A
calorimeter has been constructed (Fig. I ) that permits measurement of the amount of
heat added to or removed from a specimen to raise or lower its temperature by a certain
amount. During warming of a sample, the only source of heat is that supplied a t a measured
rate by a heating coil attached to the specimen holder. During cooling, heat is lost from the
sample holder at a practically constant rate determined by the temperature of the outer con-
tainer which, in this case, is maintained lower than that of the sample holder by a certain
amount.
*
Snow and Ice Section, Division of Building Research, National Researcll Council, Ottawa, Canada-a t present Research Fellow, Norwegian Geotechnical Institute. 1
2
P . J . W I L L I A M STemperatures are measured by tllermocouples a t three points within the sample. Read-
ings from each thermocouple are recorded by a Speedomax recorder with preamplifier, at
intervals of 5 minutes or less. Also recorded a t 3-minute intervals on the same apparatus
are temperatures from four tl~ermoco~iples
placed on the inner side of the outer container
(Fig.
1).
Under normal conditions these latter readings serve merely to check the operation
of the calorimetric equipment.
The calorimeter is immersed in a tank of ethyleile glycol solution, cooled by
a
compressor.
During warming tests, when the only source of heat is to be the measured quantity supplied
through the heating coil, heat exchange between the sample holder and its surroundings is
avoided by maintaining the outer container a t substantially the same temperature as the
surface of the sample holder. This is achieved by regulation of the temperature of the
ethylene glycol in which the calorimeter is immersed. The temperature of the ethylene glycol
L E A D S TO SWITCHING - ---, MECHANISM FOR ' \ H E A T E R , AND TEMPERATURE >xi'\ RECORDER T H E R M O C O U P S REFRIGERATED E T H Y L E N E G L Y C O L L U C I T E TANK STIRRER -- -- EATING C O I L ON S A M P L E I i O L D E R VALVE TO A L L O W FLOI'I FROM RESERVOIR SCALE IN INCHES
Fig. I. The calorimeter
normally tends to fall slowly. When its temperature and hence that of the outer container
falls about
0.1 "C
below that of the sample holder, a blade heater in the glycol is automatically
switched on until the temperature of the outer container is about
O.l°C
warmer. The switch-
ing mechanism is operated by the amplified signal received from two tl~erinocouples in series,
on the sample holder and outer container.
During cooling (freezing), when heat is extracted a t a nearly constant rate, the temperature
of the outer container is maintained consistently lower than that of the sample holder. This
is achieved by adjustment of the zero control of the amplifier, such that its output is sufficient
to actuate the relay mechanism and heater only when the ethylene glycol becomes cooler than
the sample holder by more than the predetermined amount.
The rates of heat extraction during cooling for various temperature differences were
measured in calibration tests. I n most soil tests, however, observations were made over a
cycle involving cooling followed by rewarming to the initial temperature. The rate of heat
loss is then calculated by dividing the total heat input in the "thawing" part of the freeze/
thaw cycle, by the time taken to cool the sample in the "freezing" part of the cycle. Both
procedures involve minor errors, but the latter gives more consistent results. 3-5 days were
normally required for each freezelthaw cycle.
Calculation of results
Although the method used in calculating the specific and apparent specific heats was
occasionally varied in minor respects, the following was the general procedure.
The procedure is similar in most respects for both thawing (warming) tests, and for freezing
(cooling) tests. On the time-temperature record on the Speedomax chart, starting from the
point corresponding to 0 mV (i.e. O°C), points are marked for every 0.25 mV, (equal to 0.13"C)
change in the temperature, for one of the thermocouples in the soil sample. The heat supplied
to or removed from the specimen and sample holder in the time talten for each of these inter-
vals of temperature change (AT), is then calculated. For warming tests the relationship
used is
:0.24
V I t
=Q
calories
where
0-24
=conversion factor, cal/J
V
=voltage across heating coil on sample holder, volts
I
=current through heating coil on sample holder, amps
t
=time (seconds) for sample temperature to change through A T
During cooliilg the relationship used is
:Total heat input for warming part of cycle
=
Time (sec) to complete cooling part of cycle
Xt f
where
t f
=time (sec) for sample temperature to change through AT.
The specific heat, or apparent specific heat, is then calculated and expressed in calories per
gram of soil per "C
:Q
-A T C ,
h
=TV,
A T
where
:W ,
=total weight of soil sample, g
C ,
=calorimeter "constant
",
cal/"C, i.e. the heat required to change the temperature of the
empty sample holder b y 1 "C.
Values obtained for various soils are shown in Figs 2 and 3 where they are plotted as a function
of temperature.
For many soils, the large heat quantities (largely coinposed of latent heat) involved in
temperature changcs in the range 0°C to -0.5"C cannot be shown satisfactorily on this type
of graph. These heat quantities are shown as a separate value beside each graph. In cal-
culating these values, the same expressions were used, except that A T has a value of 0.5"C.
Exficrinzental acczlracy
The temperatures of the soil are obsci-ved wit11 an accuracy of about &0.05"C for indi-
vidual points, but a line drawn througl~
several recorded points geilerally gives the therino-
couple temperature with somewhat greater accuracy. Temperature differences within the
sample are normally less than 0.1 "C. \iVllen there is a very small quantity of ice present
locally in the sample, the temperature of the part of the soil furthest from the ice may change
more rapidly than that adjacent to it, because of the absorption of latent heat by the melting
ice. Temperatures in different parts of the soil may then differ b y 0.2"C, and sometimes more.
This is probably the main reason for an observation frequently made during thawing: the
time/temperature curves indicated that the effect of liberated latent heat is still present a t
P . J. W I L L I A M S
TEMPERATURE
9 . 8 3 (FREEZING1 14.28 (THAWING)
LEDA CLAY 100-7 TOTAL MOISTURE CONTENTx 31 7. DRY WT.
h 'F *C
Jo
3 2 31 30 29 2 8 27 2 6 2 5 24 2 3 2 2 25 2 0 1 5 1 0 TEMPERATURE B:-
FREEZING RUN-
THAWING RUN-
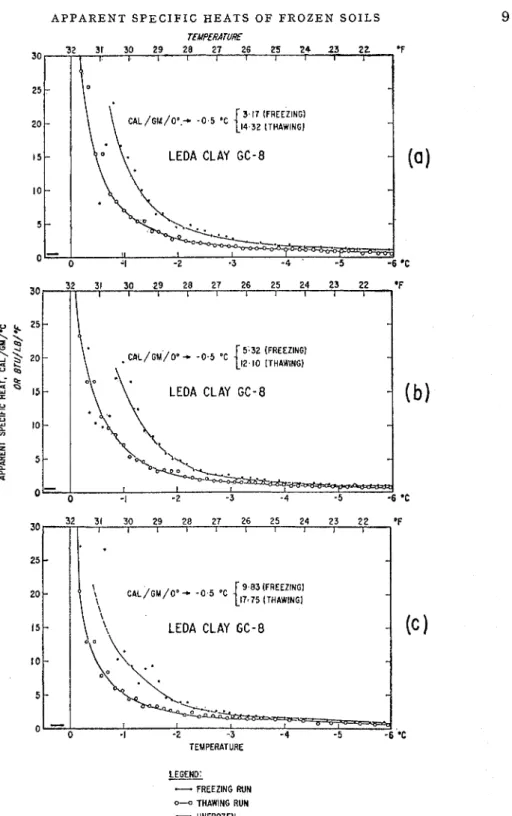
UWROZEN 3O 2 5 2 0 I S 10 5 0Fig. 2. Specific heats and apparent specific heats of various soils. Also shown are the heat quantities exchanged in a temperature change between O°C and -0.5'C
5
-
- 0 - 0 ---4-se- -I -2 - 3 - 4 -5 -6 - - --
I I I I I I,
I - C A L / G M / O *-
- 0 5 *C[
12.91 (FREEZING1-
14 99 (THAWING) NlAGARA SILTTOTAL MOISTURE CONTENT = 3 0 Y. DRY WT. -
-
- - - --
3 2 31 30 2 9 2 8 2 7 2 6 2 5 2 4 2 3 22 'F I I I I I I I I I I CAL/GM/O'+ - 0 5 'C[
69.06 (FREEZING) 74.50 ITHAWINGI PEATTOTAL MOISTURE CONTENT = I 3 3 0 Y. DRY WT.
I
recorded temperatures of +0.4"C or even higher.* The last remaining ice is probably remote
from the ther~nocouples
and thaws a t or below O°C, so that the latent heat of the last thawing
ice has been calculated as part of the heat quantity involved in temperature change between
0°C and -0.5"C.
The specific heats above 0°C are therefore shown as a single value on the
graphs.
In addition to the quality of the equipment that measures temperature and heat input,
the accuracy of the determined specific heats depends substantially on the control of the
temperature of the outer container of the calorimeter.
If
the temperature of the outer con-
tainer deviates on the average from that of the sample holder, there will be a corresponding
unmeasured quantity of heat added to or removed from the specimen. The amount of heat
lost will be proportional to the time talren for the test. For soil samples of given weight, the
percentage error in apparent specific heat due t o this heat loss, will, for practical purposes, be
inversely proportional to the measured rate of heat input or extraction. Conversely, for a
IRON ORE (limonitic, friable)
TAL MOISTURE CONTENT= 29.31 V. DRY WT. TEMPERATURE. ' C
Fig. 3. Specific heats and apparent specific heats of iron ore. Also shown is the heat quantity exchanged in a temperature change between O°C and -0.5"C
given rate of heat transfer, the error will be proportional to the weight of the sample. During
tests of long duration (as in the case of most soils) errors of this type could be reduced by
occasional slight readjustments of the temperature controlling mechanism.
The amount of heat involved in warming or cooling the sample holder was determined in
calibration tests. The value used for this calorimeter "constant" was
87
cal/"C. I t may be
in error by
1
to 2 calories in some cases, mainly because of minor changes that became neces-
sary in the mounting of the thermocouples. Since the weight of the sample is normally about
200 g it follows that an error of perhaps 1-2% may occur in the observed specific heats, when
thcse are very low (e.g., 0.2 cal/g/"C). For higher (apparent) specific heats the error duc to
inaccuracy of the calorimeter constant becomes negligible.
The effects of the limitations of instrumental accuracy and of the various sources of error
mentioned here, together with other minor ones, are not predictable quantitatively for every
test. To some extent, in each test these effects cancel out. In a series of five tests carried
out with distilled water, the observed values of the specific heat showed a standard deviation
of 0.04 cal/g/"C, or 4.0%, about the true value. The average of the deviations of the observed
values from the true values was 0-02 cal/g/"C (Table 1).
Although this gives a good indication of the accuracy that can be obtained with the
calorimeter, investigations of soils involve additional complications, especially those asso-
ciated with the rapid change of apparent specific heats with temperature. These are illus-
trated by tests on two different-sized samples froin the same soil. For each soil sample the
*
This may be compared with temperatures n~hich are recorded by a tl~ermocouple placed in a n ice bathto which lieat is being slowly supplied. Temperatures of several tenths of a degree above O°C, are observed
even while ice is still present, but there is no marked increase in rate of temperature rise until all the ice has melted.
Table 1
Control tests carried out on distilled water
--
Standard deviatioil
=p$
1
Specific heat cal/g/"CTcmp. "C
/
I-Idbk of physicsobscr\.cd
/
and chem., 1962=
0.04 cal/g/"C
=
4%
Average of deviatioils
=0.02 cal/g/"C
Deviation = x
cal/gIoC
apparent specific heat was obtained for fifty-two temperatures at increments of 0.13"C, from
-O.S°C to -7.3"C.
With the two values thus obtained for each temperature (one from each
test), a mean value was calculated. The deviations of the observed values from their respec-
tive means were expressed as a percentage of these means. The standard deviation of these
percentages for the whole range was 9 4 % . The smoothed curves drawn through the two
sets of observed points are closely similar, however (Figs 6(a) and (b)). The freezing process
(and consequently the apparent specific heats) are unliltely ever t o be exactly similar in any
two tests on the same soil, because natural soils are not entirely homogeneous. Small differ-
ences in the nature and distribution of voids, as well
as
different stresses that may arise a t
each freezing, result in slightly different amounts of moisture freezing or thawing a t a given
temperature.
These considerations, together with the fact that the temperature of soils in situ is rarely
definable to within 0.1 "C, show that the reproducibility of the results is quite satisfactory for
practical purposes.
Experinze~ztal reslrlts nlzd their ilzterfiretation
Figs 2 and
3
illustrate the dependence of apparent specific heat on type of soil. At least
two freeze/tha\v tests were made on each of five soil types and in some cases six or more.
These repeated tests sl~owed
that the apparent spccific heats are independent of the rate of
temperature change, at least for those rates likely to occur undcr field conditions. The grain-
size composition of the soils is shown in Fig. 4. The finer-grained soils have, in general,
higher apparent specific heats. This is
a
result of the larger quantity of water that freezes,
or thaws, a t temperatures below 0.5"C in these soils. For each increment of temperature
change in sucll soils, there is a correspoildingly larger component of latent heat involved.
The freezing of water in soils at these temperatures is due mainly to the state of stress (pF)
produced in the soil water by capillary and other effects (see Schofield, 1935; Edlefsen and
Anderson, 1943). In general the stresscs developed in the water in finer-grained soils arc
such that larger quantities of water will freeze a t temperatures below -0.5"C than in coarser-
grained soils. The conspicuous peak shown in the freezing curve of the Leda clay (Fig. 5(a))
is probably due to an unusual amount of water in the soil under a state of stress resulting in
freezing a t about
-1.1
"C. This may be compared with the sharp drop in moisture content
for
asmall change of suction, that occurs in the suction-moisture content curves (see e.g.
G R A I N S l Z E
M M .
M . I . T . G R A I N S l Z E C L A S S I F I C A T I O N
Fig. 4. Grain-size composition curves for soils investigated calorimetrically. The curve for
Niagara silt was closely similar t o t h a t for iron ore, only differing by being 0 to 10% higher
i n the range 0.02 t o 0.06 m m
TFYPFRdrUE, 'F
20 32 3 1 W) 29 28 27 26 25 24 23 22
MOISTURE CONTEHT
.
33 % DRY WT. I TEMPERATURE. 'C Y L rFYPERdrLRF, 'F ,% 2 20 32 31 M 29 28 27 26 25 24 23 I 22 I[
.21 IFREEZINGI C 4 L / W / O s - - 0 - 5 .C 4 - 1 7 ( 7 ,,AWl,,G 1, , TOTAL UOISTURE CONTEHTl 21.9 % ORY WT.
TEMPERATURE, 'C
m:
-
FREEZHG RUH-
THAWW EW4 - UHFROZEHFig. 5. Specific heats and apparent specific heats of Leda clay a t natural moisture contents
(a) 33% dry weight and (b) partly dried (21,90,6 d r y weight). I n the latter case, freezing began a t a temperature of -0.99'C; two thawing curves are shown, corresponding to mini- m u m temperatures during freezing of -8.3"C and -1.4"C
8
P. J . W I L L I A M SDifferent values of apparent specific heat are obtained depending on whether tlie soil is
freezing or thawing and in the latter case on the lowest temperature reached during freezing
(Fig. 5(b)). This may be compared with the different moisture contents under similar stresses
which exist in porous materials undergoing drying in the one case and wetting in the other.
In the case of compressible soils, a freezelthaw cycle on previously unfrozen soils gives
results different from those obtained in subsequent tests. This is illustrated by the examples
in Figs G(b) and G(c). I t will be seen that in the latter example the apparent specific heat for
temperatures of -0.5"C to -3.0°C are smaller, whereas tlie heat quantities involved between
0" and -0.5"C are larger in the second freezing tlian in the first. In this respect, freezing
may be regarded as similar to drying, which is well known as causing consolidatio~l (see e.g.
Warkentin and Bozozuk, 1961) and a corresponding change in the stress/moisture content
relationships of compressible soils. After the second freezing, subsequent freezelthaw cycles
do not increase the effect significantly unless carried out to even lower temperatures. The
effect of subsequent freezing to temperatures lower than about -2.5"C is small, in any case.
I t is to be expected that consolidation due to applied loads will similarly result in somewhat
different apparent specific heats. I t might be noted that the different apparent specific heats
observed on freezing and on thawing are not solely the result of consolidation during the
freezing (or "drying") process, since they occur even in the case of non-compressible soils.
Particularly important is the effect shown, for example, by comparison of Figs 5(a) and
5(b) where apparent specific heats were determined on a saturated sample and on a similar
sample from which about one third of tlie water was removed by drying. The apparent
specific heats for temperatures below -0.5"C were rather similar in both cases. This illus-
trates the point that there is a considerable amount of water held in soils, which freezes in the
range 0°C to perhaps-0.2"C, and which can be varied or even totally removed with little alter-
ation of the apparent specific heats for lower temperatures.* Slightly lower apparent specific
heats are to be expected when the total moisture content is very high. This is because, per unit
weight, there will be more ice and less soil material. As the apparent specific heats are largely
composed of latent heat of freezing of water under the influence of the porous structure of the
soil, the latent heat quantity will be reduced if there is less soil mateiial.
VALUES O F APPARENT SPECIFIC HEATS F O R APPLICATION I N F I E L D PROBLEMS
Considerations involved
in
comparison of experimental andJield values
Because of the wide variety of soil type and moisture content, and the complex relation-
ships involved in the freezing of soil water, it is rarely possible to estimate precisely the heat
quantities involved in temperature changes below O°C, on the basis of grain-size composition.
Even for soils tested calorimetrically, field conditions may be such as to give rise to values
substantially different from tliose determined experimentally. The important factors will be
summarized here.
1. In the finer-grained, so-called frost susceptible soils, substantial quantities of water
migrate to the freezing soil, the amount depending, among other factors, on water avail-
ability, rate of freezing, and soil type (see e.g. Penner, 1958). The addition of water in
this way cannot, of course, occur to the calorimeter sample (although internal migration will
occur). Large quantities of heat are involved in the freezing of this additional water. I t
is not possible to predict the amount accurately but it can be allowed for by measurement
of the total moisture content of the frozen soil.
2. Theoretical considerations, based on the work of Schofield, 1935
;
Edlefsen and Ander-
son, 1943; el al., suggest that over-burden pressures or high pore-air pressures, will change
*
This and the ensuing remarks are more easily understood when i t is remembered that most of the icein freezing soils is in discrete (and often quite large) masses larger than pore size. Variation in size of the ice masses will not alter the pore structure and neither therefore the freezing temperatures of the remaining unfrozen water within the pores.
TEMPERATURE 30 3 2 31 3 0 29 28 27 26 25 24 23 22 * F LEDA CLAY G C - 8 30 32 31 30 29 28 27 26 25 24 23 22 *F LEDA CLAY GC-8 3o 32 31 30 29 28 27 26 25 24 23 2 2 O F LEDA CLAY G C - 8 TEMPERATURE LEGEND:
-
FREEZING MJN 0-0 THAWING RUN-
UNFROZENFig. 6. Specifk heats and apparent specif?c heats of Leda clay GC-8. (a) and (b) show the results of identical tests on identical samples, and illustrate the reproducibility of the calorimetric observations. (b) and ( c ) illustrate the different results obtained on flrst freezing (b) and second freezing (c) of a sample
10
P. J . WILLIAMSthe amount of water that freezes over a given temperature range. There will be corres-
ponding changes in apparent specific heats. At present these effects are not fully under-
stood quantitatively but they are probably of little significance at one to two metres depth
in the ground, without other over-burden (compare Penner, 1959).
3.
Although the freezing of water in soils at temperatures below 0°C is broadly related
to the pore sizes and void ratio and thus to grain-size composition of the soil, other effects,
especially those due to salts and to surface forces of the clay particles, may be significant.
Thus, Leonards and Andersland (1960) give information on the freezing of a clay, which,
on the basis of grain-size composition alone, does not seem compatible with the findings
presented in this paper. Except possibly for obviously saline soils, the occurrence of these
effects is not easily predictable at present without calorimetric tests.
Work recently completed indicates that the suction-moisture content relationship of a
soil can be used to obtain a good estimation in many cases, of the apparent specific heat. This
will
be considered in a subsequent publication.
CONCLUSIONS
1. Determinations of the apparent specific heats of various soils at temperatures below
about 0.5"C have been made and are presented graphically. The heat quantities involved in
warming and cooling through 0" to -0.5"C are also given.
2.
Apparent specific heats are dependent on soil type, being generally larger for finer-
grained soils.
3.
For a given soil apparent specific heats are dependent on:
(a)
The temperature, being in general larger at temperatures nearer 0°C.
(b)
Whether the soil is freezing or thawing and, in the latter case, the lowest temperature
reached during freezing.
(c)
In compressible soils, whether the soil has been previously frozen and thawed, or dried
and rewetted, and if so, to what extent.
Differences in total moisture content, however, within the range that might occur naturally
have little effect on the apparent specific heats for temperatures below about -0.5"C.
ACKNOWLEDGEMENTS
This Paper is a contribution from the Division of Building Research, National Research
Council, Canada, and is published with the approval of the Director of the Division. Tech-
nical assistance was provided by R. Armour; discussions with L. W. Gold and other members
of the Division are also gratefully acknowledged.
REFERENCES
EDLEFSEN. N. E. and A. B. C. ANDERSON, 1943. "Thermodynamics of soil moisture." Hilgardia, 15:2:
31-298.
CRONEY, D. and J. D. COLEMAN, 1961. "Pore pressure and suction in soil." I n : Pore pressacre and suction
i n soils. Butterworths, London. pp. 31-38.
LEONARDS, G. A. and 0. B. ANDERSLAND, 1960. "The clay water system and the shearing resistance of
clays." Research Conf. Shear Strength Soils, June 1960. A m e r . Soc. civ. Engrs, pp. 793-818.
PENNER, E., 1956. "Soil moisture movements during ice segregation." Highw. Res. Brd, Bull. 135, pp.
109-1 18.
. . .
PENNER, E., 1959. "Pressures developed in a porous granular system as a result of ice segregation."
Highw. Res. B r d , Special Report 40.
SCHOFIELD. R. K.. 1935 "The DF of the water in soil." Third Coner. Soil Sci.. 2 :37-48.
WARKENTIN, B. P. and M. B O Z ~ Z U K , 1961. "Shrinking and swelli& of two Canadian clays."
Fifth I n t . Conf. Soil Mech., 1 :851-855.
WILLIAMS, P. J., 1963. "Specific heat and unfrozen water content of frozen soils." I n : Proc. First Can.
Conf. o n Permafrost. (National Research Council, Associate Committee on Soil and Snow Mechanics
UNFROZEN WATER CONTENT OF FROZEN SOILS
AND SOIL MOISTURE SUCTION
by
P. J. W I L L I ~ ~ M S *
S Y N(
The unfrozen water content of various soils has been measured by calorimeter. The suction- moisture content characteristics of t h e same soils were also determined a t rooin temperature, with conventional prcssure plate and pressure membrane apparatus. Using the values of unfrozen water content measured during freezing, and t h e suction characteristics obtained during drying, a relation was found between the two scts of results. The relationship approximates t h a t of Schofield, between suction and initial freezing point, of soils a t various
moisture contents. Knowledge of the relationship
permits prediction of t h e amount of water remaining unfrozen in a soil a t negative temperatures down t o
-1.O0C and often somewhat lower. Such pre-
diction requires only determination of suction- moisture content characteristics by conventional methods together with a simple determination of the freezing point of an extract of t h e soil solution. I n many cases, the accuracy of the prediction is apparently as great as can be obtained using even complex calorimetric methods. Using these rela- tively easily determined values of unfrozen water content a t various temperatures, realistic estimates can be made of the apparent specific heats of frozen soils. The observcd relationship provides a b a s s for studies of t h e effects of both load and tempeia- ture, on the proportions of ice and water in frozen soils and on the state of stress within the ice and unfrozen water.
L a teneur en eau non gel& de divers sols, a 6tB mesurCe par calorinli-tre. Les caracteristiques des teneurs eau-succion des rnemes sols furent aussi
determinees h la tempkrature ambiante, avec
plaque con\~cntionnelle de pressioil et appareil a
ineinbrane de pression. E n utilisant les valeurs des teneurs en eau non gel& mesurCes pendant la congelation, et les caracteristiques de succion ob- tenues pendant le sCchage, un rapport fut trouvC entre les deux series de resultats. Le rapport se rapproche d e celui de Schofield, entre la succion e t le point initial de congelation de sols de diverses teneurs en eau. L a connaissance du rapport permet de prCdire la quantitC d'eau restant non gelbe dans le sol h une tempCrature descendant jusqu'a -1.O0C et souvent quelque peu plus basse. Une telle prediction nkcessite seulement la determination des caracteristiques de la teneur eau-succion par les methodes conventionnelles, ainsi qu'une determina- tion simple du point de congelation d'un prC1i-ve- ment d e solution du sol. Dans beaucoup de cas, l'exactitude de la prediction est apparemment aussi grande que celle qui peut &tre obtenue insme en utilisant des methodes calorimCtriques com- plexes. E n utilisant ces valeurs determinkes d'une inanii-re relativeinent facile de teneur en eau non
gel& diverses temperatures, on peut faire des
Cvaluations rtalistiques dcs chaleurs specifiques
apparentes des sols gel& Les rapports ob-
serves fournissent une base pour les etudes des effets h la fois de charge e t de temperature, sur les proportions de glace et d'eau dans les sols gel& e t sur 1'Ctat des contraintes dans la glace et l'cau non gel&.
INTRODUCTION
Early studies of the freezing of soil moisture were mainly concerned with the determination
of a freezing "point", that is, the temperature at which freezing commences in a sample
(Bouyoucos and McCool, 1916). More recently it has been realized that the freezing of water
in finely porous materials takes place over a range of temperatures (Lovell, 1957; Institut
hilerzlot., 1953-57)
;and that the equilibrium freezing temperature varies in different parts of
the soil water. The greatest depression of tlle freezing point below 0°C presumably occurs in
water that is most firmly held and is closest to the soil particles.
Schofield (1935) showed that as the moisture content of soil samples is reduced the freezing
point is depressed further below 0°C. Schofield carried out investigations on the suction with
which water is held in soil and showed clearly that as the water content of the sample is
reduced the suction to be applied to a column of water in contact with the soil (as in t h e
suction plate apparatus) must be increased if water is not to enter it. He argued that this
*
Research Officer, Snow and Ice Scction, Divisioil of Building Research, National Research Council,Ottawa, Canada. Research Fellow, Norwegian Geotechnical Institute, Oslo, 1963. 1964. 11
12
P . J . W I L L I A M S"pressure deficiency" or suction o f t h e soil water is m a i n l y responsible for t h e freezing point
depressions observed; and proposed and verified experimentally t h a t a relationship exists
between t h e pressure deficiency a t a given moisture content and t h e temperature at which t h e
water i n t h e soil ( i n t h e absence o f supercooling) begins t o freeze.
Comprehensive calorimetric investigations o f t h e freezing o f a variety o f soils h a v e recently
been carried o u t ; some are described i n t h i s Paper. T h e y allow calculation o f t h e a m o u n t s
o f unfrozen water present i n t h e soils a t various negative temperatures. T h e s e amounts m a y
b e said t o h a v e freezing points (i.e. t o start t o freeze) at those temperatures. Accordingly
there might b e expected (as pointed out b y Croney, Coleman, and Black 1958), a relationship
similar t o t h a t proposed b y Schofield, between t h e temperature associated w i t h a certain
content o f unfrozen water and t h e suction associated w i t h t h e same moisture content i n t h e
soil (measured at room temperature). T h e establishment o f such a relationship would h a v e
theoretical and practical interest and would allow, without t h e necessity for elaborate calori-
metric tests, prediction o f t h e unfrozen water contents o f a soil a t temperatures below 0°C
( o n t h e basis o f determination o f t h e moisture-content-suction characteristics o f t h e soil).
T h i s Paper gives observations, determined calorimetrically, o n t h e unfrozen water content o f
soils and o n t h e suction-moisture content characteristics o f t h e same soils. A relationship
between these t w o quantities is shown t o exist and is discussed.
EXPERIMENTAL METI-IODS
T h e deternzinatiox o j z~lzJvo,-en
water coqztent
in freeziqzg soils
A
calorinleter was constructed t h a t permits t h e determination o f t h e heat quantities
required t o raise or lower t h e tenlperature o f soils b y a measured a m o u n t . W h e n expressed
as calories/g/"C this value is t h e specific heat. I f freezing temperatures are involved, i t is
usually markedly temperature-depende~lt, and i n this Paper is called "apparent specific heat"
because i t includes some latent heat o f fusion. A full description o f t h e apparatus, together
w i t h observations o n t h e apparent specific heal o f soils, has been given recently (Williams,
1964 ( a ) ) .
T h e soil sample (about 120 cc volume) is contained i n a sample holder inside a n outer con-
tainer. During warming tests heat is supplied t o t h e sample a t a measured rate through a
heating coil wound o n t o t h e sample holder. T h e outer container is maintained a t t h e same
temperature as t h e sample holder so t h a t there is n o loss o f heat externally. During cooling
tests t h e outer container is maintained a t a tempel-ature lower b y a constant amount t h a n
t h a t o f t h e sample holder. T h e r e is t h e n a steady and ltnown passage o f heat f r o m t h e
sample holder t o t h e outer container and t h e exterior.
S u c h measurements permit t h e calculation o f t h e a m o u n t o f unfrozen water present i n a
frozen soil a t various negative temperatures. T h e method has been outlined (Williams, 1963).
T h e unfrozen water content a t a given temperature is dependent o n whether t h e temperature
is reached b y cooling or warming. T h e present Paper is concerned only w i t h t h e former case.
I n calculating t h e unfrozen water content o f a frozen soil t h e time/temperature record
(obtained during warming or cooling o f a specimen) is divided into increments, AT,, o f 0.13 CO
(other values occasionally being used). T h e q u a n t i t y o f heat associated w i t h t h e change o f
temperature o f t h e sample holder, soil, ice and water is subtracted f r o m t h e q u a n t i t y o f heat
removed f r o m t h e sample i n t h e t i m e t a k e n for t h i s temperature change. T h e remainder is
t h e latent heat involved i n freezing or thawing o f water. B y adding t h e quantities o f ice
formed i n each increment o f temperature change (starting w i t h t h e temperature o f initial
freezing), and b y making appropriate corrections for t h e changing proportions o f ice and water,
t h e amount o f ice present a t a n y temperature can b e calculated. T h i s q u a n t i t y is deducted
f r o m t h e total moisture content t o give t h e unfrozen water content. T h e s e calculations
Unfrozen water content of sample (g) :
Tz
AH
-(K,
+
cal const)AT,
+
(K,,
-Ki)IAT,
total inc (g)
-2
79.68
-
.
(1)
Tin
where
AH
=quantity of heat removed to lower temperature of sample by AT,
ATc
=temperature change of sample
I{,
=specific heat of wet soil (from determinations in unfrozeil state)
cal const
=heat required to change temperature of sample holder, cal/"C
K,,
=1 cal/g/"C (i.e. specific heat of water)
K i
=0.508 cal/g/"C (average value of specific heat of ice)
Tin
=temperatui-e at which freezing commences
T,
=temperature a t which unfrozen moisture content is required
I
=amount of ice present a t temperature of warm end of interval AT, (change
in the amount of ice present as the temperature changes through AT, was
ignored; the resulting error in the expression
(K,,
-ICi)
IAT, is not signifi-
cant)
79.68
=latent heat of freezing of water, cal/g.
The results of observations on several soils are given in Figs 2 to
5,
where the unfrozen
moisture content expressed as a percentage of the dry weight is shown as a function of
temperature during cooling (freezing). The grain size composition and a brief description
of each soil are given in Fig.
1.
I n compressible soils a t a given temperature the unfrozen water content of a sample that
has been frozen previously differs from that observed during the first freezing. The observa-
tions, therefore, include both cases. I n determinatioils carried out on soils previously frozen
and thawed (Figs 2(b), 3(b), and 4(b)) the lowest temperatures reached during prior freezing
varied somewhat (although always lower than those in the determinations themselves). The
unfrozen water content subsequently determined did not appear to be affected by these
variations.
Accz~racy of the calorinaetric investigations
I n calibration tests with water a standard deviation of 4% from the true value for specific
heat was found in five tests; the average of the five results was within 1%. I n tests with
frozen soils further considerations are necessary. The greater part of the
4%
error is due
to an unmeasured loss or gain of heat in the sample during tests (Williams, 1964(a)). During
prolonged tests it was often possible to rectify this so that a value better than
&
4%
could be
expected. The calculated quantities of ice formed or melted should also be accurate to well
within these limits. When the ice quantity, and subsequently the unfrozen water, is
expressed as a percentage of dry weight, the latter may be in error b y a maximum of 0-5 to
2% dry weight (depending on the total moistui-e content) at, for example,
-5°C. The error
does not accumulate as lower temperatures are reached, except insofar as
I
in the expression
(I<,
-ICi)IAT, may be in error, and this expression has only a small effect on the whole
calculation.
This accuracy is also indicated by a series of repetitive, though not entirely similar, tests
on Leda clay (Fig. 4(b)). &lore serious are the errors associated with measurement of the
1 4
P. J . W I L L I A M Ssample temperature, especially within the temperature range 0" to
-
1°C, on account of the
rapid change of unfrozen water content with temperature. The sample temperatures were
usually measured to an accuracy of
+
O.O5"C, but occasionally to an accuracy of
-0.075"C.
The curves can be displaced by this amount, and this will result in possible errors in unfrozen
water content of about
2
to 3% dry weight and occasionally more. Most of the curves
given in this Paper are more accurate than these figures indicate because they are based (as
noted in each figure) on more than one test.
Repeated tests on the same sample (Fig. 4(b)) showed no difference, within the limits of
experimental error, in unfrozen water content for a wide range of freezing rates. The tem-
peratures, therefore, can be regarded as true equilibrium freezing temperatures. Tem-
perature differences within the sample were very small and always less than 0.05"C.
Fig.
.
1. Grain size composition and other charac- teristics of soils investigated:NS - Niagara silt
WCB - Undisturbed, mottled, montmorill- onite clay; Winnipeg
LC-GC8 - Undisturbed Leda (marine) clay, mainly illite (for analysis, see Lambe and Martin, 1956); Green's Creek, Ottawa
LC-KNB
-
Remoulded Leda (marine) clay, mainly illiteI 0 - Haematitic iron ore, friable; Schefferville, P.Q.
C L A Y
I
Fin,1
SILT/
L O A ~ S E .I
A:. 1.T G 4 A l N 5::i CLASs/,P:LA,'/O.V
T h e determifzntion of the
sz~ctiolz-nzoistz[re-content
characteristics
I n the simplest form of apparatus for determining the suction-moisture-content character-
istics of a soil, the sample rests on a porous plate to the underside of which is attached
a
column of water (Croney, Coleman, and Bridge, 1952). Various suctions are applied to this
water, usually by means of a mercury manometer. At each suction the soil is allowed t o
establish its equilibrium moisture content, which is then determined. Because of the
limitation on the suction that can be applied to a column of water, this method can be used
only over a very limited range of soil moisture content.
In the present investigations, therefore, pressure plate and pressure membrane apparatus
were used (Richards, 1947). Instead of placing the water source under reduced pressure, it is
maintained a t atmospheric pressure and the air pressure around the sample is raised. I t is
generally assumed that the air pressures are numerically equivalent to the suction* that would
*
The word "snction" is now generally used in soil studies, to describe the property of the soil watersystem being measured here (ISSMFE, 1961). I t does not imply, however, that the "pressure deficiency"
of the water in the soil is limited to between 0 and 1 atmosphere. Furthermore, there is controversy
have to be applied to a column of water to produce the same moisture content in similar
samples in the suction plate apparatus. As in the suction plate apparatus, water passes out
of the sample through the plate or membrane until equilibrium is reached. Air does not
escape from the chamber in significant quantity because of the small size of the pores in the
pressure plate, which can be used at pressures up to about 1.02 kg/sq. cm, or of the pores of
the membrane in the pressure-membrane apparatus, which can be used a t pressures up to
14 kg/sq. cm. I n the case of the pressure membrane apparatus a rubber diaphragm is pressed
down by an additional air pressure of about 0.3 kg/sq. cm on to the soil sample, which is thus
maintained in close contact with the membrane.
LEDA CLAY G C - 8
N O T , D 2 E , r 9 ~ l : f N P A E F A O Z ~ h ' 6 0 1 8 1 r? ( a )
:5;
I h ' 0*
9 50-!"
I
:1
.,
"
-.
4 I F r 2 5 - ;..,
b. hP
<.
Q .o "4 1.s - - i .a 7 ) .ow
.o."
9
!0 - t o - h 85, Z 3 - 0 I t , ,\\/INNIPEG C L A Y
B
Nor PREFUOZEN p , q ~ f . q o z ~ d b o w , ,,
,
5 -( b )
-:
$ 5 0 - s,i
$45 -:I
'40-1
h LU --*v
t 2 5-
?
$ 2 0 -2
ru ' 5 - a5
- 0 " 1 'Fig. 2. Unfrozen water content Fig. 3. Unfrozen water content
during freezing of Leda clay during freezing of Winnipeg
GC-8: (a) during first freezing Clay B : (a) during first freez-
(based on observations during ing; ( h ) following previous
two tests); ( b ) following pre- freeze and thaw
vious freeze and thaw