HAL Id: hal-00301961
https://hal.archives-ouvertes.fr/hal-00301961
Submitted on 28 Nov 2005HAL is a multi-disciplinary open access archive for the deposit and dissemination of sci-entific research documents, whether they are pub-lished or not. The documents may come from teaching and research institutions in France or abroad, or from public or private research centers.
L’archive ouverte pluridisciplinaire HAL, est destinée au dépôt et à la diffusion de documents scientifiques de niveau recherche, publiés ou non, émanant des établissements d’enseignement et de recherche français ou étrangers, des laboratoires publics ou privés.
Peroxy radical chemistry and the control of ozone
photochemistry at Mace Head, Ireland during the
summer of 2002
Z. L. Fleming, P. S. Monks, A. R. Rickard, D. E. Heard, W. J. Bloss, P. W.
Seakins, T. J. Still, R. Sommariva, M. J. Pilling, R. Morgan, et al.
To cite this version:
Z. L. Fleming, P. S. Monks, A. R. Rickard, D. E. Heard, W. J. Bloss, et al.. Peroxy radical chemistry and the control of ozone photochemistry at Mace Head, Ireland during the summer of 2002. Atmo-spheric Chemistry and Physics Discussions, European Geosciences Union, 2005, 5 (6), pp.12313-12371. �hal-00301961�
ACPD
5, 12313–12371, 2005 Peroxy radical chemistry at Mace Head, Ireland Z. L. Fleming et al. Title Page Abstract Introduction Conclusions References Tables Figures J I J I Back Close Full Screen / EscPrint Version
Interactive Discussion
EGU
Atmos. Chem. Phys. Discuss., 5, 12313–12371, 2005 www.atmos-chem-phys.org/acpd/5/12313/
SRef-ID: 1680-7375/acpd/2005-5-12313 European Geosciences Union
Atmospheric Chemistry and Physics Discussions
Peroxy radical chemistry and the control
of ozone photochemistry at Mace Head,
Ireland during the summer of 2002
Z. L. Fleming1, P. S. Monks1, A. R. Rickard1,2, D. E. Heard2, W. J. Bloss2, P. W. Seakins2, T. J. Still2, R. Sommariva2,*, M. J. Pilling2, R. Morgan2,
T. J. Green3, N. Brough3, G. P. Mills3, S. A. Penkett3, A. C. Lewis4, J. D. Lee4, A. Saiz-Lopez3, and J. M. C. Plane3
1
Department of Chemistry, University of Leicester, Leicester, UK
2
School of Chemistry, University of Leeds, Leeds, UK
3
School of Environmental Sciences, University of East Anglia, Norwich, UK
4
Department of Chemistry, University of York, UK
*
now at: Aeronomy Lab, NOAA, USA
Received: 12 October 2005 – Accepted: 30 October 2005 – Published: 28 November 2005 Correspondence to: P. S. Monks (p.s.monks@le.ac.uk)
ACPD
5, 12313–12371, 2005 Peroxy radical chemistry at Mace Head, Ireland Z. L. Fleming et al. Title Page Abstract Introduction Conclusions References Tables Figures J I J I Back Close Full Screen / EscPrint Version
Interactive Discussion
EGU
Abstract
Peroxy radical (HO2+ΣRO2) measurements, using the PEroxy Radical Chemical Am-plification (PERCA) technique at the North Atlantic Marine Boundary Layer EXperi-ment (NAMBLEX) at Mace Head in summer 2002, are presented and put into the con-text of marine, boundary-layer chemistry. A suite of other chemical parameters (NO, 5
NO2, NO3, CO, CH4, O3, VOCs, peroxides), photolysis frequencies and meteorological measurements, are used to present a detailed analysis of the role of peroxy radicals in tropospheric oxidation cycles and ozone formation. Under the range of conditions encountered the peroxy radical daily maxima varied from 10 to 40 pptv. The diurnal cycles showed an asymmetric shape typically shifted to the afternoon. Using a box 10
model based on the master chemical mechanism the average model measurement agreement was 2.5 across the campaign. The addition of halogen oxides to the model increases the level of model/measurement agreement, apparently by respeciation of HOx. A good correlation exists between j (HCHO).[HCHO] and the peroxy radicals indicative of the importance of HCHO in the remote atmosphere as a HOx source, 15
particularly in the afternoon. The peroxy radicals showed a strong dependence on [NOx] with a break point at 0.1 ppbv, where the radicals increased concomitantly with the reactive VOC loading, this is a lower value than seen at representative urban cam-paigns. The HO2/(HO2+ΣRO2) ratios are dependent on [NOx] ranging between 0.2 and 0.6, with the ratio increasing linearly with NOx. Significant night-time levels of peroxy 20
radicals were measured up to 25 pptv. The contribution of ozone-alkenes and NO3 -alkene chemistry to night-time peroxy radical production was shown to be on average 59 and 41%. The campaign mean net ozone production rate was 0.11±0.3 ppbv h−1. The ozone production rate was strongly dependent on [NO] having linear sensitivity (dln(P(O3))/dln(NO)=1.0). The results imply that the N(O3) (the in-situ net photochemi-25
cal rate of ozone production/destruction) will be strongly sensitive in the marine bound-ary layer to small changes in [NO] which has ramifications for changing NOxloadings in the European continental boundary layer.
ACPD
5, 12313–12371, 2005 Peroxy radical chemistry at Mace Head, Ireland Z. L. Fleming et al. Title Page Abstract Introduction Conclusions References Tables Figures J I J I Back Close Full Screen / EscPrint Version
Interactive Discussion
EGU
1. Introduction
Peroxy radicals (HO2 and RO2, predominantly CH3O2 in semi-polluted atmospheres) can be thought of as the intermediates between the hydroxyl (OH) radical and ozone formation or destruction (Monks, 2005). Peroxy radicals also control the removal of primary pollutants such as NOx(NO+NO2) and Volatile Organic Compounds (VOCs). 5
Understanding the radical chemistry that controls ozone formation will improve our basic understanding of tropospheric photochemistry and the effect of natural and man-made emissions on ozone formation.
The relative contribution of ozone production and loss processes in the troposphere is highly sensitive to competition between the reaction of peroxy radicals with NO and their self- and cross-reactions to form peroxides. In the presence of NOx, the reaction of peroxy radicals with NO leads to the formation of NO2, which, upon photolysis, forms ozone: HO2+ NO → OH + NO2 (R1) CH3O2+ NO → CH3O+ NO2 (R2) CH3O+ O2→ HO2+ HCHO (R3) NO2+ hν (λ < 424 nm) → O(3P)+ NO (R4) O(3P)+ O2+ M → O3+ M (R5)
In conditions of low [NOx], a catalytic cycle leads to net ozone destruction, shown here for the reaction with CO:
HO2+ O3→ OH+ 2O2 (R6)
OH+ CO → H + CO2 (R7)
H+ O2+ M → HO2+ M (R8)
ACPD
5, 12313–12371, 2005 Peroxy radical chemistry at Mace Head, Ireland Z. L. Fleming et al. Title Page Abstract Introduction Conclusions References Tables Figures J I J I Back Close Full Screen / EscPrint Version
Interactive Discussion
EGU
OH oxidation and other VOCs forms peroxy radicals:
CH4+ OH → CH3+ H2O (R10)
CH3+ O2+ M → CH3O2+ M (R11)
Both urban and rural environments are affected by air pollution of photochemical origin, and the modelling of photochemical ozone formation in the British Isles from European emissions are important for the policy-makers in order to develop emission-reduction targets for ozone precursors (Metcalfe et al., 2002; Derwent et al., 2003). Ozone is one of the major components of photochemical smog, together with contributions from 5
compounds such as carbonyls, peroxy acetyl nitrates (PANs) and various nitrogen ox-ides. It has been seen in past studies in the relatively clean rural/marine conditions of Mace Head (Salisbury et al., 2001, 2002) during the EASE 96 and 97 (Eastern At-lantic Summer/Spring Experiment) and in the very clean air of Cape Grim in Tasmania (Monks et al., 1998 and 20051) at the SOAPEX 2 (Southern Ocean Atmospheric Pho-10
tochemistry EXperiment) campaign in 1998 that ozone formation is part of a natural cycle that can be easily perturbed by pollution events.
Tropical maritime air which is depleted in ozone can be advected to Mace Head over a distance of several thousand kilometres without significant net ozone formation oc-curring (Derwent et al., 1998). Measurements at Mace Head found that the site experi-15
enced more photochemical ozone production than destruction during the EASE 96 and 97 campaigns (Salisbury et al., 2002) and at ATAPEX-95 (Atlantic Atmospheric Photo-chemistry Experiment) (Carpenter et al., 1997). Cape Grim experienced far more days with net ozone destruction as in SOAPEX 1 in 1995 (Monks et al., 1998, 2000; Car-penter et al., 1997) and in 1998 at SOAPEX 2 (Monks et al., 2005). Andres-Hernandez 20
et al. (2001) also found that during the Atlantic and Southern Indian Ocean cruise of AEROSOL 99 that net ozone destruction predominated.
1
Monks, P. S., Salisbury, G., Fleming, Z. L., et al.: The role of peroxy radicals in photochem-ical destruction of ozone at mid-latitudes in the Southern Hemisphere, in preparation, 2005.
ACPD
5, 12313–12371, 2005 Peroxy radical chemistry at Mace Head, Ireland Z. L. Fleming et al. Title Page Abstract Introduction Conclusions References Tables Figures J I J I Back Close Full Screen / EscPrint Version
Interactive Discussion
EGU
Penkett et al. (1997) showed that the relationship between the sum of peroxy radicals and the ozone photolysis rate coefficient (to the singlet oxygen atom), j(O1D) can serve as a diagnostic for photochemical ozone production and destruction. In high NOxconditions HO2+ΣRO2is generally proportional to j (O1D) and in clean conditions, to √j (O1D) (Penkett et al., 1997; Monks et al., 1998; Zanis et al., 1999; Creasey 5
et al., 2003). The shape of j (O1D) throughout the day produces a typical summer peroxy radical diurnal cycle with maximum values towards solar noon, and minimum values during the night. Photolysis of other photo-labile compounds (e.g. HCHO and HONO) becomes noticeable in the early morning or evening, when the light is of longer wavelengths than those at which ozone photolysis occurs, and can lead to a broader 10
peroxy radical diurnal cycle than that expected from ozone photolysis alone.
In the absence of photochemistry, there is a series of night-time peroxy radical-producing channels. NO3 (nitrate) radical (Allen et al., 1999; Penkett et al., 1999; Salisbury et al., 2001) and ozone reactions with alkenes (Hu and Stedman, 1995; Rickard et al., 1999; Salisbury et al., 2001) were found to be two dominant channels in 15
the marine influenced atmosphere.
In this paper, by use of peroxy radical measurements coupled to a suite of sup-porting trace species measurements, the photochemical environment of Mace Head is explored. In particular, the shape, concentration and form of the diurnal cycle are explored in relation to both primary production and the potential contribution of the 20
photolysis of secondary compounds such as carbonyls (e.g. HCHO). The dependence of peroxy radical concentration with changing NOx and VOC is described. The role of both NO3 and O3-alkene reactions as night time source of peroxy radicals is investi-gated. Finally, role of the peroxy radicals in the in situ photochemical formation and destruction of ozone is quantified.
ACPD
5, 12313–12371, 2005 Peroxy radical chemistry at Mace Head, Ireland Z. L. Fleming et al. Title Page Abstract Introduction Conclusions References Tables Figures J I J I Back Close Full Screen / EscPrint Version
Interactive Discussion
EGU
2. Experimental 2.1. Site
NAMBLEX took place from 27 July to 2 September 2002 at the Mace Head Atmo-spheric Research Station (53◦200N, 9◦540W). Mace Head is located on the west coast of Ireland, 88 km west of Galway city, and is in the path of the mid-latitude cyclones 5
which frequently traverse the North Atlantic. Heard et al. (2005) describe the location in more detail, together with the local meteorology of the site, and Norton et al. (2005) provide a detailed analysis of the specific boundary layer conditions encountered dur-ing NAMBLEX. The prevaildur-ing wind direction is from a westerly marine sector but sig-nificant pollution events also reach the site from European continental air-masses, from 10
easterly directions.
2.2. Peroxy radical measurements (PERCA)
Measurements of peroxy radicals (HO2+ΣRO2) were carried out using the jointly oper-ated University of Leicester – University of East Anglia (UEA) PEroxy Radical Chemical Amplifier (PERCA IV) instrument, reported for the first time in Green et al. (2005)2and 15
Fleming et al. (2005)3. The technique was pioneered by Cantrell et al. (1984) and de-scribed by Clemitshaw et al. (1997), Monks et al. (1998) and Green et al. (2003) and the current apparatus uses a dual channel inlet and detection system (as in Cantrell et al., 1996).
2
Green, T. J., Reeves, C. E., Fleming, Z. L., Brough, N., Rickard, A. R., Bandy, B. J., Monks, P. S., and Penkett, S.A.: An improved dual channel PERCA for atmospheric measurements of peroxy radicals, J. Environ. Monitoring, in review, 2005.
3
Fleming, Z. L., Monks, P. S., Rickard, A. R., Bandy, B. J., Brough, N., Green, T. J., Reeves, C. E., and Penkett, S. A.: Seasonal dependence of peroxy radical concentrations at a Northern hemisphere marine boundary layer site during summer and winter: evidence for photochemical activity in winter, Atmos. Chem. Phys. Discuss., in preparation, 2005b.
ACPD
5, 12313–12371, 2005 Peroxy radical chemistry at Mace Head, Ireland Z. L. Fleming et al. Title Page Abstract Introduction Conclusions References Tables Figures J I J I Back Close Full Screen / EscPrint Version
Interactive Discussion
EGU
Briefly, the method relies upon the HO2and OH radical-catalysed conversion of NO and CO into CO2 and NO2 respectively, through addition of NO and CO into the inlet region viz.,
HO2+ NO → OH + NO2 OH+ CO → H + CO2 H+ O2+ M → HO2+ M
Overall : NO+ CO + O2→ CO2+ NO2 (R12)
Organic peroxy radicals are readily converted into HO2 in the presence of NO with varying efficiencies (Ashbourn et al., 1998). The yield of both CO2 and NO2 is equal to CL×([RO2]+[HO2]+[OH]), where CL is the chain length, i.e. the number of HO2/OH inter-conversion cycles that occur before radical termination. The ratio of [HO2]/[OH] ranges from ∼50–200 in the atmosphere, therefore the PERCA technique effectively 5
measures the sum of inorganic and organic peroxy radicals. The yield of NO2 is measured using commercial LMA-3 detectors (calibrated daily using NO2 permeation sources) and this is converted into [HO2+ΣRO2] using ∆[NO2]/CL. The chain length was calculated on a weekly basis, using a calibration source based upon the photol-ysis of CH3I at 253.7 nm to yield CH3O2 at varying concentrations (Clemitshaw et al., 10
1997).
Background [NO2] signals (caused by the reaction of ambient ozone with NO in the inlet) were measured by changing the addition points of the reagent gases, so that the amplification reactions are not initiated. The overall radical levels are calculated by subtracting the termination signal from the amplification signal.
15
The dual-inlet system comprises two distinct sampling systems, inlet reaction sites and detectors. The advantage of this dual-inlet system is that the two systems are run out of phase in two modes, with one in amplification and the other in termination mode. Switching the two inlets between phases on a minute time scale leads to a continuous amplification and termination signal.
20
ampli-ACPD
5, 12313–12371, 2005 Peroxy radical chemistry at Mace Head, Ireland Z. L. Fleming et al. Title Page Abstract Introduction Conclusions References Tables Figures J I J I Back Close Full Screen / EscPrint Version
Interactive Discussion
EGU
fier is reduced in the presence of atmospheric water vapour (see also Reichert et al., 2003). Salisbury et al. (2002) demonstrated that the chain length of the Leicester-UEA PERCA instrument falls approximately linearly with increasing specific humidity. From a series of laboratory experiments, a humidity correction factor equation (using ambi-ent humidity and inlet temperatures) was derived and applied to all PERCA data. In 5
order to minimise the applied correction factor, the inlet temperature was kept above ambient temperatures at the constant value of 30◦C. The humidity correction factor varied between 1.5 and 2.5 during NAMBLEX (see also Fleming et al., 2005b3).
The accuracy and precision of the dual-inlet PERCA have been assessed in detail by Fleming (2005a). The overall uncertainty for any give peroxy radical measurement is 10
38% (at 1σ) from a combination of uncertainties associated with the radical calibration, NO2 quantification and humidity correction. The precision on a 1 pptv measurement averaged over a minute assessed from the reproducibility of the radical calibration was 15%. The detection limit of the instrument was of the order of 0.5 pptv at a S/N of 1 on a 1 min average.
15
The PERCA instrument inlet box was securely attached 6 m above ground level to a tower on a temporary laboratory building (sea container) close to the main shoreline site and an umbilical line carried the reagent gases and sample lines down to the main rack in the laboratory (see Heard et al., 2005, for a site plan). The PERCA instrument took measurements continuously during the campaign in minute averages and analysis 20
was carried out with ten minute- or hourly-averaged data. 2.3. Other measurements
Meteorological data were obtained from the site’s fixed meteorological station, which recorded ambient air temperature, relative humidity, wind speed and wind direction. The other instruments were housed in the permanent cottages of the site or in similar 25
self-contained temporary buildings (sea-containers). Details of the instruments, their detection limits and accuracy are given in Heard et al. (2005).
ACPD
5, 12313–12371, 2005 Peroxy radical chemistry at Mace Head, Ireland Z. L. Fleming et al. Title Page Abstract Introduction Conclusions References Tables Figures J I J I Back Close Full Screen / EscPrint Version
Interactive Discussion
EGU
2.4. Modelling studies
The Master Chemical Mechanism (currently MCMv3.1, available online athttp://mcm.
leeds.ac.uk/MCM/) Developed by Jenkin et al. (1997) and subsequently refined and updated by Saunders et al. (2003), Jenkin et al. (2003) and Bloss et al. (2005a and b). MCMv3.1 contains the oxidation mechanisms of 135 primary emitted VOCs. This 5
mechanism was added to a campaign optimised box model used to simulate HO2, RO2 and OH radical concentrations constrained with H2, CO, CH4, O3, NO, NO2, HCHO, measured VOCs, chloroform, temperature and various photolysis rates measurements. In general, the most complete model shown in this analysis is termed “full-oxy” and is detailed extensively in Sommariva et al. (2005a). The model was constrained to CO, 10
CH4, 23 hydrocarbons, 3 oxygenates and 2 peroxides and to temperature and photol-ysis measurements. OH and HO2 model/measurement comparisons are reported in Smith et al. (2005), Sommariva et al. (2005a) and night-time HO2 and RO2 in Som-mariva et al. (2005b)4. Model results at NAMBLEX for HO2 were in much better agreement with the measurements when the model was additionally constrained to 15
measured halogen oxides (Sommariva et al., 2005a; Bloss et al., 2005c).
3. Results
3.1. Meteorological conditions
Local wind speed and direction measurements were recorded on an hourly basis dur-ing NAMBLEX. Durdur-ing the EASE campaigns Salisbury et al. (2002) and Rickard et 20
al. (2002) divided all the data into five sectors, according to local wind direction. 4
Sommariva, R., Ball, S. M., Bitter, M., Bloss W. J., Fleming, Z. L., Heard, D. E., Jones, R. L., Lee, J. D., Monks, P. S., Pilling, M. J., Plane, J. M. C., and Saiz-Lopez, A.: Night-time radical chemistry during the NAMBLEX campaign, Atmos. Chem. Phys. Discuss., in preparation, 2005b.
ACPD
5, 12313–12371, 2005 Peroxy radical chemistry at Mace Head, Ireland Z. L. Fleming et al. Title Page Abstract Introduction Conclusions References Tables Figures J I J I Back Close Full Screen / EscPrint Version
Interactive Discussion
EGU
More detailed boundary layer structure measurements in combination with back tra-jectory analysis during the NAMBLEX campaign is described by Norton et al. (2005). However, caution must be used when assigning air-mass sectors only according to local in-situ wind direction as measurements during the NAMBLEX data did not neces-sarily correspond with the origin of the air-mass back-trajectory analysis. For example, 5
there were a number of land-sea breeze events (particularly at night). From 1 to 5 August, these breeze events brought local easterly winds to the site during westerly trajectories.
The British Atmospheric Data Centre’s (BADC) trajectory service (http://www.badc.
nerc.ac.uk) was used to plot five-day air-mass back-trajectories at six-hourly intervals. 10
According to the origin of the air-masses of these trajectories, a new division into seven areas of origin was developed as shown in Tables1,2and 3. The most common air-mass sector was the north-westerly (NW), followed by westerly (W) and then south-westerly (SW) as shown in Fig. 1a (see also Heard et al., 2005). Examples of three typical NW, W and north-easterly (NE) air-mass sector back-trajectories are shown in 15
Fig. 1b. The effects of local sea and coastal breezes were removed from the analysis by only selecting data where the local wind speed was greater than 3 m s−1(Salisbury et al., 2002).
Table1shows the average HO2+ΣRO2, NOx, CO, CH4, O3, CH3OOH, H2O2, HCHO, DMS, isoprene, benzene and methanol mixing ratios and j (O1D) for the corresponding 20
air-mass sectors. The data in Table2 corresponds to the daylight (06:00–19:00) av-erages. Table3shows the night-time concentrations of the same species, as well as [NO3] and total alkenes.
3.2. Chemical climatology
Heard et al. (2005) provide a comprehensive overview of all the other species and 25
ACPD
5, 12313–12371, 2005 Peroxy radical chemistry at Mace Head, Ireland Z. L. Fleming et al. Title Page Abstract Introduction Conclusions References Tables Figures J I J I Back Close Full Screen / EscPrint Version
Interactive Discussion
EGU
3.2.1. Peroxy radical levels and diurnal cycles
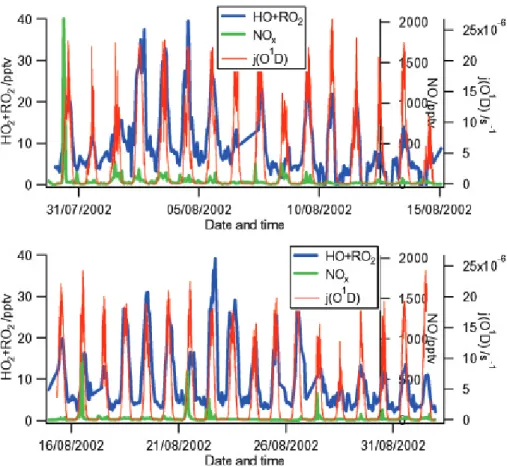
The data in Table1and the peroxy radical time series in Fig. 2 show that peroxy radical concentrations are highest when the air is of continental origin (S, E and NE air-mass sectors). Also the concentrations of NOx, isoprene and formaldehyde were significantly higher in these sectors than in the marine W sector.
5
The lowest peroxy radical concentrations during the campaign were near the detec-tion limit of the instrument (see experimental secdetec-tion) at around 1 pptv but were rarely less than 4 pptv, even at night. The maximum peroxy radical concentration reached 60 pptv for the occasional short-lived spike and 40 pptv for midday maximum values (see Fig. 2). Generally, the day-time peroxy radical concentrations were between two 10
and three times higher than night-time levels.
The campaign average [HO2+ΣRO2], [NOx] and j (O1D) diurnal cycles and the W and NE air-mass sector-averaged diurnal cycles are shown in Fig. 3. Peroxy radicals track the j (O1D) diurnal cycle fairly closely, with the cycle being shifted towards the end of the day as high midday concentrations persist well into the afternoon. This form of 15
asymmetrical diurnal cycle has been noted before in low-NOxenvironments by Monks et al. (1996) at Cape Grim, Carpenter et al. (1997) at Mace Head in 1995, and in high NOx environments by Holland et al. (2003) and Mihelcic et al. (2003) at the BERLIOZ campaign near Berlin. In each of these environments there are different mechanisms that drive this asymmetry. The peroxy radical diurnal cycle for the W air-mass sector 20
has less relative variability, tracking j (O1D) with a slight bias in maxima towards the afternoon. The NE sector peroxy radical diurnal is broader in both the morning and the evening. The S sector diurnal cycle (not shown) follows a similar pattern to the NE average in that it has a broader shape in both the morning and the afternoon.
An extensive modelling study by Sommariva et al. (2005a) has investigated the im-25
pact of oxygenate and halogen chemistry on the radical chemistry. Table4shows the sensitivity of the average model/measurement agreement for HO2+ΣRO2with varying model assumptions. Figure 4a shows the results using the full oxygenate chemistry
ACPD
5, 12313–12371, 2005 Peroxy radical chemistry at Mace Head, Ireland Z. L. Fleming et al. Title Page Abstract Introduction Conclusions References Tables Figures J I J I Back Close Full Screen / EscPrint Version
Interactive Discussion
EGU
constrained to measured IO with corrected heterogeneous uptake model and mea-sured peroxy radical concentrations for the 15–22 August, and the same model run with the measured HO2from the FAGE instrument (Smith et al., 2005). For the model run with full oxygenate chemistry constrained to measured IO with corrected hetero-geneous uptake (see Table 4), the peroxy radical measurement-model agreement is 5
within the uncertainty of both the model and measurements. In general, the radical measurements are slightly higher than the model during the day-time. However, the model HO2 constantly over-predicts the measured HO2 concentrations, by at least a factor of 2–3 (Sommariva et al., 2005a). Inclusion of the halogen chemistry, in terms of measured IO seems to give some small improvement in the agreement. It is worth not-10
ing that there is some evidence for spatial inhomogeneity in the [IO] and the “local” [IO] could be a factor or 10 higher than that measured by long-path DOAS methods (see Sommariva et al., 2005a; Smith et al., 2005). The effect of halogens on the partitioning of NO and NO2and OH and HO2is dealt with later. Figure 4b shows a correlation plot of modelled PERCA peroxy radical (full+oxy, heterogeneous with IO chemistry, see Ta-15
ble4) concentrations against measured values for all fifteen minute-averaged data and also the hourly-averages with their corresponding standard deviation. From Fig. 4b, there is a good correlation with the slope=1.02 (R2=0.73). At low [HO2+ PRO2], the model-measurement comparison lies below the 1:1 line. At higher [HO2+ PRO2], there is a wider spread of data and the model, particularly for the hourly averages around 20
solar noon over-predicts the measured peroxy radical levels.
j (O1D),√j (O1D) vs. [HO2+ΣRO2] correlations and diurnal cycles for the 23 and 24 August are shown in Fig. 5. The back trajectories shown in Fig. 5 suggest a SW air-mass origin on 23 August coming off the French coast, bringing higher concentrations of CO, CH4, acetone, methanol and NOx. The following day, the air-mass changes 25
to a cleaner NW origin, where the NO/NOx ratio and [NMHC] are significantly lower. The narrower shape of the diurnal cycle on 24 August could be due to a reduction in species that could be photolysed to form peroxy radicals.
ACPD
5, 12313–12371, 2005 Peroxy radical chemistry at Mace Head, Ireland Z. L. Fleming et al. Title Page Abstract Introduction Conclusions References Tables Figures J I J I Back Close Full Screen / EscPrint Version
Interactive Discussion
EGU
(23 August), the peroxy radicals have a broader shape than j (O1D). The correlation with both j (O1D) and√j (O1D) (r2=0.87 and 0.89, respectively) is good on the NW day but poor (r2=0.30 and 0.43) on the SW day. Since the correlation with j(O1D) on the SW day is poor, this is suggestive of an increased secondary source of HOx from the photolysis of other compounds. This is particularly apparent in the early morning and 5
the evening.
Photolysis of species other than O3(e.g. HCHO, HONO, H2O2, CH3O2H) could lead to a broadening of the peroxy radical diurnal cycle noted in the afternoon or early morn-ing, when j (O1D) (primary production) is reduced. [HO2+ PRO2] vs. j (HCHO) corre-lations are divided into five different periods of the day in Fig. 5. On the 23 August, the 10
largest increase in peroxy radicals as j (HCHO) increases was seen at 06:00–08:00 and 15:00–17:00. Despite the large increase in peroxy radicals with increasing j (HCHO) between 06:00 and 08:00, the j (HCHO) values were very low and would not have led to significant peroxy radical formation from this channel alone. Between 17:00–19:00 the product j (HCHO).[HCHO] was significantly large as to produce peroxy radicals at 15
this time when j (O1D) was greatly reduced. The 24 August showed very poor trends. The same form of analysis with j (HONO) showed no observable trends (N.B. [HONO] estimated).
Figure 6a shows the campaign averaged [HCHO] and [HO2+ PRO2] diurnal cycles and the amount of HCHO photolysed each hour (j (HCHO).[HCHO]). Formaldehyde 20
has a shifted diurnal cycle with values persisting into the evening. Daily maximum [HCHO] were around 1.6 ppbv (Still et al., 2005), much higher than the 0.2–0.8 ppbv found during a comparable campaign at Mace Head (Cardenas et al., 2000). The relative performance of the different HCHO measurement methods are discussed in Still et al. (2005).
25
Figure 6b shows correlation plots of [HO2+ PRO2] and [HCHO] against the amount of formaldehyde photolysed per hour (j (HCHO).[HCHO]). Both peroxy radicals and formaldeyde show a good correlation with formaldehyde photolysis. Formaldehyde is both a source of peroxy radicals (through photolysis and OH oxidation) and is
pro-ACPD
5, 12313–12371, 2005 Peroxy radical chemistry at Mace Head, Ireland Z. L. Fleming et al. Title Page Abstract Introduction Conclusions References Tables Figures J I J I Back Close Full Screen / EscPrint Version
Interactive Discussion
EGU
duced from the peroxy radical reactions with NO. Figure 6b correlates peroxy radical and formaldehyde concentrations to the HO2production rate from formaldehyde pho-tolysis. In the radical channel (14), one HCHO molecule yields two HO2 molecules upon photolysis
HCHO+ hν → H2+ CO (R13)
→ H+ HCO (R14)
H+ O2+ M → HO2+ M (R8)
CHO+ O2→ HO2+ CO (R15)
Overall : HCHO+ O2+ hν → 2HO2+ CO (R16)
The good correlation is suggestive of persistent peroxy radical levels in the late after-noon having a major contribution from formaldehyde photolysis.
An interesting phenomenon was observed on a number of days (namely the 9, 15, 5
17 and 31 August and 1 September); when the solar intensity and photolysis rates showed a sudden increase in the early evening and a disproportionately large peroxy radical increase was observed. On 21 August (see case day 21 August in Fig. 7a) a peak in the j (O1D) was accompanied by a sudden peroxy radical increase at around 17:00. The same increase in [OH] was observed by (Smith et al., 2005) on this day, and 10
was reflected in the modelled [OH] (Sommariva et al., 2005a). The HO2measurements did not show a similar increase. One possible explanation for the phenomena is that if there are clouds at a given height as the sun nears the horizon light passes beneath the cloud at high zenith angles, rather than been attenuated by them, giving a short-lived boost to photochemical peroxy radical production (see for example, Monks et al., 15
ACPD
5, 12313–12371, 2005 Peroxy radical chemistry at Mace Head, Ireland Z. L. Fleming et al. Title Page Abstract Introduction Conclusions References Tables Figures J I J I Back Close Full Screen / EscPrint Version
Interactive Discussion
EGU
3.3. Peroxy radicals and NOx
NOxconcentrations of greater than 0.5 ppbv and up to as high as 2 ppbv were reached on 1–4 August and 8, 16 and 21 August (see Fig. 2). Between 1–4 August, air ar-rived from the E air-mass sector and the trajectories on the 8, 16 and 21 August were classified as W, despite some local polluted SE winds. [NOx]/[NOy] were higher than 5
average on the 13, 14 and 16 August (days where local pollution re-circulated at the site). All the case days (8 August, 16 August and 21 August) in Figs. 7a, b and c had very high [NOx] and a peroxy radical diurnal profile that is shifted towards the evening. This may be due to a suppression of peroxy radical formation when NOxwas high, and a sudden period of formation later in the day when NOxlevels dropped.
10
The campaign average [NOx] diurnal cycle is shown in Fig. 3. The values are highest between 09:00 and 12:00. High NOxlevels in the morning suppress via the repartition-ing of HO2to OH. Peroxy radical concentrations and this NOxsuppression may, indeed, contribute to the apparent shift in the peroxy radical diurnal cycle. On the 16 August in Fig. 7b a sudden NOxspike in the morning perturbed the peroxy radical concentrations, 15
moving the apparent maximum towards the afternoon.
Peroxy radical concentrations vs. binned [NOx] (on a logarithmic scale) for all 10-min data are shown in Fig. 8a. The peroxy radicals were divided into three regimes according to j (O1D) values; j (O1D)>7.5×10⁻⁶s−1 represents daylight val-ues, 3×10⁻⁷s−1<(j (O1D))<7.5×10⁻⁶s−1 represents dusk and dawn values or very 20
cloudy conditions and <3×10⁻⁷s−1 represents night-time conditions, which are dis-cussed later.
The data with j (O1D)>7.5×10⁻⁶s−1 (daylight hours) are used for investigating the effect of NOxon peroxy radicals during the day. Peroxy radical concentrations decrease with increasing [NOx] until values of about 0.1 ppbv [NOx]. This shift is a result of 25
changes in the HO2:OH ratios towards OH (reactions of HO2 and RO2 with NO to form NO2). Between values of 0.1 and 0.2 ppbv [NOx], there is a sudden increase in [HO2+ PRO2], which suggests a switch between NOx- and VOC-limited conditions
ACPD
5, 12313–12371, 2005 Peroxy radical chemistry at Mace Head, Ireland Z. L. Fleming et al. Title Page Abstract Introduction Conclusions References Tables Figures J I J I Back Close Full Screen / EscPrint Version
Interactive Discussion
EGU
with respect to ozone production. The corresponding increase in VOCs at [NOx] above 0.1 ppbv would lead to a rise in OH oxidation of VOCs, producing more peroxy radicals. Above 0.2 ppbv [NOx], increasing [NOx] appears to lower [HO2+ PRO2].
Hourly averaged daylight (06:00–19:00) alkane, isoprene, HCHO, CO and CH4 con-centrations, as well as peroxy radical levels, are plotted against binned NOxin Fig. 8b. 5
The right-hand axis is scaled for each hydrocarbon. The sharp increase in all VOCs at [NOx]>0.1 ppbv would have a strong link to the rise in peroxy radicals at this time. These high VOC levels change the reactive mixture with respect to peroxy radical speci-ation. Sudden NOxincreases could reflect changing air-mass composition. Concentra-tions of the biogenic hydrocarbon, isoprene peak at a lower [NOx] than the correspond-10
ing anthropogenic hydrocarbons. At higher [NOx], it is not clear which hydrocarbons govern the organic peroxy radical concentrations. Until 0.1 ppbv [NOx], the peroxy rad-ical trend with increasing [NOx] is very similar to the HCHO trend. At [NOx] between 0.5 and 1 ppbv the dependence of peroxy radicals on VOCs is very clear, as a drop in all VOCs is reflected in the peroxy radical data.
15
The rural marine boundary location of Mace Head was seen to be representative of background chemistry but polluted air masses regularly reach the site, bringing higher NOx levels than experienced in the marine W air-masses as shown in Rickard et al. (2002). The switch to a significant VOC contribution to [HO2+ PRO2] occurs at a lower [NOx] level than at more polluted continental urban locations, such as at the 20
BERLIOZ campaign where the maximum [HO2] was at 1 ppbv [NOx] (Holland et al., 2003).
3.4. Hydrocarbons and HO2/(HO2+ PRO2) ratios
The highest mixing ratio of anthropogenic source compounds such as ethene, toluene and benzene was observed between 1 and 5 August. This illustrates the more pol-25
luted VOC-laden air masses, originating from the NE sector, passing over Scandinavia, northern Britain and Ireland, as shown in Fig. 1b.
ACPD
5, 12313–12371, 2005 Peroxy radical chemistry at Mace Head, Ireland Z. L. Fleming et al. Title Page Abstract Introduction Conclusions References Tables Figures J I J I Back Close Full Screen / EscPrint Version
Interactive Discussion
EGU
by a sharp increase in DMS and this was also seen on the 17 and 30 August. DMS concentrations varied from concentrations barely above the detection limit to as high as 900 pptv, with a spike of over 1.5 ppbv on 28 July. DMS levels were highest in the W, N and SW sectors, as shown in Table1.
OH reacts with hydrocarbons, forming organic radicals, which rapidly react with O2 5
to form peroxy radicals (see Reactions 10 and 11). Lewis et al., (2005) calculated the percentage contribution to OH removal by VOCs by combining all the VOC-OH reaction rates, kVOC[VOC][OH]. Acetaldehyde accounted for up to 20%, CH4,and formaldehyde both up to 30% and the other measured non-methane hydrocarbons (NMHCs) between 10 and 15% of OH loss.
10
HO2 measurements taken by FAGE (Smith et al., 2005) provide a means of com-paring HO2with HO2+ PRO2. Figure 9a shows the measured and modelled (full+oxy, heterogeneous with IO chemistry, see Table4), hourly-averaged HO2/HO2+ PRO2 ra-tios during the period 15–22 August. The addition of halogens to the system can repartition both OH and HO2and NO and NO2(e.g. Monks, 2005) via
XO+ HO2→ HOX+ O2 (R17)
HOX+ hν → X + OH (R18)
and
XO+ NO → X + NO2 (R19)
The measured HO2/(HO2+ PRO2) ratios are lower when [NOx] is low as on 18 and 19 August and can reach values over 1 when NOx-laden air arrives at the site. The HO2/(HO2+ PRO2) ratio generally decreases from the start of the day towards sunset. The equivalent model ratio shows a similar diurnal profile from day to day, with the dis-tinct diurnal profile displaying the highest HO2/HO2+ PRO2ratios at midday. Generally, 15
the modelled HO2/HO2+ PRO2ratio is much higher than the measurement equivalent, except when NOxis high.
The correlation plot of modelled versus measured HO2/(HO2+ PRO2) ratios is shown in Fig. 9b, with the individual days marked in separate colours. The model
ACPD
5, 12313–12371, 2005 Peroxy radical chemistry at Mace Head, Ireland Z. L. Fleming et al. Title Page Abstract Introduction Conclusions References Tables Figures J I J I Back Close Full Screen / EscPrint Version
Interactive Discussion
EGU
generally over-predicts these ratios on all the days. The measured HO2/(HO2+ PRO2) ratio on 16 August (when local SE winds brought high NOx levels to the site) showed large variations throughout the day, both for the modelled and measured ratios as seen in both Figs. 9a and b. However, Fig. 9a shows that the measurement ratios displayed greater variability during the high NOxperiod on this day. The same is observed during 5
the high NOxperiod on 21 August, where the model ratio appears not to be influenced by NOxvariations.
To investigate the effect of varying NOx on the HO2/(HO2+ PRO2) ratio, a plot of HO2/(HO2+ PRO2) ratios against binned [NOx] is shown in Fig. 8c. The ratio of in-organic to in-organic peroxy radicals increases as [NOx] increases. The highest [NOx] 10
bin at 1 ppbv has been divided into smaller bins in order to study the structure at high NOx. At [NOx]>0.8 ppbv, the HO2/(HO2+ PRO2) ratio appears to decrease with in-creasing [NOx]. RO2reacts rapidly with NO to form formaldehyde, and its subsequent breakdown can lead to HO2formation.
Figure 8d shows the measured and modelled HO2/(HO2+ PRO2) ratios plotted 15
against [NOx]. Two model runs (with and without IO) are plotted to show the effect of halogens. In general, the HO2/(HO2+ PRO2) ratio is higher in the model but the model does not show a strong increase with increasing [NOx]. HO2/(HO2+ PRO2) ratios at high [NOx] for both model and measured values are very similar, but at lower [NOx] the model predicts higher HO2/(HO2+ PRO2) ratios. Interestingly, the addition of halogen 20
chemistry improves the agreement between model and measurement, indicating a role for the IO in repartitioning the OH and HO2via Reactions (16) and (17). It is clear that at low [NOx] the halogens seem to be more important. Sommariva et al. (2005) found that the model mechanism worked better at high NOx, indicating that peroxy-peroxy reactions at low NOx are still not fully understood. An earlier Mace Head campaign 25
tailored box model, without OVOC and halogen chemistry, used on Mace Head data, over-predicted HO2/(HO2+RO2) at low NOxand under-predicted at high NOx(Carslaw et al., 1999, 2002).
ACPD
5, 12313–12371, 2005 Peroxy radical chemistry at Mace Head, Ireland Z. L. Fleming et al. Title Page Abstract Introduction Conclusions References Tables Figures J I J I Back Close Full Screen / EscPrint Version
Interactive Discussion
EGU
loss term for OH. The reaction of OH with CO and HCHO leads to the formation of HO2. OH reaction with CH4 forms CH3O2 and OH reaction with VOC forms predominantly RO2. The fraction of OH removal reactions that form HO2can be represented as:
φ(CO+ HCHO) = kco[CO]+ kHCHO[HCHO] kco[CO]+ kHCHO[HCHO]+ kCH
4+ kvoc[VOC] !
[OH] (1)
where kCO, kHCHO, kCH
4 and kVOC are the rate coefficients for the reaction of OH with
5
CO, HCHO, CH4 and VOCs, respectively. The rate-coefficients were taken from the National Institute of Standards and Technology (NIST) web site.
The φ(CO+HCHO) fraction was calculated for the days that had complete CO, CH4 and VOC and HCHO concentrations, as in Lewis et al. (2005). Comparing
φ(CO+HCHO) ratios with HO2/(HO2+ PRO2) ratios should be indicative of whether 10
HO2/(HO2+ PRO2) ratio variations were caused primarily by varying HCHO, CO, CH4 and VOC concentrations.
Figure 8e shows a plot of hourly HO2/(HO2+ PRO2) and φ(CO+HCHO) ra-tios against binned [NOx]. The trend for increasing HO2/(HO2+ PRO2) with in-creasing [NOx] is not replicated for φ(CO+HCHO), which does not appear ef-15
fected by NOx. HO2/(HO2+ PRO2) ratios are always lower than φ(CO+HCHO) ratios (<0.5 for HO2/(HO2+RO2) and >0.5 for φ(CO+HCHO)). The ratio of
k[HCHO]/(k[HCHO]+k[CO]) was found to remain constant at around 0.5, showing that
HCHO and CO contribute equally to HO2formation. φ(CO+HCHO) ratios have a range of between 0.3 and 2.5 in NAMBLEX, much greater than the HO2/(HO2+ PRO2) ratio 20
range. The φ(CO+HCHO) ratios were usually much higher than HO2/(HO2+ PRO2) ratios, which suggests that modelling the VOC-OH reactivity underestimates the re-sulting RO2 concentrations with respect to HO2. Also, calculating HO2 to be directly correlated with CO and HCHO reactivity is not necessarily valid as HCHO is both pho-tolysed and is oxidised by OH to form HO2. HCHO is also formed from the reaction of 25
CH3O2with NO (Reactions 2 and 3).
ACPD
5, 12313–12371, 2005 Peroxy radical chemistry at Mace Head, Ireland Z. L. Fleming et al. Title Page Abstract Introduction Conclusions References Tables Figures J I J I Back Close Full Screen / EscPrint Version
Interactive Discussion
EGU
differing times since the last major input from pollution. It is of interest because both tracers are primary pollutants, but formaldehyde is also produced in the troposphere by oxidation of CH4 in the presence of NOx. Subsequent photolysis of this formalde-hyde then produces CO. In polluted high NOxenvironments, HCHO production is more important than its photolysis and the HCHO:CO ratio increases. Figure 10 shows that 5
both [HO2+ PRO2] and [O3] increase with increasing HCHO/CO. If higher HCHO:CO ratios are a marker for polluted conditions, then this would be likely to lead to higher ozone levels. Higher peroxy radical levels at increased HCHO suggests that HCHO is more effective at producing peroxy radicals than CO. The φ(CO+HCHO) ratio pre-sumes that HCHO and CO have equal HO2productivity, so any discrepancy between 10
φ(CO+HCHO) and HO2/HO2+ PRO2may be due to the inaccuracy of predicting HO2 from φ(CO+HCHO).
3.5. Peroxides
The highest H2O2concentrations of up to 0.5 pptv were between 1 and 3 August when NOxand hydrocarbon concentrations were high. Indeed, in Table1, high NOxand high 15
VOC concentrations in the E sector have lead to the highest peroxide concentrations. Morgan (2004) found a maximum [H2O2] of 1.1 ppbv with an average of 0.19 ppbv during NAMBLEX, much lower than the maximum of 7.1 and mean of 1.58 ppbv at Mace Head in June 1999 (Morgan and Jackson, 2002). In the clean marine boundary layer, such as Cape Grim, Tasmania, peroxy radicals are more likely to self-react to 20
form peroxides than they are to react with NO and subsequently produce ozone (Ayers et al., 1997). Thus, high levels of peroxides would signify an ozone-destroying regime and a lower turnover rate of the various species that are part of the ozone-forming cycles.
Figure 8f shows [peroxide] versus [NOx] trends that are very similar in shape to per-25
oxy radical – NOx trends in Fig. 8a, illustrating the strong link between peroxy radicals and H2O2 concentrations. H2O2 concentrations are highest at around 0.1 ppbv NOx and decrease slightly at higher NOxbut do not decrease to the same extent as peroxy
ACPD
5, 12313–12371, 2005 Peroxy radical chemistry at Mace Head, Ireland Z. L. Fleming et al. Title Page Abstract Introduction Conclusions References Tables Figures J I J I Back Close Full Screen / EscPrint Version
Interactive Discussion
EGU
radical levels at high NOx as shown in in Fig. 8a. CH3O2H is more influenced by NOx than H2O2, as it is reduced to nearly zero values at high NOx.
3.6. Night-time chemistry
Table3shows night-time averages for the different air mass sectors and the concomi-tant NO3measurements from data on fifteen nights (Saiz-Lopez et al., 2005; see also 5
Bitter et al., 20055). The E and NE air-mass sectors have the highest average O3, NO3 (with the E sector having [NO3] of 11.7 pptv, compared to less than 6 pptv in all the other sectors) and total alkene concentrations as seen in Table3. The highest night-time peroxy radical concentrations are observed in the SE and E sectors (c.f. Allan et al., 2000).
10
Sommariva et al. (2005b)4 found that the model had a tendency to underestimate night time peroxy radical levels except on 31 August and 1 September. Closer agree-ment between the model and measureagree-ments was achieved when moving from a “clean” model with only CO and CH4to the full model with more complex hydrocarbons. Short-term NOx spikes during the night are often matched with elevated peroxy radical con-15
centrations as high as 10 pptv, or even 25 pptv in the polluted E period on the 2 and 3 August. On 16 August, when [NOx] suddenly increased at about 20:00, a sig-nificant rise in [HO2+ PRO2] followed closely, as shown in the case day in Fig. 7b. [HO2+ PRO2] vs. [NOx] for nights with NO3 data are shown in Fig. 8a. As [NOx] in-creases, [HO2+RO2] increases at [NOx]>0.1 ppbv. This peroxy radical increase with 20
NOxis suggestive of NO3radicals (in equilibrium with NO2) reacting with hydrocarbons to form peroxy radicals.
Figure 11a is a plot of average [HO2+ PRO2] vs. [NO3] (Saiz-Lopez et al., 2005) 5
Bitter, M., Ball, S. M., Povey, I. M., Jones, R. L., Saiz-Lopez, A., and Plane, J. M. C.: Measurements of NO3, N2O5, OIO, I2, water vapour and aerosol optical depth by broadband cavity ringdown spectroscopy during the NAMBLEX campaign, Atmos. Chem. Phys. Discuss., in preparation, 2005.
ACPD
5, 12313–12371, 2005 Peroxy radical chemistry at Mace Head, Ireland Z. L. Fleming et al. Title Page Abstract Introduction Conclusions References Tables Figures J I J I Back Close Full Screen / EscPrint Version
Interactive Discussion
EGU
for all the air-mass sectors. The [HO2+ PRO2] were separated into six [NO3] bins and plotted on the same graph with error bars showing their standard deviation. The E sector, even though [NO3] varies widely, always has higher [HO2+ PRO2] than the other sectors, irrespective of [NO3]. Figure 11b shows the night-time profiles of [NO3] and [HO2+ PRO2] for the entire marine (N, NW, SW and W combined) and continental 5
(NE, E combined) air-mass sectors. The NO3 concentration was always higher in the continental sector. The peroxy radical concentration was also always higher in the continental sector. There does not appear to be a significant peroxy radical pattern throughout the night.
Rate constants for the reaction of NO3with the measured alkenes were used to cal-10
culate the rate of the NO3 loss and the O3 reactions with alkenes (c.f. Salisbury et al., 2001). The flux of peroxy radicals formed from the alkene reactions from the NO3 and O3 channels were compared by correlating all night-time hours of the campaign as shown in Fig. 12a. At low peroxy radical-forming fluxes, the ozone-alkene reac-tions tended to dominate over the NO3-alkene reactions. When NO3levels were high, 15
the fluxes from NO3-alkene reactions were far higher than the ozone-alkene fluxes. At NO3-alkene fluxes above 5×10⁴molecules cm−3s−1, the ozone-alkene flux was al-ways lower than the NO3-alkene flux. Figure 12b shows the percentage contribution to peroxy radical formation from alkene night-time reactions. This varies strongly from night to night, with high NO3 contributions on 18 and 25 August, receiving W and SW 20
air-masses, respectively. For the nights for which full data is available the overall con-tribution of ozone-alkene chemistry to peroxy radical production was 59% compared to 41% for NO3-alkene.
Peroxy radical levels were seen to decrease throughout the night in EASE 97 (Sal-isbury et al., 2001), with more polluted conditions experiencing less of a decrease 25
throughout the night. Analysis to determine the percentage contribution of the ozone-alkene and NO3 reactions to form peroxy radicals was carried out for EASE 97 (Sal-isbury et al., 2001). The contribution of both was found to vary between 30 and 70%, for each wind sector, but on the whole as with this study the ozone-alkene reaction
ACPD
5, 12313–12371, 2005 Peroxy radical chemistry at Mace Head, Ireland Z. L. Fleming et al. Title Page Abstract Introduction Conclusions References Tables Figures J I J I Back Close Full Screen / EscPrint Version
Interactive Discussion
EGU
was the dominant production mechanism. Carslaw et al. (1997) found a positive cor-relation between HO2+ PRO2 and NO3 at the Weybourne Atmospheric Observatory, while Mihelcic et al. (1993) found a negative correlation between peroxy radicals and NO3 (presumably owing to highly variable reactive hydrocarbon fluxes) at Schauins-land. Any lack of correlation is not surprising, as NO3is both a source (Wayne et al., 5
1991) and a sink (Biggs et al., 1994) of peroxy radicals. 3.7. Photochemical production of ozone
Net photochemical ozone formation, N(O3) (or ozone tendency) was calculated for each hour of the campaign between 06:00 and 19:00, using Eq. (3) (for assumptions inherent in this form of calculation see Salisbury et al., 2002). The production term 10
represents NO2formation and subsequent photolysis to form ozone (Reactions 1 to 4).
kpis the combined rate coefficient for the oxidation of NO to NO2by all peroxy radicals (Reactions 1 and 2). The loss term represents the reaction of ozone with OH and HO2 and ozone photolysis (where f represents the fraction of O(1D) that reacts with H2O to form OH).
15
N(O3)= P (O3)−L(O3) (2)
N(O3)= kp[NO][HO2+ ΣRO2]−{f .j (O1D)+ k21[OH]+ k6[HO2]}[O3] (3)
HO2+ O3→ OH+ 2O2 (R6)
OH+ O3→ HO2+ O2 (R20)
Figure 13a shows a time series of calculated ozone loss for all campaign daylight hours. 20
The largest contribution to the calculated loss is that of ozone photolysis. The average ozone loss chemistry was calculated to be 64% from ozone photolysis, 8% from the OH+O3reaction and 24% from the HO2+O3reaction. The contributions from the three
ACPD
5, 12313–12371, 2005 Peroxy radical chemistry at Mace Head, Ireland Z. L. Fleming et al. Title Page Abstract Introduction Conclusions References Tables Figures J I J I Back Close Full Screen / EscPrint Version
Interactive Discussion
EGU
loss reactions vary from day to day, with total ozone loss varying between 0.1 and 0.7 ppbv h−1at the solar maximum.
Figure 13b is a plot of net ozone production, N(O3) throughout the campaign with [HO2+ΣRO2] and [NO] plotted on the right-hand axis. The ozone production term, P(O3) is dependent on [NO] and [HO2+ΣRO2], the ratio of which varies greatly from 5
day to day, showing an inverse relationship during the daylight hours. [NO] was more variable than [HO2+ΣRO2] during NAMBLEX. Lower [NO] leads to a smaller P(O3) term, which means that ozone loss becomes nearly as great as ozone production, leading to a few hours and days where N(O3) was negative.
Figure 14 shows the hourly-averaged ozone loss and production rates for NAMBLEX. 10
The loss term follows j (O1D), peaking at solar noon, and does not vary widely from day to day. However, ozone production values show a high degree of variation between days, with midday values varying from 0.1 to 2.5 ppbv h−1. The shift of the maximum ozone loss term towards the afternoon results in the net ozone production being lower in the afternoon than the morning. The rise in P(O3) in the late afternoon caused by 15
high peroxy radical levels leads to an increase in net ozone production at 16:00. This averaged diurnal cycle appears to show overall ozone production but the high P(O3) during the polluted E air-mass sector period of 1–5 August shifts the balance to positive N(O3), despite the many periods of net ozone destruction.
Figure 15 shows N(O3) for 8 August. This was a day where high [NOx] reduced 20
peroxy radical levels and the elevated [NO] led to higher net ozone production than on the days preceding and following it. A high NOx episode in the morning delayed peroxy radical production until around 14:00 (Fig. 7c) and produced high P(O3). At 13:00 P(O3) was low because [NOx] dropped away, and the peroxy radical levels had not yet recovered. The build-up of peroxy radical levels in the afternoon led to a boost 25
in P(O3) and another boost between 17:00 and 18:00 when night-time peroxy radical-forming reactions become important.
Figure 16 shows N(O3) plotted against [NOx]. N(O3) rises sharply with increasing [NOx] until around 1 ppbv [NOx], when the increase in N(O3) levels off. The increase in
ACPD
5, 12313–12371, 2005 Peroxy radical chemistry at Mace Head, Ireland Z. L. Fleming et al. Title Page Abstract Introduction Conclusions References Tables Figures J I J I Back Close Full Screen / EscPrint Version
Interactive Discussion
EGU
N(O3), with increasing NOx, during the SOAPEX 2 campaign at Cape Grim, Tasmania showed very similar characteristics until [NOx] of 0.5 ppbv. Investigations of the effect of NOx on N(O3) at Mace Head during the spring campaign of EASE 97 showed a much steeper increase in N(O3) at similar NOxlevels to those seen during NAMBLEX. Table5shows the ozone production values for Mace Head – EASE 97 (Salisbury et al., 5
2002), Cape Grim – SOAPEX 2 (Monks et al., 2005) and NAMBLEX, demonstrating the much higher range during the spring EASE 97 campaign.
Mace Head has experienced a positive trend in background ozone of 0.49±0.19 ppb year−1 since 1987 (Simmonds et al., 2004), the largest trend being during the winter season. The behaviour of this trend may be attributed to the sen-10
sitivity of the background ozone level to changing European emissions of NOx and VOC (Derwent et al., 2003; Monks, 2003). Following the methodology of Stroud et al. (2004) the sensitivity of P(O3) to NO was calculated as dlnP(O3)/dln(NO), as shown in Fig. 17, for a series of marine boundary layer campaigns with differing continental influences. Table6summarises the derived sensitivity values of the ozone production 15
term to NO. Both the Mace Head data sets have ozone production with linear sensitivity (i.e. dlnP(O3)/dln(NO)=1) to NO as compared to Cape Grim and Weybourne, that have values of around 0.9. The Mace Head values imply that the ozone production rate is strongly dependent on the [NO]. The equivalent derived values of dlnL(O3)/dln(NO) are also given in Table6 the bulk of these values range from ca. 0 to 0.3, unsurprisingly 20
this suggests that L(O3) is generally independent of small changes in [NO]. In tandem, these results imply that the N(O3) will be strongly sensitive in the marine boundary layer to small changes in [NO].
4. Conclusions
During NAMBLEX, the Mace Head Atmospheric Research Station received a substan-25
tial mix of air-masses from both the Atlantic and from Britain and Ireland. 80% of the air-masses were from the clean N, NW, W and SW sectors. The marine air-mass
sec-ACPD
5, 12313–12371, 2005 Peroxy radical chemistry at Mace Head, Ireland Z. L. Fleming et al. Title Page Abstract Introduction Conclusions References Tables Figures J I J I Back Close Full Screen / EscPrint Version
Interactive Discussion
EGU
tors had peroxy radical levels below 10 pptv, whereas the other sectors experienced levels above 13 pptv. The higher peroxy radical concentrations in the air-mass sectors with a continental influence were accompanied by over twice as high NOx levels and much higher anthropogenic hydrocarbon mixing ratios.
Peroxy radical diurnal cycle maxima were typically shifted towards the afternoon, 5
with daily maximum levels between 10 and 40 pptv. MCM modelling of peroxy radical levels provided a good model-measurement comparison, with occasional slight over-estimations by the box model.
Correlations of peroxy radicals with j (O1D) were often disturbed by NOx episodes that temporarily lowered peroxy radical levels. No significant reliable linear or square 10
root dependence with j (O1D) was observed to make a clear separation between clean and polluted conditions. Photolysis of compounds other than ozone led to a broader peroxy radical diurnal cycle than would be seen from production via ozone photolysis alone, especially in continentally-influenced air-masses. Correlations with j (HCHO) in the afternoon and a definite shift in the HCHO diurnal cycle towards the afternoon 15
suggests the high potential for HCHO photolysis at this time. A sudden increase in photolysis rates (i.e. a rise in j (O1D)) in the early evening was seen to cause a large pulse in peroxy radicals.
Short-term large NOx mixing ratios, termed “NOx spikes”, reaching the site caused a marked drop in peroxy radical levels. Plotting the overall effect of NOx on peroxy 20
radical levels during the whole campaign demonstrated a decrease in peroxy radicals with increasing NOx. A break in the linear decrease around 0.1 and 0.2 ppbv NOxwas accompanied by an increase in VOCs which led to a short period where peroxy radicals actually increased with NOx. This VOC influence on peroxy radicals could be thought of as the break between NOx- and VOC-limited ozone producing regimes.
25
Comparisons with FAGE HO2 measurements have shown that HO2/(HO2+PRO2) ratios are dependent on [NOx] and ranged between 0.2 and 0.6. HO2/(HO2+PRO2) ratios increase remarkably linearly with increasing NOx. The MCM model did not replicate this NOx-dependence with the model in general over-estimating
ACPD
5, 12313–12371, 2005 Peroxy radical chemistry at Mace Head, Ireland Z. L. Fleming et al. Title Page Abstract Introduction Conclusions References Tables Figures J I J I Back Close Full Screen / EscPrint Version
Interactive Discussion
EGU
HO2/(HO2+PRO2) ratios. The addition of halogen oxide chemistry improved the level of agreement. Calculating the expected HO2/(HO2+PRO2) ratios from OH oxidation reactions of VOC, HCHO and CO did not show any significant NOx-dependence.
Night-time peroxy radical concentrations rose to as high as 25 pptv in continental air-masses with high NOx. Sudden NO3spikes definitely caused an increase in peroxy 5
radicals, but constant higher NO3levels did not necessarily lead to higher peroxy rad-ical concentrations. Peroxy radrad-ical and NO3 mixing ratios were higher in continental compared to marine air-masses. The contribution of ozone-alkene and NO3-alkene reactions to peroxy radical formation varies from night to night and there are varia-tions as to which one predominates. At low NO3, ozone-alkene reactions are always 10
predominant.
Net photochemical ozone production reached as high as 1.5 ppbv h−1with the lowest values being negative at −0.5 ppbv h−1. Highest net ozone production was observed during high NOxperiods, demonstrating a clear increase in ozone production at higher NOx. The ozone production rate is strongly dependent on [NO] having a linear sensitiv-15
ity (dln(P(O3))/dln(NO)=1.0). The results imply that the N(O3) will be strongly sensitive in the marine boundary layer to small changes in [NO] which has ramifications for changing NOxloadings in the European continental boundary layer.
Acknowledgements. This work was conducted under the auspices of the UK-NERC funded
project NAMBLEX. The authors would like to thank G. Spain for his logistical support, and also
20
G. Johnson for assistance with HO2measurements using FAGE.
References
Allan, B. J., Carslaw, N., Coe, H., Burgess, R. A., and Plane, J. M. C.: Observations of the nitrate radical in the marine boundary layer, J. Atmos. Chem, 33, 129–154, 1999.
Allan, B. J., McFiggans, G., Plane, J. M. C., Coe, H., and McFadyen, G. G.: The nitrate radical
25
in the marine boundary layer, J. Geophys. Res., 105, 24 191–24 204, 2000.
Andr ´es Hern ´andez, M. D., Burkert, A. J., Reichert, L., St ¨obener, D., Meyer-Arnek, J., Burrows, J. P., Dickerson, R. R., and Doddridge, B. G.: Marine boundary layer peroxy radical chemistry
ACPD
5, 12313–12371, 2005 Peroxy radical chemistry at Mace Head, Ireland Z. L. Fleming et al. Title Page Abstract Introduction Conclusions References Tables Figures J I J I Back Close Full Screen / EscPrint Version
Interactive Discussion
EGU
during the AEROSOLS99 campaign: Measurements and analysis, J. Geophys. Res., 106, 20 833–20 846, 2001.
Ashbourn, S. F. M., Jenkin, M. E., and Clemitshaw, K. C.: Laboratory studies of the response of a peroxy radical chemical amplifier to HO2and a series of organic peroxy radicals, J. Atmos. Chem., 29, 233–266, 1998.
5
Ayers, G. P., Penkett, S. A., Gillett, R. W., Bandy, B. J., Galbally, I. E., Meyer, C. P., Elsworth, C. M., Bentley, S. T., and Forgan, B. W.: Evidence for photochemical control of ozone con-centrations in unpolluted air, Nature, 360, 446–448, 1992.
Ayers, G. P., Granek, H., and Boers, R: Ozone in the Marine Boundary Layer at Cape Grim: Model Simulation, J. Atmos. Chem, 27, 179–195, 1997.
10
Ayers, G. P., Gillet, R. W., Granek, H., de Serves, C., and Cox, R. A: Formaldehyde production in clean marine air, Geophys. Res. Lett., 24, 401–404, 1997.
Biggs, P., Canosa-Mas, C. E., Fracheboud, J.-M., Shallcross, D. E., and Wayne, R. P.: Inves-tigation into the kinetics and mechanism of the reaction of NO3 with CH3O2 at 298 K and 2.5 Torr: A potential source of OH in the nighttime troposphere?, J. Chem. Soc. Faraday
15
Trans, 90, 1205–1210, 1994.
Bloss, C., Wagner, V., Bonzanini, A., Jenkin, M. E., Wirtz, K., Martin-Reviejo, M., and Pilling, M. J.: Evaluation of detailed aromatic mechanisms (MCMv3 and MCMv3.1) against environ-mental chamber data., Atmos. Chem. Phys., 5, 623–639, 2005a,
SRef-ID: 1680-7324/acp/2005-5-623.
20
Bloss, C., Wagner, V., Jenkin, M. E., Volkamer, R., Bloss, W. J., Lee, J. D., Heard, D. E., Wirtz, K., Martin-Reviejo, M., Rea, G., Wenger, J. C., and Pilling, M. J.: Development of a detailed chemical mechanism (MCMv3.1) for the atmospheric oxidation of aromatic hydrocarbons, Atmos. Chem. Phys., 5, 641–664, 2005b,
SRef-ID: 1680-7324/acp/2005-5-641.
25
Bloss, W. J., Gravestock, T. J., Heard, D. E., Ingham, T., Johnson, G. P., and Lee, J. D.: Application of a compact all solid-state laser system to the in-situ detection of atmo-spheric OH, HO2, NO and IO by laser-induced fluorescence, J. Environ. Monit., 5, 21–28, doi:10.1039/b208714f, 2003.
Bloss, W. J., Lee, J. D., Bloss, C., Wirtz, K., Martin-Reviejo, M., Siese, M., Heard, D. E., and
30
Pilling, M. J.: Validation of the calibration of a laser-induced fluorescence instrument for the measurement of OH radicals in the atmosphere, Atmos. Chem. Phys., 4, 571–583, 2004, SRef-ID: 1680-7324/acp/2004-4-571.


![Fig. 6. a) Hourly-averaged diurnal cycle of [HCHO], [HO 2 +RO 2 ] and j(HCHO)×[HCHO]hour −1 b) Trend of ten minute-averaged [HO 2 +RO 2 ]and [HCHO] vs](https://thumb-eu.123doks.com/thumbv2/123doknet/14702032.565089/49.918.174.531.114.488/hourly-averaged-diurnal-cycle-hcho-trend-minute-averaged.webp)
![Fig. 6. a) Hourly-averaged diurnal cycle of [HCHO], [HO 2 +RO 2 ] and j(HCHO)×[HCHO]hour −1 b) Trend of ten minute-averaged [HO 2 +RO 2 ]and [HCHO] vs](https://thumb-eu.123doks.com/thumbv2/123doknet/14702032.565089/50.918.207.505.37.538/hourly-averaged-diurnal-cycle-hcho-trend-minute-averaged.webp)

![Fig. 9. a) Hourly-averaged measured and modelled [HO 2 +RO 2 ] diurnal cycles for the 15 th -22 nd August b) Measured and modelled HO 2 /HO 2 +RO 2 ratios for 15 th -21 st August](https://thumb-eu.123doks.com/thumbv2/123doknet/14702032.565089/52.918.147.585.37.535/hourly-averaged-measured-modelled-diurnal-august-measured-modelled.webp)
![Figure 8e shows a plot of hourly HO 2 /(HO 2 + P RO 2 ) and φ(CO+HCHO) ratios against binned [NO x ]](https://thumb-eu.123doks.com/thumbv2/123doknet/14702032.565089/53.918.710.896.103.644/figure-shows-plot-hourly-ho-hcho-ratios-binned.webp)
