HAL Id: hal-02995387
https://hal.archives-ouvertes.fr/hal-02995387
Submitted on 9 Nov 2020HAL is a multi-disciplinary open access archive for the deposit and dissemination of sci-entific research documents, whether they are pub-lished or not. The documents may come from teaching and research institutions in France or
L’archive ouverte pluridisciplinaire HAL, est destinée au dépôt et à la diffusion de documents scientifiques de niveau recherche, publiés ou non, émanant des établissements d’enseignement et de recherche français ou étrangers, des laboratoires
Regulation of ERK signalling pathway in the developing
mouse blastocyst
Takuya Azami, Cécilia Bassalert, Nicolas Allègre, Lorena Valverde Estrella,
Pierre Pouchin, Masatsugu Ema, Claire Chazaud
To cite this version:
Takuya Azami, Cécilia Bassalert, Nicolas Allègre, Lorena Valverde Estrella, Pierre Pouchin, et al.. Regulation of ERK signalling pathway in the developing mouse blastocyst. Development (Cambridge, England), Company of Biologists, 2019, �10.1242/dev.177139�. �hal-02995387�
Regulation of ERK signalling pathway in the developing mouse blastocyst 1
2
Takuya Azami1,4, Cécilia Bassalert2,4, Nicolas Allègre2, Lorena Valverde Estrella2, Pierre Pouchin2, 3
Masatsugu Ema1, 3* and Claire Chazaud2*. 4
1Department of Stem Cells and Human Disease Models, Research Center for Animal Life Science, Shiga 5
University of Medical Science, Seta, Tsukinowa-cho, Otsu, Shiga 520-2192, Japan. 6
2GReD laboratory, Université Clermont Auvergne, CNRS, Inserm, Faculté de Médecine, CRBC, F-63000 7
Clermont-Ferrand, France 8
3Institute for the Advanced Study of Human Biology (ASHBi), Kyoto University Institute for Advanced 9
Study 606-8501, Japan 10
4These authors contributed equally to this work 11
*Corresponding authors: claire.chazaud@uca.fr, mema@belle.shiga-med.ac.jp 12
13
Abstract
14
Activation of the ERK signalling pathway is essential for the differentiation of the inner cell mass (ICM) 15
during mouse preimplantation. We show here that ERK phosphorylation is present in ICM precursor cells, 16
in differentiated Primitive Endoderm (PrE) cells as well as in the mature, formative state Epiblast (Epi). We 17
further show that DUSP4 and ETV5, factors often involved in negative feedback loops of the FGF pathway 18
are differently regulated. While DUSP4 expression in PrE cells clearly depends on ERK activity, ETV5's 19
localises mainly to Epi cells. Unexpectedly, ETV5 expression does not depend on ERK activation but 20
requires NANOG expression. Indeed ETV5, like Fgf4, is not expressed in Nanog mutant embryos. Our 21
results lead us to propose that in naïve pluripotent Epi cells, NANOG induces both Fgf4 and ETV5 to 22
enable the differentiation of neighbouring cells into PrE while protecting the Epi identity from autocrine 23
signalling. 24
Introduction
1
Signalling between cells is crucial for tissue differentiation and is required during the earliest steps of 2
embryo differentiation. During mouse preimplantation, three cell lineages are produced from two 3
successive differentiation events. The first differentiation between outer and inner cells is essentially driven 4
by the Hippo signalling pathway leading to TE and inner cell mass (ICM) cells, respectively (Menchero et 5
al., 2016; Nishioka et al., 2009). During blastocyst formation around embryonic day 3.5 (E3.5), Epiblast 6
(Epi) and Primitive endoderm (PrE) cells appear within the ICM in a "salt and pepper" pattern evidenced 7
by the reciprocal and complementary expression pattern of the transcription factors NANOG and GATA6 8
(Chazaud et al., 2006; Guo et al., 2010; Kurimoto et al., 2006; Plusa et al., 2008). Numerous experiments 9
have shown that the FGF/ERK pathway balances this binary cell fate as high signals induce cells into PrE 10
whereas blocking the pathway leads ICM cells toward an Epi fate (Bessonnard et al., 2017; Chazaud et al., 11
2006; Feldman et al., 1995; Kang et al., 2013; Kang et al., 2017; Krawchuk et al., 2013; Molotkov et al., 12
2017; Nichols et al., 2009; Ohnishi et al., 2014; Saiz et al., 2016; Yamanaka et al., 2010). Interestingly, 13
Fgf4, the sole FGF ligand detected at this stage, is transcribed and secreted from Epi cells only, converting 14
neighbouring cells into PrE (Frankenberg et al., 2011; Guo et al., 2010; Kurimoto et al., 2006; Ohnishi et 15
al., 2014). Fgfr2 is specifically expressed in PrE cells (Guo et al., 2010; Kurimoto et al., 2006; Ohnishi et 16
al., 2014), however Fgfr1 which is equally expressed in Epi and PrE cells is the initial and main receptor 17
transducing the FGF activity required for PrE specification (Kang et al., 2017; Molotkov et al., 2017). 18
19
Despite the increasing data demonstrating the importance of the FGF/ERK pathway during blastocyst 20
development, expression of activated phosphorylated ERK (pERK) has not been described yet. FGF target 21
genes have been recently examined using Fgfr1/2 mutant embryos. While Dusp4 is preferentially expressed 22
in PrE cells, as would be expected with a pERK activity required in this cell type, other genes such as 23
Etv4/5 that are ETS-related factors and Spry2/4 are present in both cell types or preferentially expressed in 24
Epi cells in late blastocysts at E4.5 (Kang et al., 2017). It was then proposed that pERK activity could be 1
also present in Epi cells where it would activate ETVs expression. Then ETVs would cut down pERK 2
activity in Epi cells by activating negative feedback loops involving SPRYs (Kang et al., 2017). 3
4
Here, we show that pERK expression begins around E3.0-E3.25 days of development concomitant with the 5
initiation of Epi/PrE specification, and is essentially present in ICM progenitor or PrE cells. This 6
expression is respectively increased or lost in Klf5 and Fgf4 mutants which is in accordance to the 7
described phenotypes (Azami et al., 2017; Kang et al., 2013; Krawchuk et al., 2013; Ohnishi et al., 2014). 8
We also found that DUSP4 expression tightly follows pERK activity, whereas surprisingly ETV5's is not 9
regulated by this MAPK pathway but clearly depends on NANOG expression. Our results lead to a novel 10
model of FGF/ERK regulation in the preimplantation embryo. 11
12
Results
13
Detection of pERK in preimplantation embryos 14
FGF/ERK signalling pathway plays pivotal roles in the segregation of Epi and PrE, yet there is currently no 15
reliable method to detect phosphorylated ERK (pERK) signal during preimplantation stages, thereby 16
hampering the understanding of how pERK regulates the fundamental process of preimplantation 17
development. We have developed two new methods to detect pERK expression that are sufficiently 18
sensitive to detect signals in preimplantation embryos. Briefly, to preserve the integrity of the phosphate 19
conjugate we add phosphatase inhibitors during the fixation step and permeabilization is carried out either 20
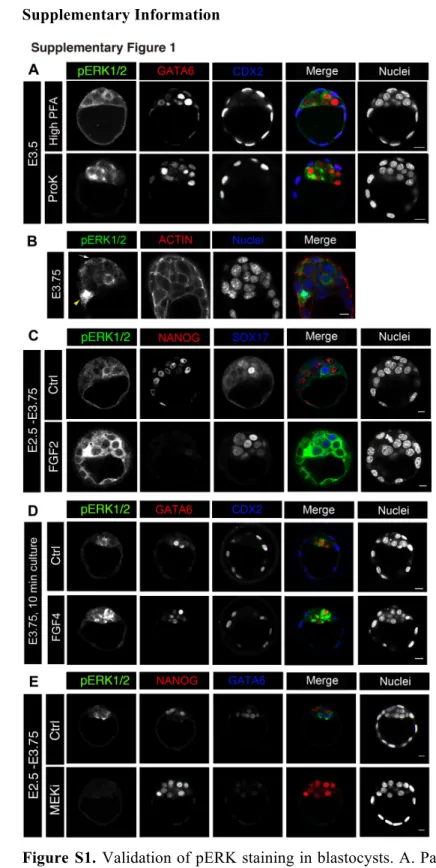
with Triton X100 or proteinase K (see materials and methods). Two working methods (Fig S1A) provide 21
alternative solutions to observe other labellings in co-staining experiments. Expression of pERK is evident 22
in the cytoplasm while mitotic nuclei can retain a strong labelling (Fig. S1B, 2C), as previously reported 23
(Corson et al., 2003; Shapiro et al., 1998). 24
The presence of exogenous FGF has been shown to increase the number of PrE cells (Yamanaka et al., 1
2010), and culturing embryos between E2.5 and E3.75 increases the number of pERK labelled cells as well 2
as its signal intensity, with almost all ICM cells exhibiting an elevated pERK signal compared to the 3
control (Fig. S1C). Interestingly, an increase of pERK staining can be observed after only 10 min of FGF 4
treatment (Fig S1D). To further validate these techniques, we collected E2.5 embryos and cultured them 5
until E3.75 with MEK inhibitor (PD0325901; 0.5 µM) that blocks the pathway upstream of ERK 6
phosphorylation (Nichols et al., 2009; Yamanaka et al., 2010). The signal is totally down regulated in the 7
presence of the inhibitor (Fig. S1E), confirming the specificity of our methods. Thus, we established for the 8
first time two protocols to detect pERK during preimplantation development. 9
10
pERK expression begins during blastocyst formation 11
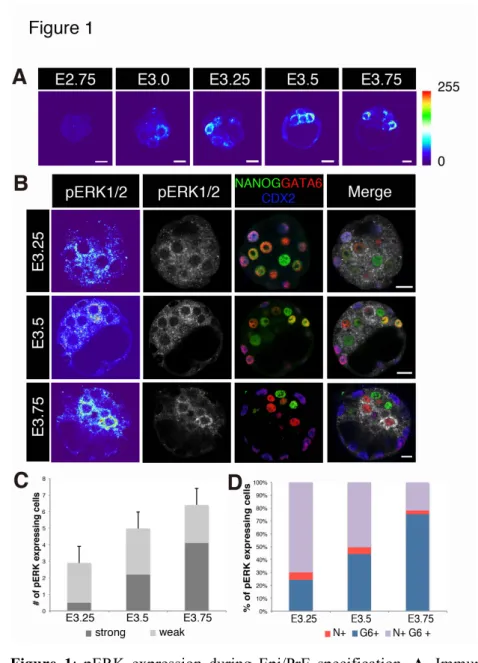
We analysed pERK expression during preimplantation development from 1-cell stage, thus before the 12
reported Fgf4 expression that starts in a subset of the inner cells between E3.0 and E3.25 (Guo et al., 2010; 13
Ohnishi et al., 2014). Cells expressing pERK are firstly detected around E3.0 (Fig. 1A). The number of 14
labelled cells increases with time, exhibiting graded pERK levels (Fig. 1A, 1B). A few TE cells are marked 15
(Fig S1B) and this is consistent with a required pERK activity for TE proliferation (Nichols et al., 2009). 16
Then, we examined the identity of pERK-positive ICM cells by staining NANOG and GATA6 together 17
with pERK at each developmental stage (Fig. 1B, 1D). Cell counts indicate that few cells are labelled 18
between E3.0 and E3.25 (Fig. 1C), around two to three per embryo, with a relatively weak staining that is 19
present in uncommitted cells that are doubly positive for NANOG and GATA6 (Bessonnard et al., 2014; 20
Bessonnard et al., 2017; Plusa et al., 2008; Saiz et al., 2016) (Fig. 1D). From E3.5, the number of cells with 21
a strong pERK labelling increases (Fig. 1C) and progressively correspond to GATA6 expressing cells (Fig. 22
1D). Thus ERK phosphorylation essentially occurs in PrE-specified cells as well as in a subset of 23
uncommitted cells, delineating the induction of their specification into PrE cells. However, not all PrE cells 24
were labelled by pERK whereas all PrE cells require FGF/ERK activity for their specification (Chazaud et 1
al., 2006; Kang et al., 2017; Molotkov et al., 2017; Nichols et al., 2009; Yamanaka et al., 2010). This low 2
frequency of labelled cells may reflect a transient nature of pERK labelling. 3
4
pERK is expressed during postimplantation development and in cultured cells 5
After cell specification into Epi and PrE, little is known about MAPK activity in the three cell lineages 6
after their differentiation. During implantation (from E4.0) several FGF ligands are expressed in the Epi 7
(Fgf4, Fgf5, Fgf8, Fgf15, Fgf18) and in the PrE (Fgf3, Fgf17), and can be transduced by Fgfr2, Fgfr3 or 8
Fgfr4 (Ohnishi et al., 2014). Moreover, PDGF signalling was shown to be important for PrE cell survival 9
(Artus et al., 2013) and could act through the MAPK pathway. Accordingly, pERK is detected in PrE cells 10
at E4.5 (Fig 2A) and their derivatives at E6.5 (Fig 2B). Consistent with a previous report (Corson et al., 11
2003), strong pERK signals are detected in the extraembryonic ectoderm of E6.5 (Fig. 2B). 12
In FGF/ERK impaired embryos, NANOG expression is maintained in the E4.5 Epi while it decays in WT 13
embryos (Kang et al., 2013; Molotkov et al., 2017; Nichols et al., 2009). This suggests that FGF4 enables 14
Epi maturation by down regulating NANOG expression levels. Accordingly, we could observe pERK 15
expression in some Epi cells at E4.5 (Fig 2A), most likely through the transduction of FGFR1, the only 16
FGF receptor expressed in this tissue at this stage (Ohnishi et al., 2014). Similarly, mouse Embryonic Stem 17
(ES) cells, that are closely related to the E4.5 epiblast (Boroviak et al., 2014), express high levels of Fgf4, 18
and the FGF pathway is necessary for their exit of pluripotency and differentiation (Kunath et al., 2007; 19
Molotkov et al., 2017). A heterogeneous labelling is observed among the cells, possibly due to 20
heterogeneous levels of NANOG expression that is inducing Fgf4 secretion (Festuccia et al., 2012) and 21
also owing to a possible transient ERK phosphorylation. In the presence of the MEK inhibitor, pERK 22
staining is strongly diminished in ES cells (Fig. 2C). 23
We thus report that the ERK pathway is active in the three cell lineages derived from Epi, PrE and TE. 24
Upstream regulation of FGF/pERK through the analysis of Fgf4, Klf5, Nanog and Gata6 mutant 1
embryos 2
Fgf4 is specifically expressed in Epi cells (Frankenberg et al., 2011; Guo et al., 2010; Kurimoto et al., 3
2006; Ohnishi et al., 2014) and acts as a paracrine factor to differentiate neighbouring cells (Frankenberg et 4
al., 2011). Fgf4 targeted inactivation leads to an absence of PrE cells and a pan expression of Epi markers 5
in the ICM (Kang et al., 2013; Krawchuk et al., 2013). We observe an absence of pERK expression in Fgf4 6
KO embryos (Fig. 3A) demonstrating that FGF4 is the sole secreted signal to activate the ERK pathway at 7
this stage of development. 8
9
Our previous results showed that Klf5 is essential for blastocyst development (Ema et al., 2008). Indeed, 10
through a direct binding to Fgf4 regulatory elements, KLF5 prevents precocious expression of Fgf4 at E3.0 11
- E3.25 to initiate cell differentiation at the right time and to ensure a proper balance between EPI and PrE 12
cells (Azami et al., 2017). Consistent with our previous study, Klf5-/- embryos at E3.25 have a stronger
13
pERK signal and in more cells compared with that of WT embryos (Fig. 3B). 14
15
We have previously shown (Frankenberg et al., 2011) that Fgf4 transcription in Epi cells requires the 16
presence of NANOG (Fig 3E). As expected, in Nanog mutant embryos, the lack of FGF4 leads to an 17
absence of pERK activation (Fig 3C). 18
Removing one or two alleles of Gata6 increases the number of Fgf4 expressing cells (Fig 3E) as more cells 19
express NANOG (Bessonnard et al., 2014). As a consequence, pERK staining can be observed throughout 20
the ICM of Gata6-/- embryos (Fig 3D), either due to a transcriptional activation of Fgf4 by NANOG, or due
21
to a lack of GATA6 repression (Fig 3E). It is interesting to note that ICM cells in Gata6-/- embryos have an 22
Epi identity and are nevertheless able to transduce FGF signalling through FGFR1 which is expressed in 23
these cells (Fig 3E). This ERK activity is reminiscent of what is found in E4.5 WT Epi cells or in ES cells. 24
1
DUSP4 but not ETV5 is a target of pERK. 2
ETV5 and DUSP4 are considered as direct targets of the MAPK/ERK pathway (Neben et al., 2017; Patel 3
and Shvartsman, 2018) and are present in the blastocyst (Guo et al., 2010; Kang et al., 2017; Kurimoto et 4
al., 2006). We carried out single-cell RNA analyses, and we subdivided the samples between Fgf4-positive 5
and Fgf4-negative populations as Fgf4 was identified as the Epi marker with the earliest binary expression 6
(Guo et al., 2010; Ohnishi et al., 2014). The transcripts of Dusp4 are barely detected at the 16-cell stage and 7
later are preferentially expressed in Fgf4-negative cells identified as PrE cells (Fig 4A). On the reverse, 8
Etv5 expression in enriched in Fgf4-positive Epi cells as early as E3.25 (Fig 4A). Etv4 expression is 9
starting from E3.5, thus after the beginning of Epi/PrE specification (Fig 4A and Fig S3). At E3.75 when 10
Nanog/Gata6 mutual exclusive expression is established, Etv4 is enriched in Fgf4-negative PrE-precursor 11
cells while Etv5 is enriched in Fgf4-positive EPI-precursor cells (Fig 4A). 12
At E3.25, DUSP4 expression is mainly observed in outside trophectoderm cells (Fig 4B) as reported for its 13
RNA localisation (Posfai et al., 2017), consistent with an active FGF pathway to promote TE growth 14
(Nichols et al., 2009). Later, DUSP4 expression localises to PrE, GATA6-positive, cells (Fig. 4B, C) but 15
can also be found in yet undifferentiated cells, labelled by both GATA6 and NANOG, especially at the 16
beginning of blastocyst formation (Fig 4C). Epi cells do not express DUSP4 (Fig 4C). A double labelling 17
with pERK and DUSP4 antibodies shows a high correlation of expression. However, some pERK-only 18
marked cells could be observed, probably reflecting an early activation of the pathway just preceding a 19
visible DUSP4 translation. As well, DUSP4-only labelled cells are found, illustrating a plausible transient 20
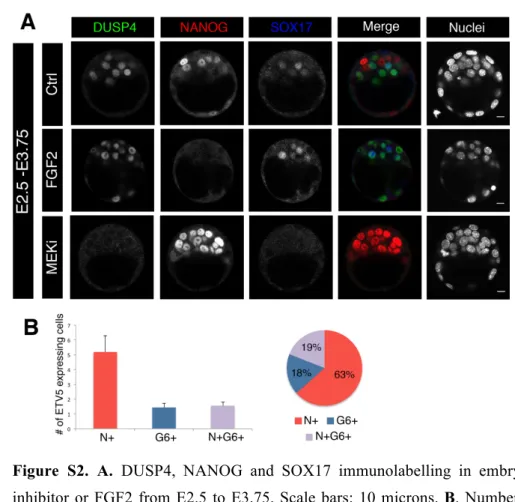
nature of ERK activation. As expected, DUSP4 expression is enhanced by FGF2 treatment and disappears 21
upon MEK inhibitor administration (Fig S2). 22
In Nanog mutants, DUSP4 expression is not activated in the ICM (Fig 4D), in accordance with the absence 23
of Fgf4 in these embryos (Fig 3E, (Frankenberg et al., 2011). On the reverse DUSP4 labelling is observed 24
in some cells in Gata6-/- embryos (Fig 4D). This result shows that DUSP4 does not need GATA6 presence
1
to be expressed but relies essentially on pERK signalling activity. DUSP4 expression is thus a faithful 2
reporter of ERK activity. 3
4
ETV5 is an ETS related transcription factor involved in the transduction of the MAPK pathway (Herriges 5
et al., 2015; Sharrocks, 2001) and is expressed in the blastocyst ICM (Guo et al., 2010; Kang et al., 2017). 6
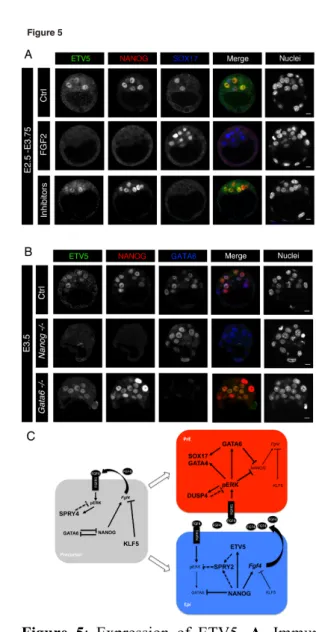
By immunofluorescence we show that from E3.5 ETV5 is preferentially expressed in Epi cells as it 7
colocalises with NANOG (Fig 5A), confirming the RNA expression data (Fig 4A), however some PrE cells 8
can also express it (Fig S2B). Surprisingly, ETV5 expression is drastically down regulated upon FGF2 9
administration and is enhanced in the presence of MEK inhibitor (Fig. 5A). Thus ETV5 does not behave 10
like a MAPK signalling reporter but as an Epi marker. Strikingly, ETV5 expression is lost in Nanog
-/-11
embryos and is present throughout the ICM of Gata6-/- embryos. Therefore, our data clearly indicate that 12
ETV5 does not depend on RTK signals but on NANOG expression during blastocyst formation. 13
14
Discussion
15
FGF signalling, through FGFR and ERK controls PrE differentiation in the ICM of the mouse blastocyst 16
(Brewer et al., 2016; Chazaud et al., 2006; Feldman et al., 1995; Kang et al., 2013; Kang et al., 2017; 17
Krawchuk et al., 2013; Molotkov et al., 2017; Nichols et al., 2009; Saiz et al., 2016; Yamanaka et al., 2010). 18
However the spatiotemporal expression of active, phosphorylated ERK has never been reported during 19
mouse preimplantation. We show here that pERK expression begins at the onset of Epi/PrE differentiation, 20
around E3.25, time when Fgf4 transcripts start to be elevated in some ICM cells (Ohnishi et al., 2014). 21
Thus as soon as Fgf4 is expressed at sufficient levels pERK expression can be observed. This expression is 22
essentially present in uncommitted cells, doubly labelled by NANOG and GATA6, and in PrE cells solely 23
marked by GATA6. This is consistent with the known pERK activity which is converting uncommitted 24
cells into PrE (Bessonnard et al., 2017; Saiz et al., 2016) and our data show here that pERK expression 1
persists in PrE cells up to at least E4.5. At this stage, pERK can be observed in some Epi cells, time when 2
they are differentiating further through a formative phase (Smith, 2017), by down regulating NANOG and 3
up regulating OTX2, OCT6, FGF5 (Acampora et al., 2016; Morgani et al., 2017). Interestingly NANOG 4
expression is maintained in Fgf4 and in Fgfr1/Fgfr2 mutants (Kang et al., 2013; Molotkov et al., 2017) 5
indicating that Epi maturation requires FGF signalling, which is thus consistent with the observed pERK 6
expression. 7
8
Dual-specificity phosphatases (DUSPs) are known as transcriptional ERK targets in several models and 9
inhibit the FGF pathway in a negative feedback loop through the dephosphorylation of ERK (Amit et al., 10
2007; Brewer et al., 2016; Chu et al., 1996; Eblaghie et al., 2003; Ekerot et al., 2008; Lemmon and 11
Schlessinger, 2010; Niwa et al., 2007). We show that DUSP4 expression tightly follows pERK's, and 12
depends on it. In WT embryos DUSP4 could be considered as a PrE marker, however, its expression in 13
Gata6-/- embryos, which do not contain PrE cells, indicates that this protein is linked to pERK activity 14
rather than PrE identity and is thus a reliable ERK activity reporter. Co-labelling experiments of pERK 15
with DUSP4 suggest a transient activated ERK while DUSP4 expression is more robust. Transient or 16
sustained ERK activities have been observed downstream of RTK signalling to control different cellular 17
responses. These differences in the output, despite sharing signalling intermediates, can be explained in 18
part by differences in feedback mechanisms (Lemmon and Schlessinger, 2010). The rather transient nature 19
of the pERK labelling observed during preimplantation suggests the presence of negative feedback loops 20
that can be mediated through DUSP4. 21
22
ETS-related molecules such as ETS-variant (ETV) 4 and 5, are transcriptionally activated by the FGF 23
pathway in several different developmental processes and tissues (Aulehla et al., 2008; Liu et al., 2003; 24
Raible and Brand, 2001; Roehl and Nüsslein-Volhard, 2001). ETS factors are often involved in positive or 1
negative feedback loops of ERK signalling (Herriges et al., 2015; Reginensi et al., 2011), being either 2
activators or repressors of transcription and potentially regulating negative effectors of the pathway such as 3
SPROUTYs (SPRYs) (Herriges et al., 2015; Neben et al., 2017; Reginensi et al., 2011; Sharrocks, 2001; 4
Willecke et al., 2011). Etv4, Etv5 and Spry4 have been reported to be expressed in both Epi and PrE cells 5
during blastocyst formation, whereas Spry2 is preferentially expressed in the Epi (Boroviak et al., 2015; 6
Kang et al., 2017; Morgani et al., 2018). Moreover, Etv4 and Spry4 expression is diminished in absence of 7
FGF/ERK signalling in both cell types (Kang et al., 2017; Morgani et al., 2018). It was then proposed that 8
these ETVS and SPRYs would suppress or dampen ERK activity through a FGF negative feedback loop, to 9
desensitise Epi cells from their own FGF4 secretion (Kang et al., 2017). However, we found that pERK is 10
almost undetectable in blastocyst Epi cells implying that either Etv4 and Spry4 are only transcribed in 11
precursor cells with a high RNA stability or that these genes can respond to very low levels of pERK or 12
that their expression depends also on other factors. Data extraction from single-cell RNA-seq analyses 13
(Posfai et al., 2017) show that only Spry4, but not Etv4, is expressed in precursor cells at the 16-cell/E3.25 14
stages (Fig S3). Thus SPRY4, under FGF stimulation (Morgani et al., 2018) could tame the FGF/ERK 15
pathway at least in the precursor cells. 16
Spry2 is particularly interesting because its transcripts are differentially enriched between Epi and PrE cells 17
(Boroviak et al., 2015; Kang et al., 2017), and as FGF signalling must not be blocked in PrE cells. Spry2 18
expression is maintained at E3.5 and is downregulated by late blastocyst stage in Fgfr mutants (Kang et al., 19
2017), indicating that its initial expression is independent from FGF signalling. ETS-binding sites, that are 20
conserved in the mouse, have been characterized in hSpry2 promoter (Ding et al., 2003). Thus SPRY2 is a 21
good candidate downstream of ETVs to block FGF signalling in the Epi, as early as the 16-cell/E3.25 stage 22
(Fig S3). We show here that Etv5 transcripts, like Spry2’s, and protein are enriched in EPI cells. 23
Surprisingly, ETV5 expression is not regulated by the FGF/ERK pathway but is induced by NANOG, 24
likely through a direct activation as NANOG binds to the Etv5 locus in ES cells (Boyer et al., 2005; Loh et 1
al., 2006; Murakami et al., 2016). Thus, this reveals a novel potential mechanism by which NANOG 2
activates the expression of FGF4 and ETV5 at the same time, on one hand to induce the paracrine PrE cell 3
differentiation, and on the other hand to protect Epi cells against an autocrine/paracrine FGF4 activity. This 4
mechanism of direct activation of ETV5 by NANOG would seem more efficient to protect Epi cells 5
identity compared to an activation of ETV5 through a negative feedback loop found in other systems 6
(Herriges et al., 2015). Indeed ETV5 is already present when Epi cells are subjected to an 7
autocrine/paracrine FGF4 activity. 8
9
How ERK activity is controlled during Epi/PrE specification has remained unclear. With these novel data 10
we propose (Fig 5C) that in precursor cells of the early ICM, expressing both NANOG and GATA6, pERK 11
activity remains very low or absent due to i) KLF5 presence that limitates the number of Fgf4 transcripts 12
(Azami et al., 2017) and ii) the possible inhibition of the FGF pathway by a negative feedback mechanism 13
through SPRY4 (Kang et al., 2017; Morgani et al., 2018). Then at the beginning of Epi specification, 14
NANOG expression becomes predominant over GATA6's, and enables the transcription of both Fgf4 and 15
Etv5. FGF4 is secreted and binds to FGFR1, which is equally expressed among ICM cells. In Epi cells, 16
ETV5 is likely to protect the cells from the surrounding FGF4 by activating SPRY2 to attenuate or block 17
the ERK pathway. In PrE cells, NANOG is not expressed and therefore ETV5 is absent. This enables an 18
efficient FGF/ERK pathway activity, illustrated by DUSP4 expression, to differentiate the cells into PrE by 19
maintaining a high expression of GATA6 and inducing downstream PrE factors such as SOX17 and 20
GATA4. 21
In conclusion, our results show that NANOG is key in the binary cell differentiation by activating within 22
the same cell the differentiation paracrine cues and a protective cell-autonomous mechanism. 23
Materials and methods
1
Experiments were performed in accordance with French/EU and Japanese guidelines for the care and use of 2
laboratory animals. 3
4
Embryo collection and culture. 5
Preimplantation embryos (CD1 (ICR) background) were collected from oviducts or uteri by flushing with 6
M2 medium (Sigma). Embryos were cultured in the presence of MEK inhibitor (PD0325901; 0.5 µM) 7
(Selleck), FGFR inhibitor (PD173074; 100 nM) (Selleck), FGF2 (Cell Guidance Systems) or FGF4 (1 8
µg/mL) (R&D) + heparin(1 µg/mL) (Sigma) in KSOM+AA medium (Millipore) in 4-well plates at 37℃, 9 5% CO2. 10 11 Mutant Mice 12
Fgf4tm1.2Mrt (Sun et al., 2002), obtained from MMRRC at UC Davis were crossed with Ayu1-Cre mice that
13
express Cre recombinase from zygote to generate the deletion of Fgf4 allele. Fgf4+/− mice were then 14
intercrossed to obtain Fgf4 mutant embryos. Nanog and Gata6 mutant embryos were obtained as 15
previously described (Bessonnard et al., 2014; Frankenberg et al., 2011; Mitsui et al., 2003; Sodhi et al., 16
2006) through natural mattings. Klf5 KO embryos were generated as previously described (Azami et al., 17
2017). Reporter mice for Fgf5 (Fgf5-P2A-Venus) were generated as previously described (Khoa et al., 18
2016). All mice were maintained on the CD1 (ICR) background. Embryos genotyping was performed after 19
confocal imaging, as described previously (Azami et al., 2017; Bessonnard et al., 2014; Frankenberg et al., 20
2011; Khoa et al., 2016) 21
22
Whole mount immunostaining 23
Immunostaining of embryos were performed as described previously (Azami et al., 2017). Briefly, embryos 24
were fixed in 4% paraformaldehyde (PFA) in 1 x PBS for 15-30 min at RT. Permeabilization was 1
performed in 0.5% TritonX-100 in PBS for 15 min and embryos were incubated in blocking solution (1% 2
donkey serum, 0.1% BSA, and 0.01% Tween20 in PBS) for 1 hr at RT. Then, embryos were treated with 3
primary antibodies in blocking solution for overnight at 4℃. After washing with 0.1% Tween20 in PBS for 4
three times, embryos were treated with secondary antibodies in blocking solution for 1 hr at RT. Nuclei 5
were stained with Hoechst33342 (Thermofisher) or DAPI. To visualize DUSP4, a tyramid signal 6
amplification (TSA) reaction was carried out according to manufacturer's instructions (Thermofisher or 7
Perkin Elmer). To perform double immunostaining for pERK and DUSP4, after the TSA reaction with the 8
first rabbit antibody, the peroxydase was inactivated by a 5 min 3% H2O2 treatment. Then the second 9
rabbit primary antibody staining was carried out as usual. Primary antibodies are listed in Supplementary 10
Table S1. 11
12
Phosphorylated ERK staining 13
Visualization of phosphorylated ERK (pERK) was performed by using two protocols. 14
(1) pERK Staining with 8% PFA: embryos which were collected from uterus or oviducts were precultured 15
in KSOM+AA medium at 37℃, 5% CO2. They were fixed in 8% PFA together with phosphatases 16
inhibitors: NaF (25 mM, Sigma), orthovanadate (2 mM, NEB) and β-glycerophosphate (50 mM, Santa 17
Cruz) for 10 min at RT. They were permeabilized 5 min in 0.5% Triton/PBS and aspecific sites were 18
blocked with 10% FBS/ 0.1% Triton/PBS for 30 min. Primary antibodies were added to the blocking 19
solution O/N at +4°C. Washes, secondary antibodies and tyramid signal amplification (TSA) reaction 20
according to manufacturer's instructions (Thermofisher or Perkin Elmer). (2) pERK staining with ProK: 21
embryos which were collected from uterus or oviducts were precultured in KSOM+AA medium at 37℃, 22
5% CO2 and fixed in 4% PFA with PhosSTOP (Roche) for 20 min on ice. Embryos were permeabilized and 23
activated with 10 ng/ml proteinase K (ProK) (Roche) in 0.1% Tween20/PBS at RT for 3-5 min, depending 24
on developmental stages. ProK reaction was stopped in 2 mg/ml Glycine-PBS for 2 min at RT and embryos 1
were washed in 0.1% Tween20/PBS. Blocking reaction was performed in 0.5% donkey serum/ 0.5% 2
Casein/ 0.5% BSA in PBS for 30 min at RT. Then, embryos were treated with the primary antibody in 3
blocking solution for overnight at 4℃. After washing with 0.1% Tween20 in PBS for three times, embryos 4
were treated with HRP-conjugated secondary antibody in blocking solution for 1 hr at RT. Tyramide signal 5
amplification (Thermofisher) was used to detect pERK signal. 6
7
Confocal microscope and image analyses 8
Leica TCS SP8, SP5 or SPE confocal microscopes were used to acquire the fluorescent images of 9
immunostained embryos as described previously (Azami et al., 2017; Gasnier et al., 2013). Look up table 10
(LUT) visualization of fluorescence intensity was processed by using Fiji. The "Thermal" range of LUT 11
indicates high levels of expression in red and low levels in blue. Unless otherwise indicated, images are 12
displaying single Z sections representative of the embryo. Cell counts were performed as previously 13
described (Bessonnard et al., 2014). 14
15
Single cell RTqPCR analyses 16
Isolated ICM cells (after immunosurgery, (Nagy, 2003)) and morulae (16C) were incubated 10 minutes in 17
1X TrypLE™ Express Enzyme (Gibco) at 37°C and cells were isolated by repeated mouth pipetting using 18
pulled capillaries of serially smaller diameter openings. Each single cell was collected in 5µl of 2X 19
Reaction Mix (Invitrogen, CellsDirect One-Step qRT-PCR Kit) and stored at -80°C or processed 20
immediately. Genotyping of embryos was carried out using TE cells from immunosurgery with Whole 21
Genome Amplification (WGA) using the REPLI-g kit (Qiagen) followed by PCR genotyping as above. 22
cDNA from desired genotypes was preamplified with 18 cycles. Quality and genotype checks were 23
performed by qPCR for each cell with housekeeping genes primers (RPS17 and RPL30) and primers 24
detecting the mutations. The analysed cells originate from at least 3 different embryos in each category. 1
Single-cell qPCR on a Fluidigm Biomark system (GENTYANE facility) was carried out on 48.48 or 96.96 2
Dynamic Arrays, according to the manufacturer’s instructions. Cells with absent or low Ct values for 3
housekeeping gene RPS17 and RPL30 were removed from analysis (5%). Ct values were normalized with 4
the mean of housekeeping gene RPS17 and RPL30 using the 2-ΔCt method. In boxplots, values are relative 5
to the mean of all WT 32C cells (WT-ref and WT from the transgenic background when available) to be 6
able to compare between genotypes and stages. Cells were considered in Fgf4–ve subpopulations when CT 7
values were above 35 and all other cells were placed in Fgf4+ve subpopulations. Primers used for this 8
study are listed in Supplementary table S2. 9
For the boxplots, he edges of the box represent 25th and 75th quartiles. The median is represented by the 10
central line. The whiskers extend to 1.5 times the interquartile range (25th to 75th percentile) Cells are 11
plotted individually in single-cell experiments. 12
13
Statistical analysis 14
Statistical tests were performed with Graphpad software. Statistical significance was assessed using the 15
Wilcoxon-Mann-Whitney test (non parametric) on expression levels 16
17
Acknowledgments 18
Images were acquired and treated at the CLIC imaging facility (Clermont-Fd). C.C. wants to thank C. 19
Pléver for genotyping the mice. 20
Author Contributions 21
C.C., C.B., T.A. and M. E. conceived and designed the experiments. C.B., T.A., L.V.E. and N.A. 22
performed the experiments. P.P. designed semi-automated image analyses. C.B., C.C., T.A., N.A and M.E. 23
analysed the data. C.C., T.A and M.E. wrote the manuscript. 24
Competing Interests 1
The authors declare no competing financial interests. 2
Funding 3
C.C. was supported by ANR "PrEpiSpec" and the FRM. T.A was supported by JSPS Grants-in-Aid for 4 Young Scientists (B). 5 6 References 7
Acampora, D., Omodei, D., Petrosino, G., Garofalo, A., Savarese, M., Nigro, V.,
8
Di Giovannantonio, L. G., Mercadante, V. and Simeone, A. (2016). Loss of the Otx2-Binding
9
Site in the Nanog Promoter Affects the Integrity of Embryonic Stem Cell Subtypes and
10Specification of Inner Cell Mass-Derived Epiblast. Cell Rep. 15, 2651–2664.
11Amit, I., Citri, A., Shay, T., Lu, Y., Katz, M., Zhang, F., Tarcic, G., Siwak, D., Lahad, J.,
12
Jacob-Hirsch, J., et al. (2007). A module of negative feedback regulators defines growth factor
13
signaling. Nat. Genet. 39, 503–512.
14Artus, J., Kang, M., Cohen-Tannoudji, M. and Hadjantonakis, A.-K. (2013). PDGF signaling
15
is required for primitive endoderm cell survival in the inner cell mass of the mouse blastocyst.
16Stem Cells Dayt. Ohio 31, 1932–41.
17
Aulehla, A., Wiegraebe, W., Baubet, V., Wahl, M. B., Deng, C., Taketo, M., Lewandoski, M.
18
and Pourquié, O. (2008). A β-catenin gradient links the clock and wavefront systems in mouse
19
embryo segmentation. Nat. Cell Biol. 10, 186–193.
20Azami, T., Waku, T., Matsumoto, K., Jeon, H., Muratani, M., Kawashima, A., Yanagisawa,
21
J., Manabe, I., Nagai, R., Kunath, T., et al. (2017). Klf5 maintains the balance of primitive
22
endoderm to epiblast specification during mouse embryonic development by suppression of Fgf4.
23Dev. Camb. Engl. 25, dev.150755.
24
Bessonnard, S., De Mot, L., Gonze, D., Barriol, M., Dennis, C., Goldbeter, A., Dupont, G.
25
and Chazaud, C. (2014). Gata6, Nanog and Erk signaling control cell fate in the inner cell mass
26
through a tristable regulatory network. Dev. Camb. Engl. 141, 3637–48.
27Bessonnard, S., Coqueran, S., Vandormael-Pournin, S., Dufour, A., Artus, J. and
28
Cohen-Tannoudji, M. (2017). ICM conversion to epiblast by FGF/ERK inhibition is limited in
29
time and requires transcription and protein degradation. Sci. Rep. 7, 12285.
30Boroviak, T., Loos, R., Bertone, P., Smith, A. and Nichols, J. (2014). The ability of inner cell
31
mass cells to self-renew as embryonic stem cells is acquired upon epiblast specification. Nat. Cell
32Boroviak, T., Loos, R., Lombard, P., Okahara, J., Behr, R., Sasaki, E., Nichols, J., Smith, A.
1
and Bertone, P. (2015). Lineage-Specific Profiling Delineates the Emergence and Progression of
2
Naive Pluripotency in Mammalian Embryogenesis. Dev. Cell 35, 366–382.
3Boyer, L. A., Lee, T. I., Cole, M. F., Johnstone, S. E., Levine, S. S., Zucker, J. P., Guenther,
4
M. G., Kumar, R. M., Murray, H. L., Jenner, R. G., et al. (2005). Core Transcriptional
5
Regulatory Circuitry in Human Embryonic Stem Cells. Cell 122, 947–956.
6Brewer, J. R., Mazot, P. and Soriano, P. (2016). Genetic insights into the mechanisms of Fgf
7
signaling. Genes Dev. 30, 751–71.
8Chazaud, C., Yamanaka, Y., Pawson, T., Rossant, J., He, J., Martin, W. D., Hamilton, T. C.,
9
Lambeth, J. D., Xu, X. X., Rossant, J., et al. (2006). Early lineage segregation between epiblast
10
and primitive endoderm in mouse blastocysts through the Grb2-MAPK pathway. Dev. Cell 10,
11615–24.
12Chu, Y., Solski, P. A., Khosravi-Far, R., Der, C. J. and Kelly, K. (1996). The
13
Mitogen-activated Protein Kinase Phosphatases PAC1, MKP-1, and MKP-2 Have Unique
14Substrate Specificities and Reduced Activity in Vivo toward the ERK2 sevenmaker Mutation. J.
15Biol. Chem. 271, 6497–6501.
16
Corson, L. B., Yamanaka, Y., Lai, K.-M. V. and Rossant, J. (2003). Spatial and temporal
17
patterns of ERK signaling during mouse embryogenesis. Dev. Camb. Engl. 130, 4527–37.
18Ding, W., Bellusci, S., Shi, W. and Warburton, D. (2003). Functional analysis of the human
19
Sprouty2 gene promoter. Gene 322, 175–185.
20Eblaghie, M. C., Lunn, J. S., Dickinson, R. J., Münsterberg, A. E., Sanz-Ezquerro, J.-J.,
21
Farrell, E. R., Mathers, J., Keyse, S. M., Storey, K. and Tickle, C. (2003). Negative Feedback
22
Regulation of FGF Signaling Levels by Pyst1/MKP3 in Chick Embryos. Curr. Biol. 13, 1009–
231018.
24Ekerot, M., Stavridis, M. P., Delavaine, L., Mitchell, M. P., Staples, C., Owens, D. M.,
25
Keenan, I. D., Dickinson, R. J., Storey, K. G. and Keyse, S. M. (2008). Negative-feedback
26
regulation of FGF signalling by DUSP6/MKP-3 is driven by ERK1/2 and mediated by Ets factor
27binding to a conserved site within the DUSP6/MKP-3 gene promoter. Biochem. J. 412, 287–298.
28Ema, M., Mori, D., Niwa, H., Hasegawa, Y., Yamanaka, Y., Hitoshi, S., Mimura, J., Kawabe,
29
Y., Hosoya, T., Morita, M., et al. (2008). Krüppel-like factor 5 is essential for blastocyst
30
development and the normal self-renewal of mouse ESCs. Cell Stem Cell 3, 555–67.
31Feldman, B., Poueymirou, W., Papaioannou, V. E., DeChiara, T. M. and Goldfarb, M.
32
(1995). Requirement of FGF-4 for postimplantation mouse development. Science 267, 246–9.
33Festuccia, N., Osorno, R., Halbritter, F., Karwacki-Neisius, V., Navarro, P., Colby, D., Wong,
34
F., Yates, A., Tomlinson, S. R. and Chambers, I. (2012). Esrrb Is a Direct Nanog Target Gene
35
that Can Substitute for Nanog Function in Pluripotent Cells. Cell Stem Cell 11, 477–490.
36Frankenberg, S., Gerbe, F., Bessonnard, S., Belville, C., Pouchin, P., Bardot, O. and
1
Chazaud, C. (2011). Primitive Endoderm Differentiates via a Three-Step Mechanism Involving
2
Nanog and RTK Signaling. Dev. Cell 21, 1005–1013.
3Gasnier, M., Dennis, C., Vaurs-Barrière, C. and Chazaud, C. (2013). Fluorescent mRNA
4
labeling through cytoplasmic FISH. Nat. Protoc. 8, 2538–2547.
5Guo, G., Huss, M., Tong, G. Q., Wang, C., Li Sun, L., Clarke, N. D. and Robson, P. (2010).
6
Resolution of cell fate decisions revealed by single-cell gene expression analysis from zygote to
7blastocyst. Dev. Cell 18, 675–85.
8Herriges, J. C., Verheyden, J. M., Zhang, Z., Sui, P., Zhang, Y., Anderson, M. J., Swing, D.
9
A., Zhang, Y., Lewandoski, M. and Sun, X. (2015). FGF-Regulated ETV Transcription Factors
10
Control FGF-SHH Feedback Loop in Lung Branching. Dev. Cell 35, 322–332.
11Kang, M., Piliszek, A., Artus, J. and Hadjantonakis, A.-K. (2013). FGF4 is required for lineage
12
restriction and salt-and-pepper distribution of primitive endoderm factors but not their initial
13expression in the mouse. Dev. Camb. Engl. 140, 267–79.
14Kang, M., Garg, V. and Hadjantonakis, A.-K. (2017). Lineage Establishment and Progression
15
within the Inner Cell Mass of the Mouse Blastocyst Requires FGFR1 and FGFR2. Dev. Cell 41,
16496-510.e5.
17Khoa, L. T. P., Azami, T., Tsukiyama, T., Matsushita, J., Tsukiyama-Fujii, S., Takahashi, S.
18
and Ema, M. (2016). Visualization of the Epiblast and Visceral Endodermal Cells Using
19
Fgf5-P2A-Venus BAC Transgenic Mice and Epiblast Stem Cells. PloS One 11, e0159246.
20Krawchuk, D., Honma-Yamanaka, N., Anani, S. and Yamanaka, Y. (2013). FGF4 is a
21
limiting factor controlling the proportions of primitive endoderm and epiblast in the ICM of the
22mouse blastocyst. Dev. Biol. 384, 65–71.
23Kunath, T., Saba-El-Leil, M. K., Almousailleakh, M., Wray, J., Meloche, S. and Smith, A.
24
(2007). FGF stimulation of the Erk1/2 signalling cascade triggers transition of pluripotent
25embryonic stem cells from self-renewal to lineage commitment. Dev. Camb. Engl. 134, 2895–902.
26Kurimoto, K., Yabuta, Y., Ohinata, Y., Ono, Y., Uno, K. D., Yamada, R. G., Ueda, H. R. and
27
Saitou, M. (2006). An improved single-cell cDNA amplification method for efficient high-density
28
oligonucleotide microarray analysis. Nucleic Acids Res. 34, e42.
29Lemmon, M. A. and Schlessinger, J. (2010). Cell Signaling by Receptor Tyrosine Kinases. Cell
30
141, 1117–1134.
31
Liu, Y., Jiang, H., Crawford, H. C. and Hogan, B. L. M. (2003). Role for ETS domain
32
transcription factors Pea3/Erm in mouse lung development. Dev. Biol. 261, 10–24.
33Loh, Y.-H., Wu, Q., Chew, J.-L., Vega, V. B., Zhang, W., Chen, X., Bourque, G., George, J.,
34
Leong, B., Liu, J., et al. (2006). The Oct4 and Nanog transcription network regulates
35
pluripotency in mouse embryonic stem cells. Nat. Genet. 38, 431–40.
36Menchero, S., Rayon, T., Andreu, M. J. and Manzanares, M. (2016). Signaling pathways in
1
mammalian preimplantation development: Linking cellular phenotypes to lineage decisions. Dev.
2Dyn. 246, 245–261.
3
Mitsui, K., Tokuzawa, Y., Itoh, H., Segawa, K., Murakami, M., Takahashi, K., Maruyama,
4
M., Maeda, M. and Yamanaka, S. (2003). The homeoprotein Nanog is required for maintenance
5
of pluripotency in mouse epiblast and ES cells. Cell 113, 631–42.
6Molotkov, A., Mazot, P., Brewer, J. R., Cinalli, R. M. and Soriano, P. (2017). Distinct
7
Requirements for FGFR1 and FGFR2 in Primitive Endoderm Development and Exit from
8Pluripotency. Dev. Cell 26, 469–82.
9Morgani, S., Nichols, J. and Hadjantonakis, A.-K. (2017). The many faces of Pluripotency: in
10
vitro adaptations of a continuum of in vivo states. BMC Dev. Biol. 17, 7.
11Morgani, S. M., Saiz, N., Garg, V., Raina, D., Simon, C. S., Kang, M., Arias, A. M., Nichols,
12
J., Schröter, C. and Hadjantonakis, A.-K. (2018). A Sprouty4 reporter to monitor FGF/ERK
13
signaling activity in ESCs and mice. Dev. Biol. 441, 104–126.
14Murakami, K., Günesdogan, U., Zylicz, J. J., Tang, W. W. C., Sengupta, R., Kobayashi, T.,
15
Kim, S., Butler, R., Dietmann, S. and Surani, M. A. (2016). NANOG alone induces germ cells
16
in primed epiblast in vitro by activation of enhancers. Nature 529, 403–7.
17Nagy, A. (2003). Manipulating the Mouse Embryo: A Laboratory Manual. Cold Spring Harbor
18
Laboratory Press.
19Neben, C. L., Lo, M., Jura, N. and Klein, O. D. (2017). Feedback regulation of RTK signaling
20
in development. Dev. Biol.
21Nichols, J., Silva, J., Roode, M. and Smith, A. (2009). Suppression of Erk signalling promotes
22
ground state pluripotency in the mouse embryo. Dev. Camb. Engl. 136, 3215–22.
23Nishioka, N., Inoue, K., Adachi, K., Kiyonari, H., Ota, M., Ralston, A., Yabuta, N., Hirahara,
24
S., Stephenson, R. O., Ogonuki, N., et al. (2009). The Hippo signaling pathway components Lats
25
and Yap pattern Tead4 activity to distinguish mouse trophectoderm from inner cell mass. Dev.
26Cell 16, 398–410.
27
Niwa, Y., Masamizu, Y., Liu, T., Nakayama, R., Deng, C.-X. and Kageyama, R. (2007). The
28
Initiation and Propagation of Hes7 Oscillation Are Cooperatively Regulated by Fgf and Notch
29Signaling in the Somite Segmentation Clock. Dev. Cell 13, 298–304.
30Ohnishi, Y., Huber, W., Tsumura, A., Kang, M., Xenopoulos, P., Kurimoto, K., Oleå, A. K.,
31
Araúzo-Bravo, M. J., Saitou, M., Hadjantonakis, A. K., et al. (2014). Cell-to-cell expression
32
variability followed by signal reinforcement progressively segregates early mouse lineages. Nat.
33Cell Biol. 16, 27–37.
34
Patel, A. L. and Shvartsman, S. Y. (2018). Outstanding questions in developmental ERK
35
signaling. Dev. Camb. Engl. 145, dev143818.
36Plusa, B., Piliszek, A., Frankenberg, S., Artus, J. and Hadjantonakis, A.-K. (2008). Distinct
1
sequential cell behaviours direct primitive endoderm formation in the mouse blastocyst. Dev.
2Camb. Engl. 135, 3081–91.
3
Posfai, E., Petropoulos, S., de Barros, F. R. O., Schell, J. P., Jurisica, I., Sandberg, R.,
4
Lanner, F. and Rossant, J. (2017). Position- and hippo signaling-dependent plasticity during
5
lineage segregation in the early mouse embryo. eLife 6, 1–3.
6Raible, F. and Brand, M. (2001). Tight transcriptional control of the ETS domain factors Erm
7
and Pea3 by Fgf signaling during early zebrafish development. Mech. Dev. 107, 105–117.
8Reginensi, A., Clarkson, M., Neirijnck, Y., Lu, B., Ohyama, T., Groves, A. K., Sock, E.,
9
Wegner, M., Costantini, F., Chaboissier, M.-C., et al. (2011). SOX9 controls epithelial
10
branching by activating RET effector genes during kidney development. Hum. Mol. Genet. 20,
111143–1153.
12Roehl, H. and Nüsslein-Volhard, C. (2001). Zebrafish pea3 and erm are general targets of FGF8
13
signaling. Curr. Biol. 11, 503–507.
14Saiz, N., Williams, K. M., Seshan, V. E. and Hadjantonakis, A. K. (2016). Asynchronous fate
15
decisions by single cells collectively ensure consistent lineage composition in the mouse
16blastocyst. Nat. Commun. 7,.
17Shapiro, P. S., Vaisberg, E., Hunt, A. J., Tolwinski, N. S., Whalen, A. M., McIntosh, J. R.
18
and Ahn, N. G. (1998). Activation of the MKK/ERK Pathway during Somatic Cell Mitosis:
19
Direct Interactions of Active ERK with Kinetochores and Regulation of the Mitotic 3F3/2
20Phosphoantigen. J. Cell Biol. 142, 1533–1545.
21Sharrocks, A. D. (2001). The ETS-domain transcription factor family. Nat. Rev. Mol. Cell Biol. 2,
22
827–837.
23Smith, A. (2017). Formative pluripotency: the executive phase in a developmental continuum.
24
Dev. Camb. Engl. 144, 365–373.
25
Sodhi, C. P., Li, J. and Duncan, S. A. (2006). Generation of mice harbouring a conditional
26
loss-of-function allele of Gata6. BMC Dev. Biol. 6, 19.
27Willecke, R., Heuberger, J., Grossmann, K., Michos, O., Schmidt-Ott, K., Walentin, K.,
28
Costantini, F. and Birchmeier, W. (2011). The tyrosine phosphatase Shp2 acts downstream of
29
GDNF/Ret in branching morphogenesis of the developing mouse kidney. Dev. Biol. 360, 310–
30317.
31Yamanaka, Y., Lanner, F. and Rossant, J. (2010). FGF signal-dependent segregation of
32
primitive endoderm and epiblast in the mouse blastocyst. Dev. Camb. Engl. 137, 715–24.
331
2
Figure 1: pERK expression during Epi/PrE specification. A. Immunolocalisation from E2.75 to E3.75. 3
Signal intensity is colour scaled. B. Five-colour imaging with pERK, CDX2, NANOG and GATA6 4
immunostaining from E3.25 to E3.75. C. Number of pERK expressing cells at E3.25 (n=30 embryos), E3.5 5
(n=30) and E3.75 (n=30). D. Repartition of pERK expressing cells between NANOG+/GATA6- (N+), 6
NANOG-/GATA6+ (G6+) and NANOG+/GATA6+ (N+G6+) populations at E3.25 (n=16 embryos), E3.5 7
(n=9) and E3.75 (n=11). Scale bars: 10 microns. 8
1
Figure 2: pERK immunostaining during implantation stages and in ES cells. A. Expression in two 2
representative E4.5 embryos showing pERK expression in some PrE cells labelled by GATA6 and in some 3
Epi cells (arrowheads). B. pERK expression at E6.5 with a strong labelling in the extraembryonic ectoderm 4
(ExE) and some PrE cells (arrowheads). The Fgf5-Venus reporter labels the Epi and the embryonic part of 5
the visceral endoderm. C. pERK expression in ES cells, co-stained with OCT3/4 and NANOG, cultured in 6
absence (top panel) or presence of the MEK inhibitor (bottom panel). Scale bars: 10 (A,B) 100 (C) 7
microns. 8
1
Figure 3: pERK expression in mutant embryos during preimplantation, at indicated stages A. pERK, 2
NANOG and GATA6 expression in Fgf4 mutants (Fgf4-/- n= 5). B. pERK, NANOG and GATA6
3
expression in Klf5 mutants (Klf5-/- n= 5). C. pERK and NANOG expression in Nanog mutants (Nanog
-/-4
n=5). D. pERK and NANOG expression in Gata6 mutants (Gata6-/- n=4). E. Single-cell RNA expression
5
of Fgf4, Fgfr1 and Fgfr2 in individual ICM cells isolated from Nanog-/- (n= 15 cells), Gata6-/- (n= 13 cells)
6
and WT (n= 24 cells) embryos at E3.25. Red asterisks indicate the significant differences of expression 7
between mutant and WT samples *p<0,05, **p<0,01, ***p<0,001 (Wilcoxon test). Scale bars: 10 microns. 8
1
Figure 4: Expression of FGF pathway related genes. A. Single-cell RNA expression of Dusp4, Etv5, Etv4, 2
Fgfr1 and Fgfr2 in single cells from the 16-cell stage embryos (n= 18 cells) and from ICM at E3.25 (n=29 3
cells), E3.5 (n=33 cells) and E3.75 (n=24 cells). At the later stages, ICM populations were subdivided into 4
two groups defined by the presence (+) or absence (-) of Fgf4 expression in the cell. This enables 5
discrimination between Epi (+) and PrE (-) cells. Experiments at the 16-cell stage were not carried out for 6
Etv4 and Etv5 (n.d.: not determined). Asterisks indicate the significant differences of expression between 7
Fgf4+ and Fgf4- cells (Wilcoxon tests: * p<0.05, ** p< 0.01, *** p< 0.001). B. Expression of pERK, 8
DUSP4 and GATA6 at E3.25 and E3.75. C. Number of DUSP4 expressing cells per embryo at E3.25 9
(n=15 embryos), E3.5 (n=18) and E3.75 (n=11). The right panel indicates the percentage of cell 10
co-expression with NANOG, GATA6 or NANOG+GATA6. D. Expression of DUSP4 and NANOG in 11
Nanog-/- (Nanog-/- n=5) and Gata6-/- (Gata6-/- n=6) embryos. Scale bars: 10 microns.
1
2
Figure 5: Expression of ETV5. A. Immunostaining of ETV5, together with NANOG and SOX17, in 3
embryos cultured with either FGF2 (n=6) or MEK+FGFR inhibitors (n=17) from E2.5 to E3.75. B. ETV5 4
expression in Nanog-/- (n=4) and Gata6-/- (n=3) embryos. Scale bars: 10 microns. C. Working model. In the 5
precursor cell (16-cell/E3.25 stage), co-expressing NANOG and GATA6, KLF5 and possibly SPRY4 6
inhibit the FGF pathway. KLF5 expression decreases during blastocyst growth. Precursor cells can 7
differentiate into either Epi or a PrE between E3.25 and E3.75 in an asynchronous manner. In Epi cells, 8
NANOG induces the expression of both Fgf4 and ETV5. Upon ETV5 induction, or possibly NANOG's, 9
SPRY2 inhibits the ERK pathway, protecting the cell from autocrine as well as paracrine FGF4. In PrE 10
cells, pERK is activated by FGF4 secreted by neighbouring EPI cells, leading to the maintenance of 11
GATA6 expression and down regulation of NANOG's. Together with pERK, GATA6 induces downstream 12
PrE genes such as SOX17 and GATA4. DUSP4 is activated by pERK independently of GATA6. It 13
possibly resensitises the FGF pathway by de-phosphorylating ERK. Thick connections represent activated 14
Supplementary Information 1
2
Figure S1. Validation of pERK staining in blastocysts. A. Parallel staining of pERK, GATA6 and CDX2 3
with the High PFA and ProK protocols. B. pERK expression at E3.75 with signal in the TE (arrow) and 4
ICM. The yellow arrowhead points toward a mitotic cell. C,D. pERK expression after embryo cultures for 5
30h (C) or 10 min (D) with FGF. E. pERK immunostaining after cultures with MEK1 inhibitor. Scale bars: 6
1
2
Figure S2. A. DUSP4, NANOG and SOX17 immunolabelling in embryos cultured with either MEK 3
inhibitor or FGF2 from E2.5 to E3.75. Scale bars: 10 microns. B. Number of cells expressing ETV5 per 4
embryo at E3.5-E3.75 and their distribution between precursor (N+G6+), Epi (N+) or PrE cells (G6+). 5
6 7
8
Figure S3. Expression of indicated genes by single-cell RNA-seq extracted from (Posfai et al., 2017) at the 9
16-cell stage (33 inner and outer cells), E3.25 (32-C, 40 ICM cells) and E3.5 (64-C, 33 ICM cells). 10
Table S1: List of primary antibodies used 1
2
Epitope host supplier reference
pERK rabbit Cell Signaling 4370
GATA6 goat R&D AF1700
NANOG rabbit Abcam ab80892
NANOG rat e-bioscience 14-5761
DUSP4 rabbit Abcam ab216576
ETV5 rabbit Proteintech 13011-1-AP
SOX17 goat R&D AF1924
CDX2 mouse Abcam ab89949
OCT3/4 mouse SantaCruz Sc-5279
3
Table S2: list of primers used for the single-cell RTqPCR 4
5
RefSeq # Gene Forward Reverse
NM_176933.4 Dusp4 AGCTCCTGGTTCATGGAAGC ACTCAAAAGCCTCCTCCAGC
NM_023794 Etv5 CAGAACCTGGATCACAGCAA GACTGAGGAGGGAAGGGATG
NM_010202 Fgf4 ACTACCTGCTGGGCCTCAA ACTCCGAAGATGCTCACCAC NM_001079908 Fgfr1 GCTATAACCCCAGCCACAAC AGCCAAAGTCTGCGATCTTC NM_010207 Fgfr2 CACCAACTGCACCAATGAAC GAATCGTCCCCTGAAGAACA NM_001163485 Rpl30 AGTCTCTGGAGTCGATCAACT AGCCAGTGTGCATACTCTGTAG NM_009092 Rps17 ATGACTTCCACACCAACAAGC GCCAACTGTAGGCTGAGTGAC 6