HAL Id: hal-01484978
https://hal.archives-ouvertes.fr/hal-01484978
Submitted on 8 Mar 2017HAL is a multi-disciplinary open access archive for the deposit and dissemination of sci-entific research documents, whether they are pub-lished or not. The documents may come from teaching and research institutions in France or abroad, or from public or private research centers.
L’archive ouverte pluridisciplinaire HAL, est destinée au dépôt et à la diffusion de documents scientifiques de niveau recherche, publiés ou non, émanant des établissements d’enseignement et de recherche français ou étrangers, des laboratoires publics ou privés.
Inside Speech: Multisensory and Modality-specific
Processing of Tongue and Lip Speech Actions
Avril Treille, Coriandre Vilain, Thomas Hueber, Laurent Lamalle, Marc Sato
To cite this version:
Avril Treille, Coriandre Vilain, Thomas Hueber, Laurent Lamalle, Marc Sato. Inside Speech: Mul-tisensory and Modality-specific Processing of Tongue and Lip Speech Actions. Journal of Cognitive Neuroscience, Massachusetts Institute of Technology Press (MIT Press), 2017, 29 (3), pp.448-466. �10.1162/jocn_a_01057�. �hal-01484978�
Inside Speech: Multisensory and Modality-specific
Processing of Tongue and Lip Speech Actions
Avril Treille
1, Coriandre Vilain
1, Thomas Hueber
1,
Laurent Lamalle
2,3, and Marc Sato
4Abstract
■ Action recognition has been found to rely not only on sen-sory brain areas but also partly on the observer’s motor system. However, whether distinct auditory and visual experiences of an action modulate sensorimotor activity remains largely un-known. In the present sparse sampling fMRI study, we deter-mined to which extent sensory and motor representations interact during the perception of tongue and lip speech actions. Tongue and lip speech actions were selected because tongue movements of our interlocutor are accessible via their impact on speech acoustics but not visible because of its position inside the vocal tract, whereas lip movements are both“audible” and visible. Participants were presented with auditory, visual, and audiovisual speech actions, with the visual inputs related to either a sagittal view of the tongue movements or a facial view of the lip movements of a speaker, previously recorded by an ultrasound imaging system and a video camera. Although the
neural networks involved in visual visuo-lingual and visuo-facial perception largely overlapped, stronger motor and somato-sensory activations were observed during visuo-lingual percep-tion. In contrast, stronger activity was found in auditory and visual cortices during visuo-facial perception. Complementing these findings, activity in the left premotor cortex and in visual brain areas was found to correlate with visual recognition scores observed for visuo-lingual and visuo-facial speech stim-uli, respectively, whereas visual activity correlated with RTs for both stimuli. These results suggest that unimodal and multi-modal processing of lip and tongue speech actions rely on com-mon sensorimotor brain areas. They also suggest that visual processing of audible but not visible movements induces motor and visual mental simulation of the perceived actions to facili-tate recognition and/or to learn the association between audi-tory and visual signals. ■
INTRODUCTION
Through life experiences, we learn about which sensory features of actions are most behaviorally relevant for successful categorization and recognition. However, one intriguing question is to know what happens when an action is not accessible to one sensor in the daily experience—typically, accessible via their impact on acoustics but not visible. From this question, this fMRI study aimed at determining multisensory and modality-specific processing of tongue and lip speech actions, with tongue movements of our interlocutor usually “audi-ble” but not visible and lip movements both “audible” and visible.
Motor Resonance in Biological Action Recognition Although information from different sensory modalities, such as sight and/or sound, is processed in unisensory and multisensory brain areas, several studies have
iden-tified a central role for motor representations in action recognition. These results appear in keeping with the long-standing proposal that perception and action are two closely linked processes and with more recent neuro-physiological perspectives based on the existence of mirror neurons in nonhuman primates and on an action– perception matching system in humans (for reviews, see Rizzolatti & Craighero, 2004; Rizzolatti, Fogassi, & Gallese, 2001). Mirror neurons are polymodal visuo-motor or audio–visuomotor neurons in the ventral pre-motor and posterior parietal cortices (areas F5 and PF) of the macaque monkey, which have been shown to dis-charge both when the monkey performs hand or mouth actions and when it views or listens to similar actions made by another individual (e.g., Fogassi et al., 2005; Ferrari, Gallese, Rizzolatti, & Fogassi, 2003; Keysers et al., 2003; Kohler et al., 2002; Gallese, Fadiga, Fogassi, & Rizzolatti, 1996; Rizzolatti, Fadiga, Gallese, & Fogassi, 1996; Di Pellegrino, Fadiga, Fogassi, Gallese, & Rizzolatti, 1992). The existence of mirror neurons thus suggests that action observation partly involves the same neural circuits that are used in action performance. Since then, auditory– vocal mirror neurons have also been recorded in non-mammalian vertebrates (Prather, Peters, Nowicki, &
1
CNRS UMR 5216 & Grenoble Université,2Université Grenoble-Alpes & CHU de Grenoble,3CNRS UMS 3552, Grenoble, France,
4
Mooney, 2008), and numerous neurophysiological and brain imaging experiments have provided evidence for the existence of a frontoparietal action–perception match-ing system in humans (Rizzolatti & Craighero, 2004). Alto-gether, these studies demonstrate that sensory information related to biological movements is not only processed in sensory regions but also in the observer’s motor system and partly relies on his or her own motor knowledge.
From that view, a stronger activity in the premotor cor-tex and the posterior parietal corcor-tex is observed during visual and audiovisual perception of biological movements, compared with nonbiological movements (e.g., Saygin, 2007; Calvert, Campbell, & Brammer, 2000; Howard et al., 1996). Moreover, hearing action-related sounds like knock on the door or hand clapping or more complex auditory material like a piano piece also activates motor and premotor regions (e.g., Lahav, Saltzman, & Schlaug, 2007; Pizzamiglio et al., 2005; Aziz-Zadeh, Iacoboni, Zaidel, Wilson, & Mazziotta, 2004; Haueisen & Knösche, 2001). These results support the long-standing theoretical pro-posal that specific constraints and regularity in biological motion and kinematics are used in action recognition (Viviani & Stucchi, 1992; Johansson, 1973), even when they are roughly represented by point lights (Loula, Prasad, Harber, & Shiffrar, 2005; Beardsworth & Buckner, 1981). Furthermore, action recognition seems to rely not only on biological features per se but also more specifically on a motor repertoire shared by individuals of the same species and related to their relevant physical and/or communicative ability for perceptual processing. For example, Tai, Scherfler, Brooks, Sawamoto, and Castiello (2004) observed premotor activity during the sight of human hand grasp but not during the sight of the same action performed by a robot, which supports the use of a human biological motor repertoire in action recognition. On their side, Buccino et al. (2004) showed that the obser-vation of a biting action performed by humans, monkeys, or dogs induced motor activity in humans, contrary to what happens during the observation of dog-specific barking movements. Calvo-Merino and colleagues (Calvo-Merino, Grèzes, Glaser, Passingham, & Haggard, 2006; Calvo-Merino, Glaser, Grèzes, Passingham, & Haggard, 2005) also showed that, apart from visual familiarity, the involvement of motor areas during action observation strongly relies on motor learning. They indeed observed, among other parie-tal and cerebellar regions, stronger premotor cortex activity when male dancers viewed dance movements from their own motor repertoire compared with female dance move-ments that they often saw but never performed. Although a causal role of the motor system during action recogni-tion is still debated, these fMRI studies suggest a strong correlation between motor activity and action observation.
Motor Resonance Extends to Speech Action
Speech is a special type of biological human actions that interfaces with the linguistic system and requires an
accu-rate control of our speech articulators (i.e., the lips, the tongue, the jaw, the velum, and the larynx). As with other type of actions, such as grasping or walking, several neuro-imaging studies suggest that speech recognition is also partly mediated by the motor system. Brain areas involved in the planning and execution of speech actions (i.e., the posterior part of the left inferior frontal gyrus, the pre-motor and primary pre-motor cortices) have indeed shown neural responses during auditory speech perception (e.g., Pulvermuller et al., 2006; Wilson & Iacoboni, 2006; Wilson, Saygin, Sereno, & Iacoboni, 2004). In addition, repetitive and double-pulse TMS studies also suggest that speech motor regions are causally recruited during audi-tory speech categorization, especially in case of complex situations (e.g., the perception of acoustically ambiguous syllables or when phonological segmentation or working memory processes are strongly required; Grabski et al., 2013; d’Ausilio, Bufalari, Salmas, & Fadiga, 2011; d’Ausilio et al., 2009; Möttönen & Watkins, 2009; Sato, Tremblay, & Gracco, 2009; Meister, Wilson, Deblieck, Wu, & Iacoboni, 2007). Taken together, these results support the idea that our motor knowledge used to produce speech sounds helps to partly constraint phonetic decoding of the sen-sory inputs, as proposed in motor and sensorimotor theories of speech perception and language comprehen-sion (Pickering & Garrod, 2013; Schwartz, Ménard, Basirat, & Sato, 2012; Skipper, Van Wassenhove, Nussman, & Small, 2007; Liberman & Mattingly, 1985).
Importantly, speech provides visual as well as auditory information. Although humans are proficient to extract phonetic features from the acoustic signal alone and, to a lesser extent, are capable to partly read on lips when audition is lacking, interactions between auditory and visual modalities are beneficial in speech perception. Neuroimaging studies demonstrate the existence of spe-cific brain areas playing a key role in the audiovisual inte-gration of speech. Notably, activity within unisensory visual and auditory regions (the visual motion-sensitive cortex, V5/MT, and the Heschl’s gyrus) as well as within multisensory regions (the posterior parts of the left supe-rior temporal gyrus/STS [pSTS/pSTG]) is modulated dur-ing audiovisual speech perception, when compared with auditory and visual unimodal conditions (Skipper et al., 2007; Skipper, Nusbaum, & Small, 2005; Callan et al., 2003, 2004; Calvert et al., 2000). Because pSTS/pSTG dis-plays supra-additive and subadditive responses during congruent and incongruent stimuli presentation, it has been proposed that both visual and auditory speech in-formation are integrated in these high-level multisensory integrative regions and that modulations of neuronal responses within the sensory-specific cortices would then be due to feedback projections from this multi-sensory region. Such modulations would represent the physiological correlates of the perceptual changes expe-rienced after multisensory integration (e.g., Beauchamp, 2005; Beauchamp, Argall, Bodurka, Duyn, & Martin, 2004; Beauchamp, Lee, Argall, & Martin, 2004; Calvert
et al., 2000). In addition, premotor and motor cortices, known to play a crucial role in speech production, might also play a key role in audiovisual integration mechanisms in speech perception (e.g., Sato, Buccino, Gentilucci, & Cattaneo, 2010; Watkins & Paus, 2004; Calvert & Campbell, 2003; Watkins, Strafella, & Paus, 2003; Campbell et al., 2001). From that view, Skipper and colleagues (2005, 2007) observed stronger activation in speech motor re-gions during audiovisual speech perception, compared with auditory and visual unimodal conditions. Callan and colleagues (2003, 2004) also demonstrated increased motor activity under adverse listening or viewing con-ditions during bimodal speech presentation. In addition, increased activity or, on the contrary, subadditive re-sponses in the Broca’s area have also been reported during the perception of incongruent compared with congruent audiovisual speech stimuli (Pekkola et al., 2006; Ojanen et al., 2005) or compared with unimodal speech stimuli (Calvert et al., 2000). From these results, multisensory areas and speech motor regions appear as good candidates for brain areas where acoustic and visual speech signals can interact, which suggests a possible integration between incoming sensory signals and speech motor knowledge specific to the listener.
Motor Resonance for Audible but Hidden Actions If the motor system is indeed involved in multisensory integration, what happens when an action is not acces-sible to one sensor in the daily experience—typically audible but not visible? We know from the classic studies by Meltzoff and Moore (1977, 1983) that 3-week-old in-fants, and even newborns, are able to associate from birth a visual action they have never seen, like lip and tongue protrusion, with motor commands, possibly through the use of their proprioceptive system. This indirectly sug-gests that, in adults, the sensorimotor network could play a role in the visual processing of audible but not visible actions by enabling a transfer of motor knowledge toward an inferred visual experience, possibly combined with past auditory and somatosensory experiences.
Lips and tongue are two perfect articulators to test this specific question. First, we have an excellent somatosensory–motor control of both articulators, notably during speaking. Second, because of their posi-tion inside the vocal tract, tongue movements of our interlocutor are usually“audible” but not visible, whereas lip movements are both “audible” and visible. Inter-estingly, few behavioral studies using virtual tongue movements or ultrasound images of tongue movements demonstrate stronger speech learning with a visual tongue feedback (Katz & Mehta, 2015) and an enhance-ment of auditory stimuli discrimination when they are matched with related visual tongue movements compared with auditory-only or incongruent audio-visuo-lingual stimuli (d’Ausilio, Bartoli, Maffongelli, Berry, & Fadiga, 2014; Badin, Tarabalka, Elisei, & Bailly, 2010).
To determine the neural networks involved in the perceptual processing of visuo-lingual and visuo-facial actions, an fMRI study on unimodal and multimodal speech perception was conducted. Participants had to recognize auditory, visual, or audiovisual speech stim-uli, with the visual presentation related to either a sag-ittal view of the tongue movements or a facial view of the lip movements of a speaker, with lingual and facial movements previously recorded by an ultrasound im-aging system and a video camera. Our first goal was to determine the shared neural correlates of visual and audiovisual tongue and lip movements as well as the neural specificity of lingual perception compared with facial perception. We also examined possible similar-ities and differences in the integration between audio-visuo-lingual and audio-visuo-facial modalities and the correlation between neural activity and visual syllable recognition scores.
METHODS
Participants
Fourteen healthy adults (seven women and seven men with a mean age of 26 years, ranging from 18 to 44 years), who are native French speakers, participated in the study after giving their informed consent. Two par-ticipants were removed from the study because of excessive head movements or technical problems dur-ing MRI acquisition. All participants were right-handed according to standard handedness inventory (Oldfield, 1971), had normal or corrected-to-normal vision, and reported no history of speaking, hearing, or motor dis-orders. The protocol was approved by the Grenoble Uni-versity Ethical Committee with all participants screened for neurological, psychiatric, and other possible medical problems and contraindications to MRI. None of the par-ticipants were experienced with visuo-lingual ultrasound images.
Stimuli
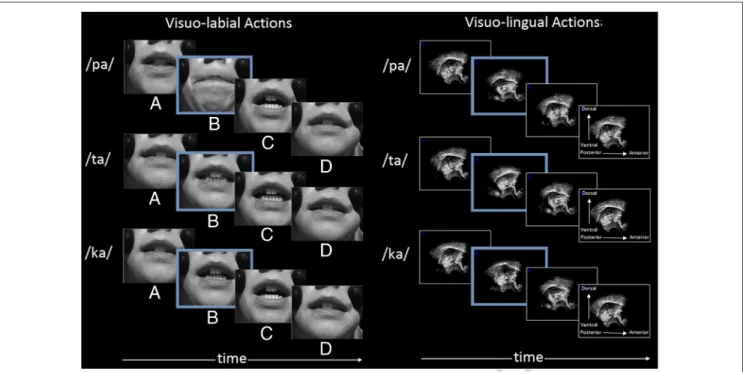
Before the experiment, multiple utterances of /pa/, /ta/, and /ka/ syllables were individually recorded by one male and one female speakers in a soundproof room. These syllables were selected based on previous studies on audiovisual speech perception to ensure a gradient of visuo-labial saliency (with notably the bilabial /p/ consonant known to be more visually salient than alveolar /t/ and velar /k/ consonants). Regarding visuo-lingual saliency, /t/ and /k/ consonants have more visible tongue movement than /p/ because of the involvement of the apex or the dorsum of the tongue during alveolar or velar occlusion (see Figure 1).
Synchronous recordings of auditory, visual, and ultra-sound signals were acquired by the Ultraspeech system
(Hueber, Chollet, Denby, & Stone, 2008) composed of a Terason T3000 ultrasound scanner, a 140° microconvex transducer with 128 elements (tongue movements ac-quired with a sampling rate of 60 fps with a 320 × 240 pixel resolution), an industrial USB color camera (facial movements acquired with a sampling rate of 60 fps with a 640 × 480 pixel resolution), and an external micro-phone connected to an RME Fireface800 soundcard (audio digitizing at 44.1 kHz with 16-bit quantization recording).
Two clearly articulated /pa/, /ta/, and /ka/ tokens were selected per speaker (with the speaker initiating each utterance from a neutral mid-open mouth position), pro-viding 12 syllables altogether. Sixty stimuli were created consisting of the 12 distinct /pa/, /ta/, and /ka/ syllables related to five conditions: an auditory condition (A), two visual conditions related to either facial (i.e., lip move-ments) or tongue movements of a speaker (VF, VT), and
two audiovisual conditions including either facial or tongue movements of a speaker (AVF, AVT). The auditory
signal intensities were normalized using a common maxi-mal amplitude criterion, and each movie was 80 frames long (1333 msec). To limit possible effects of predictability, variability was introduced with different acoustic conso-nantal onsets (mean = 450 msec,SD = 193 msec), acoustic durations (mean = 514 msec,SD = 139 msec), visuo-facial onsets (mean = 250 msec,SD = 149 msec), and visuo-lingual onsets (mean = 276 msec,SD = 252 msec), while keeping temporal congruency between auditory and visual signals in audiovisual conditions.
Procedure
Behavioral Experiment
Before the fMRI session, participants were first presented with a subset of the recorded speech stimuli, with short explanations about the tongue movements during the production of /pa/, /ta/, and /ka/ syllables and how these movements are imaged by the ultrasound system. They then underwent a three-alternative forced-choice identi-fication task, having been instructed to categorize as quickly as possible each perceived syllable with their right hand. Participants sat in front of a computer moni-tor at a distance of approximately 50 cm. The acoustic stimuli were presented at a comfortable sound level through headphones, with the same sound level set for all participants. The Presentation software (Neurobehav-ioral Systems, Albany, CA) was used to control the stim-ulus presentation and to record key responses. The experiment consisted of 60 trials presented in a random-ized sequence, with 12 trials related to each modality of presentation (A, VF, VT, AVF, and AVT). The intertrial
in-terval was of 3 sec, and the response key designation was fully counterbalanced across participants. Importantly, participants did not receive any feedback regarding their performance.
fMRI Experiment
Immediately after the behavioral experiment, the fMRI ses-sion consisted of one anatomical scan and one functional
Figure 1. Examples of visual stimuli related to lip and tongue movements for /pa/, /ta/, and /ka/ syllables at four crucial moments: (A) initial neutral position, (B) closure of the vocal tract (in red, /pa/: bilabial occlusion; /ta/: alveolar occlusion, with tongue behind the teeth; /ka/: velar occlusion, with tongue against the palate), (C) vowel production with a maximum opening of the mouth and with the tongue at the back of the vocal tract, and (D) ending neutral position.
run. During the functional run, participants were in-structed to attentively listen to and/or watch speech stimuli related to /pa/, /ta/, and /ka/ syllables presented in five different modalities (A, VF, VT, AVF, and AVT). All
stimuli were presented in silent interscanning periods because of sparse sampling acquisition, with the time interval between each stimulus onset and the midpoint of the following functional scan acquisition being set at 5 sec (see below). There were 144 trials, with an 8-sec intertrial interval, consisting of 24 trials for each modality of presentation (with each syllable presented two times) and 24 trials related to a resting condition without any sensory stimulation.
Data Acquisition
Magnetic resonance images were acquired with a 3-T whole-body MR scanner (Philips Achieva TX). Partici-pants lay in the scanner with head movements minimized with a standard birdcage 32-channel head coil and foam cushions. Visual stimuli were presented using the Presen-tation software (Neurobehavioral Systems, Albany, CA) and displayed on a screen situated behind the scanner via a mirror placed above the participant’s eyes. Auditory stimuli were presented through the MR-confon audio system (www.mr-confon.de).
A high-resolution T1-weighted whole-brain structural image was acquired for each participant before the func-tional run (magnetization prepared rapid gradient echo, sagittal volume of 256 × 224 × 176 mm3with a 1-mm isotropic resolution, inversion time = 900 msec, two seg-ments, segment repetition time = 2500 msec, segment duration = 1795 msec, repetition time [TR]/echo time = 16/5 msec with 35% partial echo, flip angle = 30°).
Functional images were obtained in a subsequent functional run using a T2*-weighted EPI sequence with whole-brain coverage (TR = 8 sec, acquisition time = 3000 msec, echo time = 30 msec, flip angle = 90°). Each functional scan was composed of 53 axial slices parallel to the AC–PC plane acquired in noninterleaved order (72 × 72 matrix, field of view = 216 mm, 3 × 3 mm2in-plane resolution with a slice thickness of 3 mm without gap). To reduce acoustic noise, a sparse sam-pling acquisition was used (Birn, Bandettini, Cox, & Shaker, 1999; Hall et al., 1999). This acquisition tech-nique is based on neurophysiological properties of the slowly rising hemodynamic response, which is esti-mated to occur with a 4- to 6-sec delay in case of speech perception (Grabski et al., 2013; Zaehle et al., 2007). In this study, functional scanning therefore occurred only during a fraction of the TR, alternating with silent inter-scanning periods, where stimuli were presented. All conditions were presented in a pseudorandom se-quence. In addition, three“dummy” scans at the begin-ning of the functional run were added to allow for equilibration of the MRI signal and were removed from the analyses.
Data Analyses Behavioral Analysis
For each participant and modality, the percentage of cor-rect responses and median RTs (from the onset of the acoustic syllables) were computed. For each dependent variable, a repeated-measures ANOVA was performed with the modality (A, VF, VT, AVF, and AVT) as the
within-participant variable. For both analyses, the signifi-cance level was set atp = .05 and Greenhouse–Geisser corrected (for violation of the sphericity assumption) when appropriate. When required, post hoc analyses were conducted with Newman–Keuls tests.
fMRI Analysis
fMRI data were analyzed using the SPM8 software pack-age ( Wellcome Department of Imaging Neuroscience, Institute of Neurology, London, United Kingdom) run-ning on MATLAB (The MathWorks, Natick, MA). Brain-activated regions were labeled using the SPM Anatomy toolbox (Eickhoff et al., 2005) and, if a brain region was not assigned or not specified in the SPM Anatomy toolbox, using the Talairach Daemon software (Lancaster et al., 2000). For visualization, activation maps were super-imposed on a standard brain template using the MRICRON software (www.sph.sc.edu/comd/rorden/mricron/ ).
Data preprocessing steps for each participant included rigid realignment of functional images, coregistration of the structural image to the mean functional image, seg-mentation and normalization of the structural image to common subject space using the groupwise DARTEL reg-istration method implemented in SPM8, warping of all realigned functional images using deformation flow fields generated from the normalization step, transformation into the Montreal Neurological Institute (MNI) space, and spatial smoothing using an 8-mm FWHM Gaussian kernel.
For individual analyses, neural activations related to the perceptual conditions were analyzed using a general linear model, including five regressors of interest (A, VF,
VT, AVF, and AVT) and the six realignment parameters,
with the silent trials forming an implicit baseline. The BOLD response for each event was modeled using a single-bin finite impulse response basis function span-ning the time of acquisition (3 sec). Before estimation, a high-pass filtering with a cutoff period of 128 sec was applied. Beta weights associated with the modeled finite impulse responses were then computed to fit the ob-served BOLD signal time course in each voxel for each condition. Individual statistical maps were calculated for each perceptual condition with the related baseline and subsequently used for group statistics.
To draw population-based inferences, a second-level random effects group analysis was carried out with the modality (A, VF, VT, AVF, and AVT) as the within-participant
First, for each modality, brain activity compared with the resting baseline was evaluated. Second, to determine common neural activity across modalities, several con-junction analyses were performed (i.e., VF∩ VT, AVF∩
AVT, A∩ VF∩ AVF, A∩ VT∩ AVT, A∩ VF∩ VT∩ AVF∩
AVT). Third, activity differences between visual
condi-tions and between audiovisual condicondi-tions were eval-uated (i.e., VF> VT, VT > VF, AVF> AVT, AVT > AVF).
Fourth, to determine possible correlations between perceptual responses observed in the behavioral exper-iment and BOLD responses, covariate analyses were performed on the whole brain between neural activity in visual and audiovisual modalities (i.e., VF, AVF, VT,
AVT) and visual identification scores as well as RTs
related to visuo-lingual and visuo-facial speech move-ments (VF, VT). In addition, brain regions showing higher
or lower audiovisual responses compared with unimodal auditory and visual responses were identified using the max criterion test (i.e., [AVF> A]∩ [AVF> VF], [AVF<
A]∩ [AVF< VF], [AVT> A] ∩ [AVT> VT], [AVT< A]∩
[AVT < VT]; see Stevenson et al., 2014). Modality,
conjunction, and correlation contrasts were calculated with the significance level set at p < .05, family-wise error (FWE) corrected at the voxel level with a cluster
extent of at least 20 voxels. All other contrasts were calculated with a significance level set atp < .001 un-corrected at the voxel level with a cluster extent of at least 20 voxels.
RESULTS
Behavioral Results
Overall, the mean proportion of correct responses was 82%. The main effect of modality was significant (F(4, 52) = 37.79,p < .001), with more correct responses in the A, AVF, and AVTconditions than in the VFcondition
and in VFcompared with VTconditions (on average, A =
98%, AVF = 98%, AVT = 95%, VF= 70%, VT = 49%; all
mentioned comparisons significant). The ANOVA on RTs demonstrated a significant effect of the modality (F(4, 52) = 36.25, p < .001), with faster RTs in AVFthan
in VF, A, AVT, and VTconditions and slower RTs in VTthan
in the other conditions (on average, AVF= 722 msec, VF=
774 msec, A = 812 msec, AVT= 913 msec, VT= 1241 msec;
all mentioned comparisons significant).
Importantly, despite slower RTs and lower recognition scores for visuo-lingual stimuli compared with visuo-facial
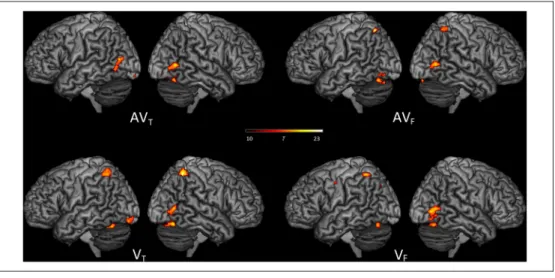
Figure 2. Surface rendering of brain regions activated in the auditory (A), visuo-facial ( VF), visuo-lingual ( VT), audio-visuo-facial (AVF), and audio-visuo-lingual (AVT) conditions and showing overlapping activity between lip-related conditions (conjunction A∩ VF∩ AVF), tongue-related conditions (conjunction A∩ VT∩ AVT), visual conditions (conjunction VF∩ VT), and audiovisual conditions (conjunction AVF∩ AVT) and between all modalities (conjunction A∩ VF∩ VT∩ AVF∩ AVT;p < .05, FWE corrected; cluster extent threshold of 20 voxels).
stimuli (and to the other conditions), recognition scores for visuo-lingual stimuli remained above chance level (i.e., 49% vs. 33%). Interestingly, at the syllable level, individual differences were observed between facial and tongue visual recognition ( VF: /pa/ 100%, /ta/ 64%,
/ka/ 45%; VT: /pa/ 50%, /ta/ 50%, /ka/ 46%; no statistical
analyses were performed because of the small number of trials for each syllable). These differences suggest dif-ferent categorization processes because of the nature of the stimuli.
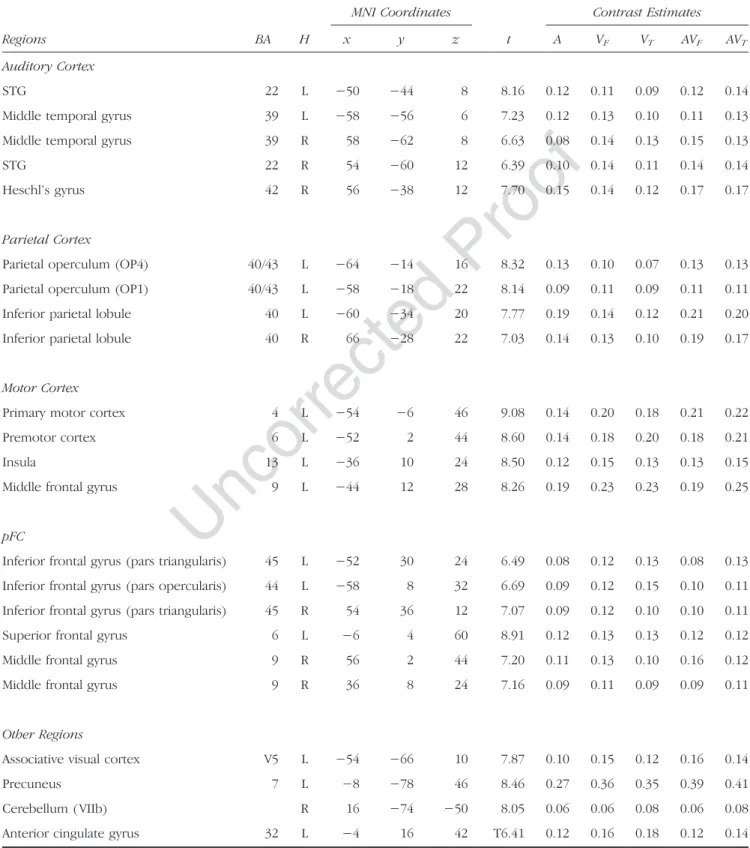
Table 1. Maximum Activation Peak Summary and Contrast Estimates of Brain Regions Showing Overlapping Activity between All Conditions (Conjunction A∩ VF ∩ VT∩ AVF∩ AVT;p < .05, FWE Corrected, Cluster Extent Threshold of 20 Voxels)
Regions BA H MNI Coordinates t Contrast Estimates x y z A VF VT AVF AVT Auditory Cortex STG 22 L −50 −44 8 8.16 0.12 0.11 0.09 0.12 0.14
Middle temporal gyrus 39 L −58 −56 6 7.23 0.12 0.13 0.10 0.11 0.13 Middle temporal gyrus 39 R 58 −62 8 6.63 0.08 0.14 0.13 0.15 0.13
STG 22 R 54 −60 12 6.39 0.10 0.14 0.11 0.14 0.14
Heschl’s gyrus 42 R 56 −38 12 7.70 0.15 0.14 0.12 0.17 0.17
Parietal Cortex
Parietal operculum (OP4) 40/43 L −64 −14 16 8.32 0.13 0.10 0.07 0.13 0.13 Parietal operculum (OP1) 40/43 L −58 −18 22 8.14 0.09 0.11 0.09 0.11 0.11 Inferior parietal lobule 40 L −60 −34 20 7.77 0.19 0.14 0.12 0.21 0.20 Inferior parietal lobule 40 R 66 −28 22 7.03 0.14 0.13 0.10 0.19 0.17
Motor Cortex
Primary motor cortex 4 L −54 −6 46 9.08 0.14 0.20 0.18 0.21 0.22 Premotor cortex 6 L −52 2 44 8.60 0.14 0.18 0.20 0.18 0.21
Insula 13 L −36 10 24 8.50 0.12 0.15 0.13 0.13 0.15
Middle frontal gyrus 9 L −44 12 28 8.26 0.19 0.23 0.23 0.19 0.25
pFC
Inferior frontal gyrus (pars triangularis) 45 L −52 30 24 6.49 0.08 0.12 0.13 0.08 0.13 Inferior frontal gyrus (pars opercularis) 44 L −58 8 32 6.69 0.09 0.12 0.15 0.10 0.11 Inferior frontal gyrus (pars triangularis) 45 R 54 36 12 7.07 0.09 0.12 0.10 0.10 0.11 Superior frontal gyrus 6 L −6 4 60 8.91 0.12 0.13 0.13 0.12 0.12 Middle frontal gyrus 9 R 56 2 44 7.20 0.11 0.13 0.10 0.16 0.12 Middle frontal gyrus 9 R 36 8 24 7.16 0.09 0.11 0.09 0.09 0.11
Other Regions
Associative visual cortex V5 L −54 −66 10 7.87 0.10 0.15 0.12 0.16 0.14
Precuneus 7 L −8 −78 46 8.46 0.27 0.36 0.35 0.39 0.41
Cerebellum ( VIIb) R 16 −74 −50 8.05 0.06 0.06 0.08 0.06 0.08 Anterior cingulate gyrus 32 L −4 16 42 T6.41 0.12 0.16 0.18 0.12 0.14
fMRI Results: Modality and Conjunction Analyses Brain activity compared with the resting baseline in each modality (A, VF, VT, AVF, and AVT) as well as conjunction
analyses (i.e., VF∩ VT, AVF∩ AVT, A∩ VF∩ AVF, A∩ VT∩
AVT, A∩ VF∩ VT∩ AVF∩ AVT) are displayed in Figure 2.
Globally, bilateral activity of auditory regions (including primary, secondary, and associative areas in the STG and extending to the middle temporal gyrus) as well as strong premotor activations (extending to the inferior frontal gyrus and left primary motor cortex) were observed in A condition (see Figure 2, Condition A). In both VFand VT
conditions, visual (bilateral primary and associative re-gions, including V5), auditory (pSTS and pSTG), and motor (bilateral primary motor and premotor cortices as well as inferior frontal gyri) activities were observed (see Figure 2, Conditions VF and VT as well as conjunction VT ∩ VF).
Activities in AVFand AVTconditions were mainly found in
primary and associative auditory and visual regions and in motor and frontal cortices (see Figure 2, Conditions AVF and AVT as well as conjunction AVF∩ AVT).
Importantly, common activations in all five conditions (see Table 1 and Figure 2, conjunction A∩ VF∩ VT∩ AVF∩
AVT) were observed in the pSTS, bilaterally extending
to the adjacent posterior middle temporal gyrus and left V5. Additional auditory activity was also observed bilat-erally in the posterior temporal gyrus, extending to the right secondary auditory cortex, the parietal operculum, and the antero-ventral part of the inferior parietal lobule. Interestingly, strong premotor activity was also observed, mainly in the left hemisphere, and also including activity in the opercular part of the left inferior frontal gyrus, the triangular part of the inferior frontal gyrus, the left anterior IC, and the left primary motor cortex. Finally, additional activity was also observed in the ACC, the left precuneus, and the right cerebellum (Lobule VII).
In summary, apart from sensory-specific activity in audi-tory and visual conditions, our results demonstrate a shared neural network involved in all conditions, mainly including multisensory activity around the pSTS and the pSTG
ex-tending to adjacent inferior parietal regions as well as the premotor cortex extending to inferior frontal regions.
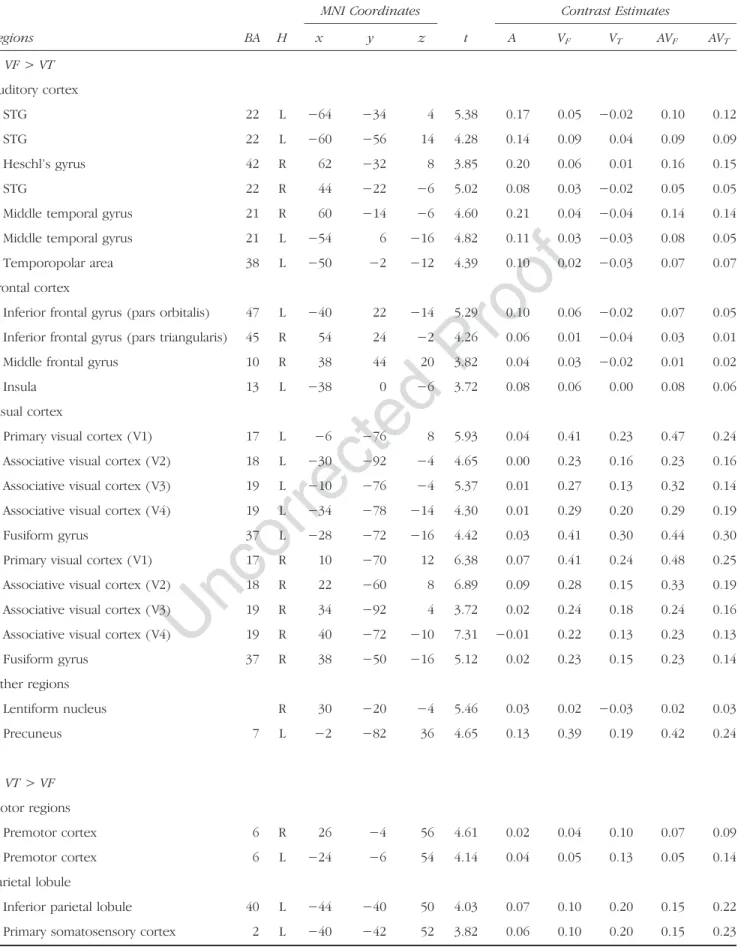
fMRI Results: Modality Differences VF> VT
Several auditory regions were more activated during visuo-facial than during visuo-lingual perception, with stronger bilateral activation of the posterior temporal gyrus/sulcus, extending to the middle temporal gyrus. Stronger activation of the left anterior temporal gyrus (temporopolar area) and the right primary auditory cortex was also observed. Large parts of the primary and associative visual areas were also more activated ( V1, V2, V3, and V4), extending to the fusiform gyrus. In addition, stronger frontal activity was observed in the right pars triangularis and middle frontal gyrus, the left pars orbitalis, and the left anterior IC. Finally, stronger ad-ditional activity was also observed in the right BG in the lentiform nucleus and the left precuneus (see Figure 3 and Table 2).
VT> VF
Bilateral premotor dorsal regions were more activated dur-ing visuo-ldur-ingual perception than durdur-ing visuo-facial percep-tion. Interestingly, stronger activity was observed in the primary somatosensory cortices, extending to the adjacent parts of the dorsal inferior parietal lobule and intraparietal sulcus. Stronger bilateral visual activity was also observed, including primary and associative visual areas ( V1 and V2). Finally, stronger additional activity was also observed in the right precuneus, the posterior cingulate cortex, and the middle part of the right parahippocampal gyrus.
AVF> AVT
Audio-visuo-facial stimuli, compared with audio-visuo-lingual stimuli, induced stronger bilateral activation of the
Figure 3. Surface rendering of brain regions activated showing significant change in activity between visual conditions related to lip and tongue movements ( VF> VTand VT> VF) and audiovisual conditions related to lip and tongue movements (AVF> AVTand AVT> AVF; p < .001 uncorrected; cluster extend threshold of 20 voxels).
Table 2. Maximum Activation Peaks and Contrast Estimates of Brain Regions Showing Significant Change in Activity between Visuo-Facial and Visuo-Lingual Conditions (A: VF> VT; B: VT> VF;p < .001 Uncorrected, Cluster Extend Threshold of 20 Voxels) and between Audio-Visuo-Facial and Audio-Visuo-Lingual Conditions (C: AVF> AVT; D: AVT> AVF;p < .001 Uncorrected, Cluster Extend Threshold of 20 Voxels) Regions BA H MNI Coordinates t Contrast Estimates x y z A VF VT AVF AVT A. VF > VT Auditory cortex STG 22 L −64 −34 4 5.38 0.17 0.05 −0.02 0.10 0.12 STG 22 L −60 −56 14 4.28 0.14 0.09 0.04 0.09 0.09 Heschl’s gyrus 42 R 62 −32 8 3.85 0.20 0.06 0.01 0.16 0.15 STG 22 R 44 −22 −6 5.02 0.08 0.03 −0.02 0.05 0.05
Middle temporal gyrus 21 R 60 −14 −6 4.60 0.21 0.04 −0.04 0.14 0.14 Middle temporal gyrus 21 L −54 6 −16 4.82 0.11 0.03 −0.03 0.08 0.05 Temporopolar area 38 L −50 −2 −12 4.39 0.10 0.02 −0.03 0.07 0.07 Frontal cortex
Inferior frontal gyrus (pars orbitalis) 47 L −40 22 −14 5.29 0.10 0.06 −0.02 0.07 0.05 Inferior frontal gyrus (pars triangularis) 45 R 54 24 −2 4.26 0.06 0.01 −0.04 0.03 0.01 Middle frontal gyrus 10 R 38 44 20 3.82 0.04 0.03 −0.02 0.01 0.02
Insula 13 L −38 0 −6 3.72 0.08 0.06 0.00 0.08 0.06
Visual cortex
Primary visual cortex ( V1) 17 L −6 −76 8 5.93 0.04 0.41 0.23 0.47 0.24 Associative visual cortex ( V2) 18 L −30 −92 −4 4.65 0.00 0.23 0.16 0.23 0.16 Associative visual cortex ( V3) 19 L −10 −76 −4 5.37 0.01 0.27 0.13 0.32 0.14 Associative visual cortex ( V4) 19 L −34 −78 −14 4.30 0.01 0.29 0.20 0.29 0.19 Fusiform gyrus 37 L −28 −72 −16 4.42 0.03 0.41 0.30 0.44 0.30 Primary visual cortex ( V1) 17 R 10 −70 12 6.38 0.07 0.41 0.24 0.48 0.25 Associative visual cortex ( V2) 18 R 22 −60 8 6.89 0.09 0.28 0.15 0.33 0.19 Associative visual cortex ( V3) 19 R 34 −92 4 3.72 0.02 0.24 0.18 0.24 0.16 Associative visual cortex ( V4) 19 R 40 −72 −10 7.31 −0.01 0.22 0.13 0.23 0.13 Fusiform gyrus 37 R 38 −50 −16 5.12 0.02 0.23 0.15 0.23 0.14 Other regions Lentiform nucleus R 30 −20 −4 5.46 0.03 0.02 −0.03 0.02 0.03 Precuneus 7 L −2 −82 36 4.65 0.13 0.39 0.19 0.42 0.24 B. VT > VF Motor regions Premotor cortex 6 R 26 −4 56 4.61 0.02 0.04 0.10 0.07 0.09 Premotor cortex 6 L −24 −6 54 4.14 0.04 0.05 0.13 0.05 0.14 Parietal lobule
Inferior parietal lobule 40 L −44 −40 50 4.03 0.07 0.10 0.20 0.15 0.22 Primary somatosensory cortex 2 L −40 −42 52 3.82 0.06 0.10 0.20 0.15 0.23
Table 2. (continued ) Regions BA H MNI Coordinates t Contrast Estimates x y z A VF VT AVF AVT Intraparietal sulcus R 30 −40 40 4.32 0.01 0.04 0.10 0.06 0.07 Primary somatosensory cortex 2 R 34 −42 50 3.65 0.02 0.11 0.19 0.15 0.18 Primary somatosensory cortex 3 R 32 −32 42 3.54 0.01 0.05 0.09 0.07 0.08 Superior parietal lobule 7 R 24 −68 58 5.20 0.08 0.09 0.23 0.17 0.23 Visual regions
Primary visual cortex ( V1) 17 L 0 −94 0 5.30 0.03 0.42 0.59 0.47 0.59 Associative visual cortex ( V2) 18 L −4 −98 10 4.89 −0.01 0.22 0.31 0.25 0.30 Primary visual cortex ( V1) 17 R 14 −94 4 5.86 0.03 0.36 0.49 0.38 0.47 Associative visual cortex ( V2) 18 R 8 −86 −10 4.61 0.04 0.31 0.40 0.34 0.39 Other regions
Posterior cingulate cortex 31 L −16 −60 22 5.05 0.04 0.02 0.11 0.04 0.06 Posterior cingulate cortex 31 R 18 −58 22 3.80 0.02 0.03 0.12 0.05 0.06 Parahippocampal gyrus 36 R 26 −38 −16 4.33 −0.03 0.00 0.09 0.05 0.04
C. AVF > AVT Visual cortex
Associative visual cortex ( V2) 18 L −2 −74 10 6.76 0.05 0.41 0.24 0.46 0.24 Primary visual cortex ( V1) 17 L −8 −76 10 6.65 0.05 0.38 0.22 0.43 0.22 Associative visual cortex ( V3) 19 L −12 −88 34 4.13 0.07 0.32 0.24 0.35 0.25 Superior parietal lobule (cuneus) 7 L −2 −84 36 3.82 0.12 0.38 0.21 0.41 0.24 Primary visual cortex ( V1) 17 R 10 −72 12 7.89 0.06 0.41 0.25 0.49 0.25 Associative visual cortex ( V2) 18 R 20 −62 8 7.07 0.09 0.28 0.16 0.34 0.19 Associative visual cortex ( V4) 19 R 40 −72 −10 6.54 −0.01 0.22 0.13 0.23 0.13 Other regions
Amygdala L −18 −6 −14 4.26 0.08 0.10 0.05 0.10 0.02
Amygdala R 22 −4 −14 3.90 0.06 0.05 0.02 0.09 0.02
Posterior cingulate cortex 31 R 16 −34 42 3.73 0.00 0.00 −0.01 0.04 −0.03 Frontopolar area (Fp2) 10 R 4 54 −10 3.95 0.05 −0.03 −0.07 0.03 −0.07 Temporopolar area 38 R 32 4 −20 4.23 0.13 0.05 0.03 0.14 0.05
D. AVT > AVF Parietal cortex
Inferior parietal lobule 40 L −44 −62 54 3.91 0.02 −0.02 −0.01 −0.04 0.04 pFC
Premotor cortex 6 L −42 0 36 3.71 0.10 0.17 0.18 0.10 0.19 Middle frontal gyrus 9 L −38 2 36 3.78 0.11 0.15 0.17 0.10 0.18 Middle frontal gyrus 8 L −52 16 42 3.63 0.11 0.03 0.02 0.01 0.10 Dorsolateral pFC 46 L −46 26 24 4.25 0.07 0.10 0.11 0.05 0.12
primary and associative visual areas (V1, V2, V3, and V4). Stronger activity was also observed in the amygdala and the right posterior cingulate gyrus as well as in the right temporopolar and frontopolar areas.
AVT> AVF
Audio-visuo-lingual stimuli, compared with audio-visuo-facial stimuli, induced stronger activation of the left pre-motor cortex, extending to the adjacent middle and inferior frontal gyri, and the left dorsal inferior parietal lobule, extending to the intraparietal sulcus. Stronger additional activity was also observed in the left dorso-lateral pFC, the left primary visual cortex, the right cere-bellum (Lobule VII), and the left ACC.
To summarize, seeing tongue-related stimuli globally induced stronger motor and somatosensory activity, whereas auditory and visual cortices were globally more activated during lip-related stimuli presentation.
fMRI Results: Correlation between Visual Recognition Scores and Neural Activity
For tongue-related stimuli, the covariance analysis be-tween visual recognition scores in the behavioral
ex-periment and BOLD activity observed in VT and AVT
conditions in the fMRI experiment demonstrated a sig-nificant correlation in the left dorsal part of the premotor cortex (see Figure 4 and Table 3).
For lip-related stimuli, a significant correlation was observed between visual recognition scores and neural responses in the VFcondition in the right primary,
sec-ondary, and associative (MT/ V5) visual regions and in the right fusiform gyrus. Similarly, a significant correla-tion in the AVFcondition was observed in the bilateral
associative visual cortex, in the left fusiform gyrus, in the lingual gyrus, in the left cerebellum, and in the para-hippocampal gyrus.
To summarize, a correlation between visual recogni-tion scores and neural activity was observed in the left premotor cortex for tongue-related stimuli and in visual regions for lip-related stimuli.
fMRI Results: Correlation between Visual RTs and Neural Activity
For both lip- and tongue-related stimuli, the covariance analysis between RTs observed for unimodal visual stim-uli in the behavioral experiment and BOLD activity ob-served in visual and audiovisual conditions in the fMRI
Table 2. (continued ) Regions BA H MNI Coordinates t Contrast Estimates x y z A VF VT AVF AVT Dorsolateral pFC 10 L −36 50 −4 4.39 0.05 0.02 0.04 −0.01 0.05 Dorsolateral pFC 11 L −36 46 −6 4.30 0.04 0.01 0.02 −0.01 0.04 Other regions
Primary visual cortex ( V1) 17 L −8 −100 2 4.25 0.02 0.26 0.33 0.24 0.33 Cerebellum ( VIIb) R 20 −76 −48 4.35 0.05 0.06 0.08 0.03 0.09
ACC 32 L −22 42 4 3.69 0.00 −0.02 −0.01 −0.02 0.01
Figure 4. Surface rendering of brain regions activated showing correlation between visual recognition scores and neural activity in the audio-visuo-facial (AVF), audio-visuo-lingual (AVT), facial ( VF), and visuo-lingual ( VT) conditions (p < .05, FWE corrected; cluster extent threshold of 20 voxels).
experiment demonstrated a significant correlation in vi-sual regions (including the primary and associative vivi-sual brain areas and the fusiform gyrus). Other correlational activity was found in the superior parietal lobule and adjacent intraparietal sulcus for VT, VF, and AVF
condi-tions as well as in the left premotor cortex for VF (see
Figure 5 and Table 4).
To summarize, a correlation between RTs and neural activity was mainly observed in visual and superior parie-tal regions for both tongue- and lip-related stimuli.
fMRI Results: Different Audiovisual Neural Responses Compared with Auditory and Visual Modalities
Higher neural responses were only found for audio-visuo-facial stimuli (see Figure 6, condition [AVF> A]∩
[AVF> V]) around the bilateral secondary visual areas, the
right cerebellum, and the parahippocampal gyrus and in the left granular retrosplenial cortex (see Figure 6 and Table 5).
DISCUSSION
Four main results emerged from this fMRI study. First, the neural networks involved in lingual and visuo-facial perception strongly overlap and share similar sen-sorimotor brain areas. This suggests comparable visual processing of lingual and labial movements, both crucial for the realization of speech sounds. Second, further analyses demonstrate stronger motor and somatosensory activations during visuo-lingual perception and stronger activation of auditory and visual cortices during visuo-facial perception. This result suggests more important somatosensory–motor internal simulation of the pre-sented syllables for visuo-lingual speech stimuli that in daily life are clearly audible but not visible, whereas visible and audible visuo-facial speech stimuli seem to strongly rely on well-known sensory representations. Third, behavioral results confirm that both visuo-lingual and visuo-facial speech stimuli were correctly recognized, although to a lower extent and slower for visuo-lingual stimuli. Complementing these findings, activity in the left premotor cortex and in visual brain areas was found to correlate with visual recognition scores observed for visuo-lingual and visuo-facial speech stimuli, respectively, whereas visual activity correlated with RTs for both stim-uli. Altogether, these results suggest that visual process-ing of audible but not visible movements induce motor and visual mental simulation of the perceived speech actions to facilitate recognition and/or learn the asso-ciation between auditory and visual signals.
Syllable Recognition
The recognition scores replicated a number of well-known effects in auditory, visual, and audiovisual speech perception. As expected, perceptual recognition scores show a ceiling effect for auditory and audiovisual modal-ities. Also consistent with previous studies on unimodal and multimodal speech perception, visual-only syllables
Table 3. Maximum Activation Peaks Showing Correlation between Visual Recognition Scores and Neural Activity in the (A) Visuo-Lingual (VT), (B) Audio-Visuo-Lingual (AVT), (C) Visuo-Facial (VF), and (D) Audio-Visuo-Facial Conditions (AVF;p < .05, FWE Corrected, Cluster Extent Threshold of 20 Voxels)
Regions BA H MNI Coordinates t x y z A. VT Premotor cortex 6 L −34 −4 54 16.65 B. AVT Premotor cortex 6 L −34 0 54 16.34 C. VF Visual cortex Associative visual cortex (MT/ V5) 19 R 44 −64 0 11.21 Primary visual cortex ( V1) 17 R 22 −60 2 12.21 Associative visual cortex ( V2) 18 R 22 −90 20 12.75 Fusiform gyrus 37 R 52 −68 −2 11.82 D. AVF Visual cortex Fusiform gyrus 37 L −36 −50 −22 19.54 Associative visual cortex ( V3) 19 L −34 −76 −12 17.19 Associative visual cortex ( V2) 18 R 22 −92 14 14.57 Associative visual cortex ( V2) 18 L −8 −88 22 14.96 Associative visual cortex ( V3) 19 R 22 −66 −10 12.03 Lingual gyrus 18 R 8 −74 −8 13.14 Other regions Culmen L −14 −48 −6 18.82 Declive L −30 −58 −16 13.54 Parahippocampal gyrus 19 L −20 −56 −10 13.93
were less well recognized, especially in the case of tongue movements. In addition, in line with previous studies (Katz & Mehta, 2015; d’Ausilio et al., 2014; Badin et al., 2010), despite lower recognition scores compared with visuo-facial stimuli (and to the other conditions), the recognition of visuo-lingual stimuli remained above chance level.
Regarding RTs, faster recognition was observed when visual information was added to the auditory signal, a result suggesting a temporal advantage of vision on the auditory signal during individual syllable recognition. This effect only happened for familiar visuo-facial speech movements but not for visuo-lingual movements. Con-trary to this result, d’Ausilio et al. (2014) found faster RTs for audio-visuo-lingual stimuli when comparing the perception of congruent audio-visuo-lingual syllables with an auditory-only condition with visual noise. The difference between the two studies likely comes from experimental parameters. First, d’Ausilio and colleagues improved the visual recognition of the tongue shape by adding a red line on the tongue surface. In addition, they used more trials, possibly leading to a stronger learning effect for visual tongue movements. Finally, our RTs were calculated from the acoustic onset of the presented con-sonant, not from the onset of the visual movement, with a clear difference of visual anticipation between labial (strong) and lingual (low) movements. Surprisingly, in our study, audio-visuo-lingual syllables were identified even slower than auditory-only stimuli. This suggests that the sight of tongue movements disrupted and slowed down the final decision processes, even when adding the corresponding auditory signal.
Visuo-lingual and Visuo-facial Speech Stimuli Share a Common Sensorimotor Network
The fMRI results first demonstrate for visuo-facial and visuo-lingual stimuli common overlapping activity be-tween auditory, visual, and audiovisual modalities in the
pSTS, extending to the adjacent posterior middle tempo-ral gyrus and left V5. These results appear in line with previous studies indicating a key role of this region in speech processing, biological motion perception (in-cluding face perception), and audiovisual integration (e.g., Beauchamp, 2005; Beauchamp, Argall, et al., 2004; Beauchamp, Lee, et al., 2004; Calvert et al., 1997, 2000). Additional auditory activity was also observed bilaterally in the posterior temporal gyrus, extending to the right secondary auditory cortex, the parietal oper-culum, and the antero-ventral part of the inferior parietal lobule.
In addition, strong premotor activity was also ob-served, mainly in the left hemisphere, and also including activity in the opercular part of the left inferior frontal gyrus, the triangular part of the inferior frontal gyrus, the left anterior IC, and the left primary motor cortex. These motor and premotor activations are in accordance with previous studies on auditory, visual, and audiovisual speech perception showing a key role of motor regions in speech processing (e.g., Grabski et al., 2013; d’Ausilio et al., 2009, 2011; Sato et al., 2009, 2010; Möttönen & Watkins, 2009; Meister et al., 2007; Skipper et al., 2005, 2007; Pekkola et al., 2006; Pulvermuller et al., 2006; Wilson & Iacoboni, 2006; Ojanen et al., 2005; Callan et al., 2003, 2004; Watkins & Paus, 2004; Wilson et al., 2004; Calvert & Campbell, 2003; Jones & Callan, 2003; Watkins et al., 2003; Campbell et al., 2001; Calvert et al., 2000). It is worthwhile noting that, in this study, par-ticipants were only asked to attentively listen to and/or watch speech stimuli. Given the strong motor activity observed in all modalities, it appears quite likely that participants were therefore engaged to some extent in conscious subvocal sensorimotor simulation or covert rehearsal of the presented syllables. This strategy might have occurred especially because of the difficulty to decode visuo-lingual ultrasound images. However, it cannot be concluded whether this subvocal rehearsal strategy was related to some phonetic decision/recognition
Figure 5. Surface rendering of brain regions activated showing correlation between visual RTs and neural activity in the facial (AVF), audio-visuo-lingual (AVT), visuo-facial ( VF), and visuo-lingual ( VT) conditions (p < .05, FWE corrected; cluster extent threshold of 20 voxels).
processes or, rather, to an associative learning strategy be-tween the auditory and visual signals. Indeed, the poor temporal resolution of fMRI obviously collapsed the dif-ferent timings of neural activation corresponding to the “genuine” response in the perceptual/recognition process and the“fake” response caused by such possible mental motor rehearsal, making it difficult to conclude which com-ponents are observed.
Neural Specificity of Visuo-lingual and Visuo-facial Processing
Using a less conservative statistical threshold, a direct comparison of audiovisual and visual conditions related
Table 4. Maximum Activation Peaks Showing Correlation between Visual RT and Neural Activity in the (A) Visuo-Lingual (VT), (B) Audio-Visuo-Lingual (AVT), (C) Visuo-Facial ( VF), and (D) Audio-Visuo-Facial Conditions (AVF;p < .05, FWE Corrected, Cluster Extent Threshold of 20 Voxels) Regions BA H MNI Coordinates t x y z A. VT Visual cortex Fusiform gyrus 37 R 32 −66 −20 17.40 Associative visual cortex ( V3) 19 R 50 −64 4 15.08 Associative visual cortex ( V3) 19 L −26 −88 −14 14.16 Fusiform gyrus 37 R 58 −64 4 15.27 Parietal lobule Intraparietal sulcus 7/40 L −30 −56 54 19.58 Intraparietal sulcus 7/40 R 32 −52 56 22.61 Superior parietal lobule 7 L −30 −52 52 17.42 Other regions Cerebellum Lobule VI R 22 −76 −20 13.00 Cerebellum Lobule VI L −28 −58 −22 16.90 B. AVT Visual cortex Associative visual cortex ( V3) 19 R 48 −64 2 16.75 Associative visual cortex ( V3) 19 L −12 −94 −14 13.13 Associative visual cortex ( V2) 18 R 10 −88 −12 12.54 Primary visual cortex ( V1) 17 R 6 −88 −10 12.26 Fusiform gyrus 37 R 48 −72 −2 13.08 Middle temporal gyrus 39 L −38 −72 12 16.63 Fusiform gyrus 37 L −42 −66 −4 12.55 C. VF Visual cortex Associative visual cortex ( V2) 18 R 38 −60 −6 17.84 Fusiform gyrus 37 R 50 −72 0 16.79 Table 4. (continued ) Regions BA H MNI Coordinates t x y z Parietal lobule Superior parietal lobule 7 L −34 −52 56 17.12 Motor region Premotor cortex 6 L −38 −4 44 12.46 Other region
Cerebellum Lobule VIIa L −30 −70 −22 14.40
D. AVF Visual cortex Associative visual cortex ( V3) 19 L −34 −70 −10 13.70 Associative visual cortex ( V3) 19 R 52 −66 6 18.53 Associative visual cortex ( V2) 18 R 10 −84 −16 20.70 Primary visual cortex ( V1) 17 R 6 −58 4 13.55 Parietal lobule Superior parietal lobule 7 L −24 −64 56 22.77 Superior parietal lobule 7 R 32 −56 58 14.82 Other regions Cerebellum Lobule VI R 4 −76 −12 11.40 Cerebellum Lobule VI L −34 −70 −20 14.86 Cerebellum Lobule VIIa R 22 −84 −20 11.04
to facial or lingual stimuli demonstrates stronger acti-vation of the premotor regions and the primary somato-sensory cortices during the observation of tongue movements. Because tongue movements are not usually visible and participants were not experienced with visuo-lingual ultrasound images, this result could be explained by a more important somatosensory–motor covert simulation of tongue movements and the use of both motor and proprioceptive knowledge, to better achieve a phonetic decoding of the presented visuo-lingual stimuli or to learn the association between the two signals. Apart from covert simulation, another explanation could be related to the unusual nature of the lingual stimuli that might imply increased difficulty and high-level categorization processes in the premotor cortex (Venezia, Saberi, Chubb, & Hickok, 2012; Sato et al., 2011).
These somatosensory–motor activations appear how-ever reduced for lip movements. This is likely due to the fact that visuo-facial speech stimuli are perceived in daily life, with their processing being more automatized and requiring less motor simulation. In contrast, in both visual and audiovisual conditions related to lip
move-ments, stronger visual activity was however observed, ex-tending to a large part of primary and associative visual areas. This result might come from low-level features (contrast, luminance, and motion energy), the facial na-ture as well as stronger visual experience for facial stim-uli. In line with previous studies, our results also showed stronger activity within the auditory cortex dur-ing lip readdur-ing condition than in the visuo-ldur-ingual con-dition. It was indeed demonstrated that syllables’ visual cues are sufficient to activate auditory cortical sites, nor-mally engaged during the perception of heard speech, in the absence of auditory speech sound (Campbell et al., 2001; Calvert et al., 1997). This result suggests a direct matching between the visible articulatory movements and auditory representation of the perceived syllables/phonemes. These stronger visual and auditory activations during facial perception could be the result of projections between auditory and visual regions— possibly mediated by the STS. Indeed, studies have demonstrated direct functional and anatomical pathway between primary sensory areas in nonhuman (Cappe & Barone, 2005) and human (Eckert et al., 2008; Watkins,
Figure 6. Axial views of brain regions showing higher neural responses (condition [AVF> A] ∩ [AVF> V]) in the audio-visuo-facial condition;p < .001 uncorrected, cluster extent threshold of 20 voxels).
Table 5. Maximum Activation Peaks and Contrast Estimates of Brain Regions Showing Higher Neural Responses in the Audio-Visuo-Facial Condition (p < .001 Uncorrected, Cluster Extent Threshold of 20 Voxels)
Regions BA H MNI Coordinates t Contrast Estimates x y z A VF VT AVF AVT Visual Cortex
Associative visual cortex ( V2) 18 R 8 −60 −2 4.12 0.06 0.14 0.11 0.27 0.10 Associative visual cortex ( V2) 18 L −10 −54 0 3.85 0.07 0.26 0.18 0.37 0.19
Cerebellum
Cerebellum (I) R 4 −44 −2 4.76 0.13 0.23 0.21 0.46 0.27
Other Regions
Parahippocampal gyrus 30 R 10 −52 4 4.58 0.08 0.20 0.17 0.32 0.16 Parahippocampal gyrus 30 L −16 −52 2 3.51 0.04 0.18 0.14 0.29 0.13 Granular retrosplenial cortex 29 L −14 −52 6 3.72 0.02 0.10 0.09 0.20 0.08
Shams, Tanaka, Haynes, & Rees, 2006) cerebral cortex. From that view, lower activation of the visual cortex during the sight of tongue movements could also be explained because such movements are not likely to directly excite the auditory cortex because of their unusual characteristics.
Correlation between Behavioral Performance and Neural Activity
Interestingly, activities in the left premotor cortex and in visual brain areas were found to correlate with visual recognition scores observed for lingual and visuo-facial speech stimuli, respectively. Hence, the more these areas were activated, the better were the visual recognition scores. These results appear consistent with those observed from the direct comparison between visuo-lingual and visuo-facial movements. As previously noted, given the poor temporal resolution of fMRI, it is however impossible to determine whether motor simu-lation is related to some recognition/decision processes or rather to some associative learning effect.
Another result is that activity in visual and superior parietal brain areas correlated with RTs for both visuo-facial and visuo-lingual stimuli. Given that these brain regions are known to play a role in visual imagery, this later finding might indicate the use of a visual imagery strategy by the participants to learn the association be-tween auditory and visual signals.
Integration between Auditory and Visual Signals As previously noted, fMRI studies have demonstrated the existence of specific multisensory brain areas involved in the integration process of auditory and visual signals. More specifically, when compared with auditory and visual unimodal modalities, the observation of audio-visual stimuli was found to induce supra-additive responses in pSTS/pSTG (Beauchamp, 2005; Beauchamp, Argall, et al., 2004; Beauchamp, Lee, et al., 2004; Calvert et al., 2000) as well as subadditive responses in Broca’s area (Calvert et al., 2000). Beauchamp (2005) determined two minimal criteria to select brain regions involved in audio-visual speech integration: The region must be activated during auditory, visual, and audiovisual modalities and must display supra-additive audiovisual response. In this study, higher neural responses using the max criterion test ([AV > A]∩ [AV > V]) were only found for audio-visuo-facial stimuli around the bilateral secondary visual areas, the right cerebellum, and the parahippocampal gyrus and in the left granular retrosplenial cortex. Although a pSTS/ pSTG activation was observed for all conditions, no higher response was found for this region supposed to be a specific brain area involved in the integration process. Although we do not have a clear explanation for this null result, one possibility is that the strong sensorimotor
activity observed in all modalities, including the pSTS/ pSTG, might have changed the classical audiovisual inte-gration network.
Concluding Remarks
Taken together, our results provide new evidence for an action–perception functional coupling in speech pro-cessing. According to a recent neurobiological and perceptuo-motor model of multisensory speech percep-tion by Skipper and colleagues (2007), apart from sensory processing, motor activity during speech perception might partly constrain phonetic interpretation of the sensory inputs through the internal generation of candi-date articulatory categorizations and, in return, auditory and somatosensory predictions. In this study, because of the lack of visual knowledge in the processing of the generally hidden tongue movements, a larger motor re-cruitment could have been necessary to infer appropriate motor speech representations to correctly decode the perceived syllables. This process would have been guided by the participant’s expertise in speech production, en-abling to transfer procedural motor knowledge into a better understanding of such unfamiliar visual stimuli. One alternative explanation is that motor activity does not directly reflect some phonetic decision processes but rather a learning effect between auditory and visual signals. Visual and motor familiarities have already been com-pared in the course of action recognition, and previous studies have shown that the involvement of the motor system during action observation strongly relies on motor learning (e.g., Calvo-Merino et al., 2005, 2006). In line with previous behavioral studies (Katz & Mehta, 2015; d’Ausilio et al., 2014; Badin et al., 2010), the present data demonstrate that, even if participants have no visual familiarity with one given human action, they are never-theless able to recognize this action because of their motor knowledge and past auditory and somatosensory experience. This is in line with the assumption of sensory– motor transfer mechanisms at hand in the visual percep-tion of audible but invisible tongue acpercep-tions. The situapercep-tion experienced by the participants of the present experiment is to a certain extent similar to the one experienced by newborns and 3-month-old infants, in the classical exper-iments on facial imitation by Meltzoff and Moore (1977, 1983). They have shown astonishing capacities to replicate to a certain extent a facial movement they have never seen done by a caregiver. These abilities are interpreted by the authors in reference to the link between proprio-ceptive and motor information feeding newborns with information about their own unseen movements in rela-tion with the visual representarela-tion of the perceived move-ment of the caregiver and enabling the required action matching. Despite the correlational approach used in this study, our results suggest that, even if we have no visual but auditory and somatosensory experiences of an action, the connection between our motor abilities and the visual
incoming signal exists and enables adequate processing and performance.
UNCITED REFERENCES
Grabski, Schwartz, et al., 2013
Grabski, Tremblay, Gracco, Girin, & Sato, 2013
Acknowledgments
This study was supported by research grants from CNRS (Centre National de la Recherche Scientifique), from Agence Nationale de la Recherche (ANR SPIM,“Imitation in Speech: From Sensorimotor Integration to the Dynamics of Conversa-tional Interaction”), and from the European Research Council (FP7/2007-2013 Grant agreement no. 339152,“Speech Unit(e)s”). Any opinions, findings, and conclusions or recommendations expressed in this material are those of the authors and do not necessarily reflect the views of the funding agencies. We thank Jean-Luc Schwartz for helpful discussions.
Reprint requests should be sent to Avril Treille, GIPSA-lab, UMR 5216, Université Stendhal, 1180, Avenue Centrale, BP25, 38031 Grenoble Cedex 9, France, or via e-mail: avril.treille@gipsa-lab. grenoble-inp.fr.
REFERENCES
Aziz-Zadeh, L., Iacoboni, M., Zaidel, E., Wilson, S., & Mazziotta, J. (2004). Left hemisphere motor facilitation in response to manual action sounds.European Journal of Neuroscience, 19, 2609–2612.
Badin, P., Tarabalka, Y., Elisei, F., & Bailly, G. (2010). Can you “read” tongue movements? Evaluation of the contribution of tongue display to speech understanding.Speech Communication, 52, 493–503.
Beardsworth, T., & Buckner, T. (1981). The ability to recognize oneself from a video recording of one’s movements without seeing one’s body. Bulletin of the Psychonomic Society, 18, 19–22.
Beauchamp, M. S. (2005). Statistical criteria in fMRI studies of multisensory integration. Neuroinformatics, 3, 93–114.
Beauchamp, M. S., Argall, B. D., Bodurka, J., Duyn, J. H., & Martin, A. (2004). Unraveling multisensory integration: Patchy organization within human STS multisensory cortex. Nature Neuroscience, 7, 1190–1192.
Beauchamp, M. S., Lee, K. E., Argall, B. D., & Martin, A. (2004). Integration of auditory and visual informations about objects in superior temporal sulcus. Neuron, 41, 809–823.
Birn, R. M., Bandettini, P. A., Cox, R. W., & Shaker, R. (1999). Event-related fMRI of tasks involving brief motion.Human Brain Mapping, 7, 106–114.
Buccino, G., Lui, F., Canessa, N., Patteri, I., Lagravinese, G., Benuzzi, F., et al. (2004). Neural circuit involved in the recognition of actions performed by nonconspecifics: An fMRI study. Journal of Cognitive Neurosciences, 16, 114–126.
Callan, D. E., Jones, J. A., Munhall, K. G., Callan, A. M., Kroos, C., & Vatikiotis-Bateson, E. (2003). Neural processes underlying perceptual enhancement by visual speech gestures. NeuroReport, 14, 2213–2217.
Callan, D. E., Jones, J. A., Munhall, K. G., Callan, A. M., Kroos, C., & Vatikiotis-Bateson, E. (2004). Multisensory integration sites identified by perception of spatial wavelet filtered
visual speech gesture information. Journal of Cognitive Neuroscience, 16, 805–816.
Calvert, G. A., Bullmore, E., Brammer, M. J., Campbell, R., Iversen, S. D., Woodruff, P., et al. (1997). Silent lip reading activates the auditory cortex.Science, 276, 593–596. Calvert, G. A., & Campbell, R. (2003). Reading speech from still
and moving faces: The neural substrates of visible speech. Journal of Cognitive Neuroscience, 15, 57–70.
Calvert, G. A., Campbell, R., & Brammer, M. J. (2000). Evidence from functional magnetic resonance imaging of crossmodal binding in the human heteromodal cortex.Current Biology, 10, 649–657.
Calvo-Merino, B., Glaser, D. E., Grèzes, J., Passingham, R. E., & Haggard, P. (2005). Action observation and acquired motor skills: An fMRI study with expert dancers.Cerebral Cortex, 15, 1243–1249.
Calvo-Merino, B., Grèzes, J., Glaser, D. E., Passingham, R. E., & Haggard, P. (2006). Seeing or doing? Influence of visual and motor familiarity in action observation.Current Biology, 16, 1905–1910.
Campbell, R., MacSweeney, M., Surguladze, S., Calvert, G., McGuire, P., Suckling, J., et al. (2001). Cortical substrates for the perception of face actions: An fMRI study of the specificity of activation for seen speech and for meaningless lower-face acts (gurning).Cognitive Brain Research, 12, 233–243.
Cappe, C., & Barone, P. (2005). Heteromodal connections supporting multisensory integration at low levels of cortical processing in the monkey.European Journal of Neuroscience, 22, 2886–2902.
d’Ausilio, A., Bartoli, E., Maffongelli, L., Berry, J. J., & Fadiga, L. (2014). Vision of tongue movements bias auditory speech perception.Neuropsychologia, 63, 85–91.
d’Ausilio, A., Bufalari, I., Salmas, P., & Fadiga, L. (2011). The role of the motor system in discriminating degraded speech sounds.Cortex, 48, 882–887.
d’Ausilio, A., Pulvermüller, F., Salmas, P., Bufalari, I., Begliomini, C., & Fadiga, L. (2009). The motor somatotopy of speech perception.Current Biology, 19, 381–385.
Di Pellegrino, G., Fadiga, L., Fogassi, L., Gallese, V., & Rizzolatti, G. (1992). Understanding motor events: A neurophysiological study.Experimental Brain Research, 91, 176–180. Eckert, M. A., Kamdar, N. V., Chang, C. E., Beckmann, C. F.,
Greicius, M. D., & Menon, V. (2008). A crossmodal system linking primary auditory and visual cortices: Evidence from intrinsic fMRI connectivity analysis.Human Brain Mapping, 29, 848–885.
Eickhoff, S. B., Stephan, K. E., Mohlberg, H., Grefkes, C., Fink, G. R., Amunts, K., et al. (2005). A new SPM toolbox for combining probabilistic cytoarchitectonic maps and functional imaging data.Neuroimage, 25, 1325–1335. Ferrari, P. F., Gallese, V., Rizzolatti, G., & Fogassi, L. (2003).
Mirror neurons responding to the observation of ingestive and communicative mouth actions in the monkey ventral premotor cortex.European Journal of Neuroscience, 17, 1703–1714.
Fogassi, L., Ferrari, P. F., Gesierich, B., Rozzi, S., Chersi, F., & Rizzolatti, G. (2005). Parietal lobe: From action organization to intention understanding.Science, 308, 662–667.
Gallese, V., Fadiga, L., Fogassi, L., & Rizzolatti, G. (1996). Action recognition in the premotor cortex.Brain, 119, 593–609.
Grabski, K., Schwartz, J. L., Lamalle, L., Vilain, C., Vallée, N., Baciu, M., et al. (2013). Shared and distinct neural correlates of vowel perception and production.Journal of Neurolinguistics, 26, 384–408.
Grabski, K., Tremblay, P., Gracco, V., Girin, L., & Sato, M. (2013). A mediating role of the auditory dorsal pathway