HAL Id: hal-02823878
https://hal.inrae.fr/hal-02823878
Submitted on 6 Jun 2020HAL is a multi-disciplinary open access archive for the deposit and dissemination of sci-entific research documents, whether they are pub-lished or not. The documents may come from teaching and research institutions in France or abroad, or from public or private research centers.
L’archive ouverte pluridisciplinaire HAL, est destinée au dépôt et à la diffusion de documents scientifiques de niveau recherche, publiés ou non, émanant des établissements d’enseignement et de recherche français ou étrangers, des laboratoires publics ou privés.
productivity? The case study of French fruit and
vegetable sector
Aurélie Darpeix
To cite this version:
Aurélie Darpeix. Does labour force composition influence farm productivity? The case study of French fruit and vegetable sector. Journées des jeunes chercheurs du Département SAE2, Institut National de Recherche Agronomique (INRA). UAR Département Sciences Sociales, Agriculture et Alimentation, Espace et Environnement (0519).; European Association of Agricultural Economists (EAAE). INT., Oct 2009, Montpellier, France. 25 p. �hal-02823878�
DOES LABOUR FORCE COMPOSITION INFLUENCE FARM PRODUCTIVITY?
THE CASE STUDY OF FRENCH FRUIT AND VEGETABLE SECTOR
Aurélie Darpeix∗∗∗∗
Contributed Paper prepared for presentation at the 2009 JJC SAE2 department, Montpellier, France, October 1-2, 2009
Copyright 2009 by Aurélie Darpeix.
All rights reserved. Readers may make verbatim copies of this document for non-commercial purposes by any means, provided that this copyright notice appears on all such copies.
∗ UMR 1110 MOISA, INRA Montpellier, bât 26, 2 place Viala, F-34 060 Montpellier, tel : +33 (0)4 99 61 28 68, fax : +33 (0)4 67 54 58 05, [email protected]
Abstract
This article studies the impact of the labour force composition of farms – the share of family labour, permanent hired labour, and seasonal hired labour – on farm productivity. A simple transformation of a Cobb-Douglas function allows us to estimate the relative efficiency of each labour force. Our estimation is based on specialised fruit and vegetable farms over the period 1995-2006 drawn from the French sample of the Farm Accountancy Data Network (FADN). We show that the labour force composition affects the farm’s productivity and that family workers are less productive than hired workers even if the specialisation of some hired worker in seasonal high productivity tasks is taking into account. The results suggest that this difference is linked with productivity gains inherent to task specialisation. We also find that seasonal workers are not less productive than permanent ones altought seasonal work in agriculture is synonymous with low earnings, job insecurity and absence of career development.
Keywords: farm performance, labour productivity, workforce composition, seasonal work
INTRODUCTION
In developed countries, labour force on farms has been undergoing important changes since the end of the eighties. The share of family labour has declined while the share of hired labour – either permanent or most often seasonal – has been increasing [Findeis, 2002]. This trend is new and contrasts with the growing family nature of farming until the mid-1990s [Schmitt, 1991; Hill, 1993]. Changes of the labour force composition may impact the farm productivity. Task specialisation, skills or incentives to work efficiently can explain the different labour force productivity and thus farm productivity.
Whereas agricultural supports decrease and pressures to open up agricultural markets increase, farm performance is subject of concern. It can be measured by total factor productivity -the ratio of the outputs to the inputs that are used- or partial measures of productivity as labour productivity [Coelli and al., 2005]. Farm performance can also be measured by efficiency, notably technical efficiency [Farrell, 1957]: if the production frontier represents the maximum output attainable from each input level, the firm distance from this frontier is the technical inefficiency of the firm.
In the agricultural economics literature, many empirical studies have examined factors that influence farm technical efficiency. Classical factors have largely been studied : farm size and specialization, type of production, farmers characteristics (see Battese [1992] and Bravo-Utera et al. [1993] for literature reviews)… Others factors have also been studied: land tenure [Helfand and Levine, 2004; Davidova and Latruffe, 2007], degree of market integration [Latruffe and al., 2004; Davidova and Latruffe, 2007], received subsidies [Rezitis and al., 2003; Latruffe and al., 2008], etc.
However, a few studies have directly focused on the link between labour force composition and farm productivity. This link has sometimes been studied in labour economics generally focusing on workers’ skill differences [Mairesse and al., 1989; Crepon and al., 1993]. In the agricultural economics literature, a few econometric studies have formally tested for labor heterogeneity between family and hired labour [Deolalikar and Vijverberg, 1983, 1987; Frisvold, 1994] but, to our knowledge, none have broken down hired labour into permanent and seasonal labour although their results often pointed out the importance of seasonality in the explanation of worker productivity.
The aim of this article is to study the labour force composition of farms – the share of family labour, permanent hired labour, and seasonal hired labour – as an explanatory factor of farm productivity. We focus on one of the less subsidized agricultural sector and one of the more exposed to competition: the fruit and vegetable sector. It is moreover characterized by the large-scale use of wage labour, even though family labour remains important. In France, as in a lot of developed countries, the proportion of wage labour on fruit and vegetable farms has drastically increased (from 30% in 1995 to 48% in 2006)1. A simple transformation of a Cobb-Douglas function enables us to estimate the relative efficiency of each labour force. Our estimation is based on specialised fruit and vegetable farms over the period 1995-2006 drawn from the French sample of the European Farm Accountancy Data Network (FADN).
The article is organised as follows. In the first section we describe the French fruit and vegetable sector. In the second section, our research question is set out in more details. The third section presents the theoretical framework that leads to our econometric specification. The fourth section describes the data set and the empirical application. This is followed by the presentation of results and concluding comments.
1 THE FRUIT AND VEGETABLE FARMS IN THE WHOLE FRENCH FARMING SECTOR
The following sections present a description of the fruit and vegetable sector2 and a comparision with the whole French farming sector. It draws on the extrapoled FADN data (Table 1).
1.1 Comparing the fruit and vegetable farms to the whole farming sector.
The fruit and vegetable sector differs from the rest of the farming sector by the amount of wage labour it employs and by its high value-added. Moreover, government intervention in fruits and vegetables tends to be lower than in other agricultural sectors
1 French sample of the European Farm Accountancy Data Network (FADN)
2 French type farming 2011, 2012, 2013, 3211 (open-field vegetables, open-air vegetables, greenhouse vegetables, open-air and greenhouse vegetables, fruit).
According to the extrapolated data from FADN, the fruit and vegetable farms3 represent 4% of the French farms. Although they are not numerous, those farms produce 10% of the agricultural value-added, and use 9% of the total amount of farming working hours. In the mean, the economic size4 of these farms is superior to the average size of all farms. Their average SGM (standard gross margin) is about 100 000 € whereas this mean is around 70 000 € if we take all farms. The average value-added of these farms is almost three times greater than the average of the entire French farming sector (almost 90 000 € for a fruit and vegetable farm against around 25 000 € for the whole farming sector, 2006 data). Very intensive in labour and in intermediate consumption, they use in the mean 2.5 times more labour (that is about 8,000 labour hours, 2006 data), and 1.1 times more intermediate consumption (i.e. almost 120 000 €, 2006 data) than does the agricultural sector. However, they are less capitalistic than other farms5 (the mean value of capital asset is about 130 000 € for the fruit and vegetable farms against 180 000 € for the whole set of farms, 2006 data)
Those farms are far less family than French farms in general: only 17% of the fruit and vegetable farms use exclusively family workforce against 64% for French farms (2006 data). 50% of fruit and vegetable farms use seasonal workforce in addition to family workforce against 19% for the entire farming sector. Although the proportion of farms using exclusively permanent worker in addition to family workforce is the same in the fruit and vegetable sector than in the entire farming sector (about 8%), the share of farms using both forms of hired labour (permanent and seasonal) is far greater in the fruit and vegetable sector (25% against 8%).
3 Farm type 2011 2012 2013 3210
4 The Standard Gross Margin (SGM) enables to determine the economic size of farms: it corresponds to the value of production minus the cost of variable factors (in €).
5 The superficies of fruit and vegetable farms is smaller, in the mean, than the superficies of other farms (20 ha against 76 ha for other farms, 2006 data). Since the land is accounted as capital asset, capital assets are generally smaller for the fruit and vegetable farms.
Table 1- Summary statistics on the fruit and vegetable sector and on the entire French farming sector (Extrapoled FADN data)
1995 2006 Evolution 1995-2006
Fruit and vegetable
farms All farms
Fruit and vegetable
farms All farms
Fruit and vegetable
farms All farms
Number of farms 19 090 428 482 12 240 346 194 -36% -19% Mean SGM ( € 10^4) 9 6 10 7 +11% +17% Mean added value (€) 73 930 37 676 89 183 26 373 +21% -30% Mean gross product (€) 145 235 118 227 207 739 135 461 +43% +15% Mean labour (h) 7 893 4 087 7 984 3 181 +1% -22% Mean fixed assets (€) 129 383 166 613 129 564 179 225 +0% +8% Mean intermediate
consumption (IC) (€) 71 306 80 550 118 556 109 088 +66% +35% Productivity (AV €/h) 9,4 9,2 11,2 8,3 +19% -10% Productivity (AV €/K €) 0,6 0,2 0,7 0,1 +20% -35% % family farms 32% 70% 17% 64% -47% -9% % farms with seas. hired
labour 40% 16% 50% 19% +25% +19% % farms with perm.
hired labour 12% 9% 8% 9% -33% 0% % farms with seas. and
perm. hired labour 16% 5% 25% 8% +56% +60% % family labour 70% 91% 52% 87% -26% -4% % seasonal labour 19% 4% 36% 6% +89% +50% % permanent labour 11% 5% 12% 7% +9% +40%
All monetary values are in 2000 €
Therefore, the fruit and vegetable sector is more salaried than is the entire agricultural sector. In fruit and vegetable farms, the family labour only represents 52% of the total labour against 87% for the entire farming sector, and the seasonal workforce corresponds to ¾ of the hired labour.
The labour productivity in those farms (value added/labour hour) is greater than the labour productivity in the farming sector in general (around 11€/h against 8€/h for the entire agricultural sector, 2006 data). The capital productivity (value added/value of capital asset) is greater in fruit and vegetable farms (0.7€ /invested € against 0.1€ /invested € for the entire agricultural sector). This high capital productivity reflects the fact that these cultures are pretty intensive: they create a high value-added on a small surface.
1.2 Evolution from 1995 to 2006
The fall in the number of farms has been far more important in the fruit and vegetable sector (-36%) than it was in the entire farming sector (-19%). This decrease in the number of farms was accompanied by an increasing in the average size of farms (+10 000 € in SGM in the mean).
Identically, the changes in the workforce nature have been far deeper in the fruit and vegetable farms than they were in the entire farming sector. The share of the family labour has strongly decreased in the fruit and vegetable sector (-26% against -4% in the entire agricultural sector). The share of the permanent labour has remained relatively still (around 11%) whereas the share of the seasonal labour rose sharply from 19% to 36%. Whereas the total amount of labour has decreased in the whole farming sector (-22%), it has remained relatively stable in the fruit and vegetable sector (+1%).
Although the average value-added of French farms decreased of 30% between 1995 and 2006, the value-added of fruit and vegetable farms increased of 21%. Since the intermediate consumptions of these farms increased strongly by this period (+66%), the growth of their value-added is based on a sharp growth of their gross product.
The labour productivity has risen in the fruit and vegetable farms (+2€ per hour), whereas it has slightly decreased in the whole farming sector (-1€ per hour). As for the capital productivity, it has decreased in the farming sector (-35%), whereas it has risen for the fruit and vegetable farms (+20%).
The fall in the number of farms came with an increasing in the average size of farms as in the entire sector. However, the value-added of fruit and vegetable farms increased by this period while the one of the whole farming sector decreased.
Whereas the total amount of labour remained relatively stable in the labour-intensive fruit and vegetable sector between 1995 and 2006, the amount of wage labour rose. The changes of the labour force composition may impact the farm productivity.
2 RESEARCH QUESTION
The use of hired labour in family farming is synonymous with a greater division of labour, with a better specialization for manual tasks and tending to productivity gains. However,
due to the hardly predictable and seasonal nature of agricultural activity, controlling workers’ effort is difficult when only relying on observable performances. As family workers are the full residual claimants, they have less incentive to shirk. On the contrary, the use of hired labour generally implies supervision costs which depend on the incentives for workers to shirk [Allen and Lueck, 1998].
Some studies have highlighted that in the agricultural sector the recruitment of seasonal workers instead of permanent workers does not only reflect the seasonality of work: the existence of under-employed permanent workers during periods of slack activity generates hoarding costs, but enables the farmer to reduce recruitment costs and ensure the availability of a certain amount of labour for the peak season [Bardhan, 1983; Darpeix and al., 2008]. Thus, for any job, related or not to seasonal activity, the farmer could either choose a permanent or a temporary contract.
This contract choice may affect the worker productivity and thus the farm efficiency fort two reasons. First, farming skills are based on knowledge that are location, crop and farm specific. For jobs requiring specific human capital investment, the investment decision depends on the expected stability of the labour relation [Becker, 1980]. Long labour relations may be an important source of efficiency.
Secondly, efficiency wage models hypothesize that worker productivity depends positively on the real wage rate [Stiglitz, 1987]. That is, the wage premium induces less shirking and selective recruitment of better workers.
The permanent contract is more stable, often better paid and accompanied by non monetary compensations such as accomodation, land loan… In agriculture, permanent contracts generally lower the incentives for workers to shirk [Eswaran and Kotwal, 1985; Pal, 1999, 2002]. The temporary workers may be more productive in order to obtain a permanent contract. However, the likelihood of the renewal of a temporary contract into a permanent one is low in the fruit and vegetable sector.
The permanent workers are expected to be more productive than the temporary ones thanks to their specific human capital and to their higher oportunity cost of being fire. However, in agriculture, despite the temporary nature of the contract, continuity generally exists in labour relationships [Lamanthe, 2005]. Seasonal workers generally come back year after year in the same farm and accumulate specific skills as permanent workers do. Moreover, some temporary contracts, specific to the agricultural sector, may also have
high incentive. OMI6 contracts, temporary immigration contracts for work, represent almost 20% of French seasonal work7. These workers come to France for six months to work on a specific farm. The right to stay in France is linked to the labor contract. If the workers are fired they have to leave the French territory and may have difficulties to come back the following year. Thus, the opportunity cost of being fired for these workers is high, and this increases the cost of being caught shirking. It results in higher levels of effort.
Labour force composition of one farm is expected to impact its productivity. However, it has rarely been studied as such in the agricultural economics literature.
Previous studies on farm performance have focused on the impact of the farm structure on its efficiency. The distinction between individual farms, co-operatives or corporate farms has largely been studied mainly in transitional economies (see Gorton et al. [2004] for a literature review) but also in other countries, like Portugal for example [Hallam and Machado, 1996].
However, the existence of hired labour on family farms has often been neglected. The labour force composition in this kind of farms has rarely been taken into account. Some papers distinguish farms that hire labour and farms that do not. They show that farms with hired labour are less efficient than pure family farms [Hallam and Machado, 1996; Rezitis and al., 2003]. Moreover, previous studies have taken into account the share of hired labour in total farm labour [Hallam and Machado, 1996; Latruffe and al., 2004, 2005; Davidova and Latruffe, 2007; Lambarraa and al., 2007; Latruffe and al., 2008; Zhu and al., 2008; Lambarraa and al., 2009]. Their results are not conclusive: some suggest that the share of hired labour has a positive impact on farm efficiency [Lambarraa and al., 2007; Lambarraa and al., 2009] confirming the expectation that hired labour induces gains from task specialisation. Other studies suggest that the impact of the share of hired labour on farm efficiency is negative, supporting the hypothesis that family workers are more concerned about the production processes and have incentives to work efficiently [Hallam and Machado, 1996; Rezitis and al., 2003; Latruffe and al., 2005]. Lastly, studies bring together both views by showing that the results depend on the home country of the farm
6 Office des migrations internationales, French agency in charge of migration. 7 OMI data and French agricultural census from 2005.
and on the type of production, in particular livestock or crop [Latruffe and al., 2004; Zhu and al., 2008]. In these studies, the workforce composition is not investigated as such, but is treated as a variable among others.
The studies that directly focused on labour productivity also have heterogeneous results [Deolalikar and Vijverberg, 1983, 1987; Frisvold, 1994]. Deolalikar and Vijverberg [1983; 1987] analysed the output effects of family and hired labour. They had mixed results with different data. In the earlier study, they found that family labour has a higher impact on output than hired labour. Conversely, in the later study, they found that hired labour have a greater impact on output than family labour. They suggested that this latter result may be due to seasonal differences in labour productivity. Reffering to Nath’s study [1974], they argued that the marginal productivity of labour is higher for peak season tasks, where hired labour predominates, than for slack season tasks where the share of family labour is often higher. Thus, hired workers may be specialized in high productivity tasks. Although they pointed out the importance of seasonality, the distinction between permanent and seasonal hired labour is not considered as being pertinent for understanding the relative contribution to efficiency of all labour types together with family labour. However, this distinction could allow to control for task seasonality and to compare two kinds of labour used in both the busy and the slack season: permanent hired workers and family workers.
The aim of this paper is to study the impacts of various labour force mixes (composed of family labour, permanent hired labour and seasonal hired labour) on the average productivity of farms.
3 THEORETICAL FRAMEWORK
The production function is specified as a simple Cobb-Douglas function with only two production factors: capital and labour. Drawing on Mairesse [1989], Crepon and al.[1993] and Mouelhi et al. [2001], we consider an aggregate measure of labour that takes into account the labour force composition. The productive labour for farm i at date t L*it, aggregates different types of labour correcting for their unequal marginal productivity:
* *
(1 ) (1 )
(1 )
fam perm seas
it it it it it it it it L L L L L L Rperm Rseas
µ
ν
µ
ν
= + + + + = + +with family labour in hours for farm at date , permanent hired labour in hours for farm at date , seasonal hired labour in hours for farm at date ,
fam it perm it seas it perm fam s it it it it L i t L i t L i t L =L +L +L
(
)
,(1 ) relative efficiency ratio, namely permanent labour productivity relative to family labour productivity family labour productivity normalized to 1 ,
(1+ ) relative efficiency ratio, namely seas
eas
µ
ν
+
(
)
onal labour productivity relative to family labour productivity family labour productivity normalized to 1 ,
, . perm it it it seas it it it L Rperm L L Rsai L = =
Let the production function be:
*
with the capital
it it it it Y aK L K α β =
By taking natural logarithm of this equation and using the Taylor series of log(1−x)about 0, we have:
log(Yit)=cst+
α
log(Kit)+β
log(Lit)+βµ
Rpermit+βν
RseasitTurning to the empirical model, we draw from (3), the following equation that we estimate on an unbalanced panel:
log( ) log( ) log( )
with corresponding to the statistical noise.
it it it it it it
it
Y cst
α
Kβ
Lβµ
Rpermβν
Rseasε
ε
= + + + + +
4 DATA USED AND DESCRIPTIVE STATISTICS
4.1 Data
Data from specialised fruit and vegetable farms8 over the period 1995-2006 are obtained from the French sample of the Farm Accountancy Data Network (FADN). The FADN database contains information about farms’assets, outputs, production costs, incomes, as well as labour input (family and hired labour).
The FADN database distinguishes non wage earning workers from wage earning workers. The non wage earning workers are not paid or their wages are not counted as costs but as private payments. We assume that this distinction (non wage earner/ wage earner) corresponds to a distinction between family workers and hired worker. Indeed, family workers are generally non wage earners. They are wage eaners in less than 1% of fruit and vegetable farms and, in this instance, they only represent 5% of total labor9. The FADN database also distinguishes permanent and seasonal workers. A worker is a permanent worker if “during one year, he works at least one day per week (except leaves)”.Otherwise he is a seasonal worker.
it
Y is measured by the gross value-added (gross output net from the value of intermediate goods and services), K by the depreciated value of fixed assets and it L by the worked it hours. For wage earners, worked hours are counted from payslips. Therefore hired labour may be underestimated if there is unregistered work. For family workers, worked hours are declared.
We deflate all monetary values (at current price) with corresponding price index10 to get the values at constant price.
The definition and the description of the variables are presented in Annex 2.
8 French type farming 2011, 2012, 2013, 3211 (open-field vegetables, open-air vegetables, greenhouse vegetables, open-air and greenhouse vegetables, fruit).
9 Data from the French agricultural census of 2000.
10 Index of purchase prices of the means of agricultural production (investment and intermediate consumption), index of producer prices of fruit and vegetable products (Agreste data).
The FADN database lacks informations about farm characteristics. For instance, the production (what types of fruit or vegetable are produced), the way of commercialization (where and how this production is sold: cooperatives, supermarkets or export…) or the workers’ skills are unknowed. That’s why we use panel data: thanks to the double dimension of panel data (time and individual), it’s possible to take into account the influence of non-observable (or non-observed) individual characteristics on the individual behavior when these characteristics are stable over time. We also include annual dummies to take into account annual events or characteristics that influence all farms in a similar way.
4.2 Sampling
Our sample is an unbalanced panel. The FADN database contains 834 fruit and vegetable farms observed at least 2 years over the period 1995-2006 (4596 farm-year pair observations)11.
Few gross values added are negatives (71 farms and 443 farm-year pairs observations). Looking more precisely at the data set, the negative values added correspond to very low annual production that can be due to significant climatic incidents. As these values are likely to bias our results and as we can not control for the smallness of the production due to climatic incidents, farms with negative values added are excluded from the sample (9% of all farms)12.
Our sample definition may introduce problems of selection bias. However, observations seem to be dropped in a random way: the probability for a farm to have at least one negative gross value-added do not seem to be strongly correlated with farm characteristics (probit estimations).
A total of 763 farms (4153 farm-year pair observations) are thus selected.
The characteristics and the evolution of our sample are similar to the ones of the fruit and vegetable sector presented in section 1 (see Annex 1).
11 Taking into account the sampling weights, these farms represent around 13 000 farms.
12 It would have been possible to use the Heckman's methodology for correcting this selectivity bias. Nevertheless, it would have been complicated and imprecise as only few farms have negative values added and as we lack exogenous variables.
5 RESULTS AND DISCUSSION
As expected, individual specific effects exist13. These individual effects are correlated with regressors14. Indeed, the non-observable farm characteristics that can affect the production level (as management quality) can easily be correlated with the quantity of factors (labor and capital). As the random-effect model requires the individual effect-regressor independence, we use a fixed-effect estimation that gives an unbiased estimate regardless of violation of this assumption15. Thus, we estimate the equation by an OLS. The within estimator is computed by using the xtreg command of stata. We correct for heterocedasticity. No autocorrelation was found16. The results are reported in table 2. We use a stratified random sample. Sampling weights are available in the FADN database. OLS and WLS are non biased estimators which asymptotically converge. The selection bias which is coming from our sample definition alters the relative weights of each observation. As OLS is more robust to bad specifications of weights, we use the OLS estimation. However, we note that small farms are underrepresented in the sample.
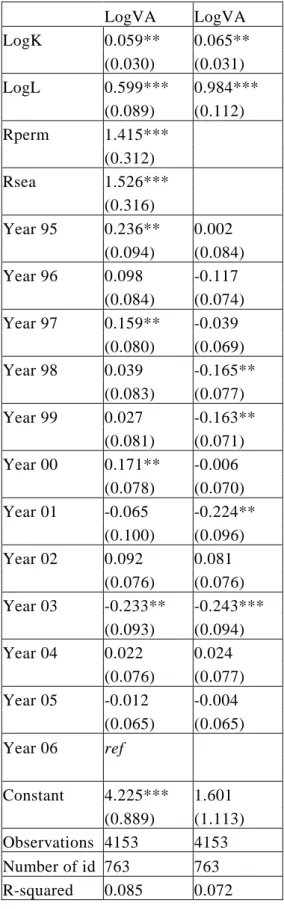
The results show that the elasticity of production relatively to labour is much higher than that relatively to capital. In fact, as the fruit and vegetable sector is a labour intensive sector, we expect that the contribution of labour to production is higher than that of capital.
The coefficients of the workforce composition variables (Rseas, Rperm) are both significant. Thus, the labour force composition influences the farm productivity.
13 Fisher test (Prob > F =0.0000) 14 Hausman Test (Prob>chi2 = 0.0000) 15 [Greene, 2000], p289.
Table 2- Results of the panel estimation (xtreg Stata command) LogVA LogVA LogK 0.059** 0.065** (0.030) (0.031) LogL 0.599*** 0.984*** (0.089) (0.112) Rperm 1.415*** (0.312) Rsea 1.526*** (0.316) Year 95 0.236** 0.002 (0.094) (0.084) Year 96 0.098 -0.117 (0.084) (0.074) Year 97 0.159** -0.039 (0.080) (0.069) Year 98 0.039 -0.165** (0.083) (0.077) Year 99 0.027 -0.163** (0.081) (0.071) Year 00 0.171** -0.006 (0.078) (0.070) Year 01 -0.065 -0.224** (0.100) (0.096) Year 02 0.092 0.081 (0.076) (0.076) Year 03 -0.233** -0.243*** (0.093) (0.094) Year 04 0.022 0.024 (0.076) (0.077) Year 05 -0.012 -0.004 (0.065) (0.065) Year 06 ref Constant 4.225*** 1.601 (0.889) (1.113) Observations 4153 4153 Number of id 763 763 R-squared 0.085 0.072
The relative efficiency ratios of permanent and seasonal workers (respectively (1+µ) and (1+ν)) are non linear transformations of the coefficients of Rperm and Rseas (estimated parameters βµ and βν). Their variance, standard error and significance level are calculated using Delta method (see Greene [2000] pp 357-358 - Stata’s nlcom command). The nonlinear calculations are reported in Table 3.
Table 3- Relative efficiency ratio of permanent workers (1+µ) and seasonal workers (1+ν) LogVA Coef. Std. Err. t P>t [95% Conf. Interval]
(1+µ) 3,364 0659 5,11 0,000 2,072 4,656 (1+ν) 3,549 0,691 5,13 0,000 2,193 4,905
The permanent labour productivity is significantly higher than the family one ( (1+µ)>1). The same result is found for seasonal labour. As we distinguished seasonal and permanent hired labour, the difference between the permanent labour productivity and the family one can not be due to seasonal differences in labour productivity as Deolalikar and Vijverberg suggested [1987]. This difference of labour productivity is in line with the results of previous studies that suggest that family farms are less efficient than farms with hired labour as the division of labour is lower in family farm [Latruffe and al., 2004; Lambarraa and al., 2007; Zhu and al., 2008; Lambarraa and al., 2009]. It suggests that family labour is less productive than hired labour as family workers are less specialised on specific tasks. The productivity gains due to the division of labour and the task specialisation exceed the productivity loss due to hired worker moral hazard.
When comparing relative efficiency ratios of permanent and seasonal workers ( (1+µ) and (1+ν)), our results show that the seasonal workers are more productive than the permanent ones. However, the coefficients of workforce composition variables (Rseas Rperm ) are not significantly different (ttest p=0.45). Thereby, the difference of , workers productivity is not significant.
Permanent workers were expected to be more productive than seasonal workers thanks to their specific human capital and to their higher oportunity cost of being fire. Several reasons can explain that the difference of productivity is not significant. Firstly, as we noted in the data description, hired labour may be underestimated due to unregistered work. The seasonal labour productivity can be overestimated as unregistred work can be
more common for seasonal work than for permanent work. Secondly, seasonal workers are employed for peak season tasks when the marginal productivity of labour is higher. Permanent workers can be less efficient at some points of the season as they may be underuse (hoarding cost theory). Lastly, specific agricultural temporary contracts (as OMI contracts) do not put less incentive on workers than permanent contracts. Moreover, the temporary nature of the seasonal contract do not prevent specific human capital investment as seasonal workers generally come back year after year.
6 CONCLUSIONS
This study provides a framework to focus on the impact of the labour force composition on farm productivity. It has enabled us to estimate the relative efficiency of the different types of labour force present on the farm.
This work shows that the labour force composition affects the farm’s productivity. This result is in line with previous studies using different methodologies. They also highlight the importance of distinguishing family and hired labour and suggest that the distinction between permanent and seasonal hired labour might not be useless.
We find that, specifically for fruit and vegetable farms, family workers are less productive than hired workers: this result holds even more for permanent hired workers. We also find that seasonal workers are not less productive than permanent ones although seasonal work in agriculture goes with low earnings, job insecurity and absence of career development. Our methodology does not enable us to identify the exact cause of heterogeneity in labour productivity among farm workers. However, we suspect that this results from productivity gains inherent to task specialisation for permanent hired labour and from specialisation in high-productivity tasks for seasonal hired labour. However, the relatively high productivity of seasonal workers can also be related to specific agricultural temporary contracts that put incentive on workers. Indeed, despite of low earnings and job insecurity, the temporary immigration contracts for work lower the incentives for workers to shirk as the right to stay in France is linked to the labor contract.
Between 1995 and 2006, labour force composition on fruit and vegetable farms exhibited deep changes although the amount of labour has remained relatively stable. At the same
time, the value added of these farms drastically increased. Our result suggest that this dynamism of the fruit and vegetable sector by the period 1995-2006 may be linked to changes in the workforce composition.
7 TABLES AND ANNEX
Annex 1- Summary statistics on the fruit and vegetable farm of the sample (Extrapoled FADN data)
1995 2006 Evolution
Number of farms 14 994 9 064 -40% Mean SGM ( € 10^4) 9 11 22% Mean value added (€) 76270 126785 66% Mean gross product (€) 145 034 251 581 73% Mean labour (h) 8169 8254 1% Mean fixed assets (€) 120 853 141 144 17% Mean intermediate
consumption (IC) (€) 54 955 101487 85% Productivity (AV €/h) 9,3 15,4 66% Productivity (AV €/K €) 0,7 0,9 29% % family farms 29% 15% -48% % farms with seas. hired
labour 41% 48% 17%
% farms with perm. hired
labour 13% 9% -31%
% farms with seas. and
perm. hired labour 17% 28% 65% % family labour 69% 50% -28% % seasonal labour 19% 27% 42% % permanent labour 12% 14% 17%
Annex 2- Definition and summary statistics, explanatory variables
Variable Definition Mean Std. Dev. Min Max Observations overall 11,07 1,30 0,00 13,72 N = 4153 between 1,05 4,97 13,43 n = 763 LogAV Log (Gross value
added)
(in 2000 euros)
within 0,85 -0,26 16,04 T-bar = 5,44 overall 11,44 1,20 -0,17 14,71 N = 4153 between 1,09 6,54 14,55 n = 763 LogK Log (Depreciated
value of fixed assets)
(in 2000 euros) within 0,59 0,46 15,16 T-bar = 5,44 overall 8,93 0,73 7,38 11,37 N = 4153 between 0,74 7,38 11,11 n = 763 LogL Log (Worked hours)
within 0,21 7,05 9,96 T-bar = 5,44 overall 0,16 0,23 0,00 0,96 N = 4153 between 0,21 0,00 0,93 n = 763 Rperm Permanent work/
total work
within 0,10 -0,51 0,93 T-bar = 5,44 overall 0,36 0,28 0,00 0,99 N = 4153 between 0,26 0,00 0,98 n = 763 Rseas Seasonal work/ total
work
within 0,12 -0,37 1,05 T-bar = 5,44 overall 0,07 0,26 0,00 1,00 N = 4153 between 0,14 0,00 0,50 n = 763 Year 95 1 if the year is 1995
else 0
within 0,23 -0,43 0,99 T-bar = 5,44 overall 0,08 0,27 0,00 1,00 N = 4153 between 0,15 0,00 0,50 n = 763 Year 96 1 if the year is 1996
else 0
within 0,25 -0,42 1,00 T-bar = 5,44 overall 0,08 0,27 0,00 1,00 N = 4153 between 0,12 0,00 0,50 n = 763 Year 97 1 if the year is 1997
else 0
within 0,26 -0,42 1,00 T-bar = 5,44 overall 0,08 0,27 0,00 1,00 N = 4153 between 0,11 0,00 0,50 n = 763 Year 98 1 if the year is 1998
else 0
within 0,26 -0,42 1,00 T-bar = 5,44 overall 0,09 0,28 0,00 1,00 N = 4153 between 0,11 0,00 0,50 n = 763 Year 99 1 if the year is 1999
else 0
within 0,27 -0,41 1,00 T-bar = 5,44 overall 0,09 0,28 0,00 1,00 N = 4153 between 0,10 0,00 0,50 n = 763 Year 00 1 if the year is 2000
else 0
within 0,27 -0,41 1,00 T-bar = 5,44 overall 0,09 0,28 0,00 1,00 N = 4153 between 0,10 0,00 0,50 n = 763 Year 01 1 if the year is 2001
else 0
within 0,27 -0,41 1,01 T-bar = 5,44
Variable Definition Mean Std. Dev. Min Max Observations overall 0,09 0,28 0,00 1,00 N = 4153 between 0,10 0,00 0,50 n = 763 Year 02 1 if the year is 2002
else 0
within 0,27 -0,41 1,00 T-bar = 5,44 overall 0,08 0,27 0,00 1,00 N = 4153 between 0,10 0,00 0,50 n = 763 Year 03 1 if the year is 2003
else 0
within 0,26 -0,42 1,00 T-bar = 5,44 overall 0,09 0,28 0,00 1,00 N = 4153 between 0,11 0,00 0,50 n = 763 Year 04 1 if the year is 2004
else 0
within 0,27 -0,41 1,00 T-bar = 5,44 overall 0,09 0,29 0,00 1,00 N = 4153 between 0,15 0,00 0,50 n = 763 Year 05 1 if the year is 2005
else 0
within 0,26 -0,41 1,01 T-bar = 5,44 overall 0,08 0,27 0,00 1,00 N = 4153 between 0,15 0,00 0,50 n = 763 Year 06 1 if the year is 2006
else 0
within 0,25 -0,42 1,00 T-bar = 5,44
NB: Min Max between/ ( )=Min Max x/ ( )i and Min Max within/ ( )=Min Max x/ ( it− −xi x)
8 MAIN REFERENCES
Allen, D. W., and Lueck, D. - 1998, "The Nature of the Farm." Journal of Law and Economics, 41: 343-386
Bardhan, P. - 1983, "Labor-Tying in a Poor Agrarian Economy: A Theoretical and Empirical Analysis." The Quarterly Journal of Economics, 98: 501-514
Battese, G. E. - 1992, "Frontier production functions and technical efficiency: a survey of empirical applications in agricultural economics." Agricultural Economics, 7: 185-208
Becker, G. S. - 1980, Human capital, University of Chicago Press Chicago.
Bravo-Ureta, B. E., and Pinheiro, A. E. - 1993, "Efficiency Analysis of Developing Country Agriculture: A Review of the Frontier Function Literature." Agricultural and Resource Economics Review, 22: 88-101
Cameron, A. C., and Trivedi, P. K. - 2009, Microeconometrics Using Stata, Texas, Stata Press.
Coelli, T., Prasada Rao, D. S., O'Donnell, C., and Battese, G. E. - 2005, An Introduction to Efficiency And Productivity Analysis, New York, Springer.
Crepon, B., and Mairesse, J. - 1993, "Productivité, recherche-développement et qualifications." Guéllec éd., Innovation et Compétitivité. INSEE-Méthodes: 181-221
Darpeix, A., Bignebat, C., and Perrier-Cornet, P. - 2008, "Wage labor demand in agriculture: what does family farming hide?" mimeo:
Davidova, S., and Latruffe, L. - 2007, "Relationship between technical efficiency and farm financial management : the example of Czech Republic." Journal of Agricultural Economics, 58: 269-288
Deolalikar, A. B., and Vijverberg, W. P. M. - 1983, "The Heterogeneity of Family and Hired Labor in Agricultural Production: A Test Using District-Level Data from India." Journal of Economic Development, 8: 45-69
Deolalikar, A. B., and Vijverberg, W. P. M. - 1987, "A test of heterogeneity of family and hired labour in Asian agriculture." Oxford Bulletin of Economics and Statistics, 49: 291-305
Eswaran, M., and Kotwal, A. - 1985, "A Theory of Two-Tier Labor Markets in Agrarian Economies." The American Economic Review, 75: 162-177
Farrell, M. J. - 1957, "The measurement of productive efficiency." Journal of the Royal Statistical Society, 120: 253-281
Findeis, J. - 2002, The Dynamics of Hired Farm Labor: Constraints and Community Responses, New York, CABI Publishing.
Frisvold, G. B. - 1994, "Does supervision matter? Some hypothesis tests using Indian farm-level data." Journal of Development Economics, 43: 217-38
Gorton, M., and Davidova, S. - 2004, "Farm productivity and efficiency in the CEE applicant countries: a synthesis of results." Agricultural Economics, 30: 1-16
Greene, W. H. - 2000, Econometric Analysis, New Jersey, Upper Saddle River.
Hallam, D., and Machado, F. - 1996, "Efficiency analysis with panel data: A study of Portuguese dairy farms." European Review of Agricultural Economics, 23: 79-93
Helfand, S. M., and Levine, E. S. - 2004, "Farm size and the determinants of productive efficiency in the Brazilian Center-West." Agricultural Economics, 31: 241-249
Hill, B. - 1993, "The “Myth” of the Family Farm: Defining the Family Farm and Assessing its Importance in the European Community." Journal of Rural Studies, 9: 359–70
Lamanthe, A. - 2005, "Les transformations du marché du travail: un éclairage à partir de l'analyse des décalages entre offre et demande dans un système productif localisé." Sociologie du travail, 47: 37-56
Lambarraa, F., Serra, T., and Gil, J. M. - 2007, "Technical efficiency analysis and decomposition of productivity growth of Spanish olive farms." Spanish Journal of Agricultural Research, 5: 259-270
Lambarraa, F., Stefanou, S., Serra, T., and Gil, J. M. - 2009, "The impact of the 1999 CAP reforms on the efficiency of the COP sector in Spain." Agricultural Economics, 40: 355-364
Latruffe, L., Balcombe, K., Davidova, S., and Zawalinska, K. - 2004, "Determinants of technical efficiency of crop and livestock farms in Poland." Applied Economics, 36: 1255-1263
Latruffe, L., Balcombe, K., Davidova, S., and Zawalinska, K. - 2005, "Technical and scale efficiency of crop and livestock farms in Poland: does specialization matter?" Agricultural Economics, 32: 281-296
Latruffe, L., Guyomard, H., and Le Mouël, C. 2008. "Impact of CAP Direct Payments on French Farms’ Managerial Efficiency." Pp. 1-8 in 12th congress of the European Association of Agricultural Economists. Ghent, Belgium.
Mairesse, J., and Sassenou, M. - 1989, "Les facteurs qualitatifs de la productivité: un essai d’évaluation." Economie et Prévision, 91: 35-42
Mouelhi, R. B. A., and Goaied, M. - 2001, "Efficience technique et incitations salariales : analyse empirique su un panel incomplet des industries textiles en Tunisie." Economie et prévision, 148: 99-111
Nath, S. K. - 1974, "Estimating the seasonal marginal products of labour in agriculture." Oxford Economic Papers, 26: 375-387
Pal, S. - 1999, "Task-Based Segmentation of Rural Labour Contracts: Theory and Evidence." Bulletin of Economic Research, 51: 67-94
Pal, S. - 2002, "Segmentation of Rural Labour Contracts: Some Further Evidence." Bulletin of Economic Research, 54: 151-180
Rezitis, A. N., Tsiboukas, K., and Tsoukalas, S. - 2003, "Investigation of Factors Influencing the Technical Efficiency of Agricultural Producers Participating in
Farm Credit Programs: The Case of Greece." Journal of Agricultural and Applied Economics, 35: 529-542
Schmitt, G. - 1991, "Why is the agriculture of advanced Western economies still organized by family farms? Will this continue to be so in the future." European Review of Agricultural Economics, 18: 443-58
Stiglitz, J. E. - 1987, "The Causes and Consequences of The Dependence of Quality on Price." Journal of Economic Literature, 25: 1-48
Zhu, X., Demeter, R. M., and Lansink, A. O. 2008. "Competitiveness of dairy farms in three countries: the role of CAP subsidies." in EAAE Congress Ghent.