HAL Id: hal-02988761
https://hal.archives-ouvertes.fr/hal-02988761
Submitted on 4 Nov 2020HAL is a multi-disciplinary open access
archive for the deposit and dissemination of sci-entific research documents, whether they are pub-lished or not. The documents may come from teaching and research institutions in France or abroad, or from public or private research centers.
L’archive ouverte pluridisciplinaire HAL, est destinée au dépôt et à la diffusion de documents scientifiques de niveau recherche, publiés ou non, émanant des établissements d’enseignement et de recherche français ou étrangers, des laboratoires publics ou privés.
To cite this version:
Elodie Chapuis, Nadeen Ali, Camille Noûs, Guillaume Besnard. Adaptive response to olive cultivation in a generalist parasitic nematode (Meloidogyne javanica). Biological Journal of the Linnean Society, Linnean Society of London, 2020, 131 (2), pp.356-368. �10.1093/biolinnean/blaa089�. �hal-02988761�
For Peer Review
Adaptive response to olive cultivation in a generalist parasitic nematode (Meloidogyne javanica)
Journal: Biological Journal of the Linnean Society Manuscript ID BJLS-6298.R1
Manuscript Type: Original article Date Submitted by the
Author: 17-May-2020
Complete List of Authors: Chapuis, Elodie; CBGP
Ali, Nadeen; CBGP; Tishreen University Noûs, Camille; Laboratoire Cogitamus
Besnard, Guillaume; CNRS-UPS, UMR1174, EDB
For Peer Review
Adaptive response to olive cultivation
of in
a generalist
parasitic nematode (Meloidogyne javanica)
ELODIE CHAPUIS1*,NADEEN ALI1#,CAMILLE NOÛS3&GUILLAUME BESNARD2*
1CBGP, IRD, CIRAD, INRA, Montpellier SupAgro, University of Montpellier, 34988 Montpellier, France
2CNRS, UPS, IRD, UMR5174, EDB, Université Toulouse III Paul Sabatier, Bâtiment 4R1, 118 Route de Narbonne, 31062 Toulouse Cedex 9, France
3Laboratoire Cogitamus, 1 ¾ Rue Descartes, 75005 Paris, France
*Corresponding authors:. E-mail:elodie.chapuis@ird.fr; guillaume.besnard@univ-tlse3.fr #Present address: Tishreen University, Department of Plant Protection, Latakia, Syria
Running head: Parasite adaptive response to olive cultivation
3 4 5 6 7 8 9 10 11 12 13 14 15 16 17 18 19 20 21 22 23 24 25 26 27 28 29 30 31 32 33 34 35 36 37 38 39 40 41 42 43 44 45 46 47 48 49 50 51 52 53 54 55 56 57 58 59
For Peer Review
ABSTRACT: Cultivated plants usually differ from their wild progenitors in several morphological and/or physiological traits. Their microbe communities might also differ in particular due tobecause of adaptation to new conditions related to cultivation. To test this hypothesis, we here investigated morphological traits in a parthenogenetic root-knot nematode (Meloidogyne javanica) from natural and agricultural environments. Seventeen populations of
M. javanica were sampled on cultivated or and wild olives in Morocco, and then maintained in control conditions for a "common garden" experiment. We estimated the genetic variation on three traits (stylet size, neck width, and body width) by a quantitative genetic design - ten families per population and nine individuals per family were measured - while molecular variation was investigated with a mitochondrial marker to identify the genetic lineages of nematode isolates sampled from wild and cultivated olives. Significant morphological differences were detected between individuals from wild vs. cultivated host for the three traits, while no phylogenetic clustering was observed among isolates collected on those two hosts. Our results thus sustain suggest an adaptive response of the studied asexual parasite, likely for dealing withpossibly related to the deep modification of soil nematode community communities
between natural olive stands and orchards.
ADDITIONALKEYWORDS: clonal evolution – cultivation – genetic – morphology – olive tree – Olea europaea – root-knot nematodes – Meloidogyne javanica.
3 4 5 6 7 8 9 10 11 12 13 14 15 16 17 18 19 20 21 22 23 24 25 26 27 28 29 30 31 32 33 34 35 36 37 38 39 40 41 42 43 44 45 46 47 48 49 50 51 52 53 54 55 56 57 58 59 60
For Peer Review
INTRODUCTION
The evolution of traits depends upon genetic variation on which natural selection can act to produce adaptations in response to the environment (Fabian & Flatt, 2012). Environmental variation modulates organismal development and substantially contributes to phenotypic variation within and among populations. Understanding how environmental and genotypic variations interact to generate phenotypic variation is thus a central challenge in biology, especially for deciphering how organisms adapt to anthropogenic disturbance (e.g. Braendle & Teotonio, 2015; Cook, 2018; Grishkan et al., 2018; Ringot et al., 2018). Domesticated organisms are appropriate models for the study of such evolutionary processes due to their recent evolution under selection (< 12,000 years ago for most crops), and good archaeological or historical records on their human-mediated diffusion and subsequent diversification (Meyer & Purugganan, 2013). Besides, novel environmental conditions (e.g. related to animal breeding or plant cultivation) may also have ecological and evolutionary consequences on the interacting biota. For instance, parasites and endophytes associated to plants or animals should have also adapted to their host after their domestication (e.g. Stukenbrock et al., 2007; Gladieux et al., 2010).
The olive tree (Olea europaea L.) is the iconic Mediterranean crop that accompanied the emergence of first civilizations in the Middle East (Kaniewski et al., 2012). Archaeological evidences supports an early olive exploitation during the Neolithic, but its domestication (characterized by the establishment of orchards, and the vegetative multiplication of individuals with interesting agronomical traits, such as bigger fruits and adaptation to anthropogenic habitats) is considered to start in the Levant at the Chalcolithic period, at least 6000 years ago (for a review see Kaniewski et al., 2012). The cultivated olive origins are complex and multiple, with the human-mediated diffusion of cultivars, first from the northern Levant, followed by recurrent admixtures with local wild olives (commonly referred to oleasters) or
(pre-3 4 5 6 7 8 9 10 11 12 13 14 15 16 17 18 19 20 21 22 23 24 25 26 27 28 29 30 31 32 33 34 35 36 37 38 39 40 41 42 43 44 45 46 47 48 49 50 51 52 53 54 55 56 57 58 59
For Peer Review
)domesticated forms in various parts of the Mediterranean Basin (Díez et al., 2015; Besnard & Rubio de Casas, 2016). The structure of microbiome communities associated to the olive still needs to be better investigated to assess the impact of olive domestication and cultivation practices on their diversity (Besnard et al., 2018). Recent studies on nematodes (Palomares-Rius et al., 2012, 2015; Ali et al., 2017; Archidona-Yuste et al., 2018, 2020a) and fungi (Montes-Borrego et al., 2014; Abdelfattah et al., 2015) associated to the cultivated and/or wild olives indicate that such communities are influenced by environmental factors (e.g. soil parameters, cultivation methods) but also the genotype of the host. In particular, Ali et al. (2017) reported higher species richness for plant parasitic nematodes (PPNs) in wild olive stands, while their abundance was higher in olive orchards.
The mitotic parthenogenetic Meloidogyne javanica (Treub) Chitwood is one of the nematode species parasiting the olive (Ali et al., 2014). Like all PPNs impacting the roots,
Meloidogyne species prevent proper water and nutriments absorption. By consequence, the
impact on growth and yield of olive can be important (Lamberti & Lownsbery, 1968; Lamberti & Baines, 1969; Sasanelli et al., 1997, 2002), notably in nurseries (Nico et al., 2002). While few studies have been carried out on the intra-population genetic variability or the genetic dispersal between populations in plant parasitic nematodes (Plantard & Porte, 2004), root-knot nematodes (or RKNs; Meloidogyne spp.) have been relatively well studied. A particular attention was given to RKNs because they are widely distributed and are endoparasites of nearly every species of higher plants (Moens et al., 2009) causing significant yield crop losses worldwide. A huge morphological and genetic variability have been reported between
Meloidogyne species and between populations from the same species (Netscher, 1978; Hesar et al., 2011; da Silva et al., 2014; Medina et al., 2017; Tatu-Nyaku et al., 2018). This diversity
has been described based on various biological traits such as the morphology but it can also be studied through the ability of parasitism or the adaptation to environmental conditions (Jepson,
3 4 5 6 7 8 9 10 11 12 13 14 15 16 17 18 19 20 21 22 23 24 25 26 27 28 29 30 31 32 33 34 35 36 37 38 39 40 41 42 43 44 45 46 47 48 49 50 51 52 53 54 55 56 57 58 59 60
For Peer Review
1987; Eisenback & Triantaphyllou, 1991). In addition, the selection of virulent strains of RKNs on resistant plants may result in a co-evolution between the parasitic nematode and its host (Castagnone-Sereno, 2006).
The aim of this study was to evaluate the effect of crop cultivation on trait variation in one RKN species parasiting olive roots. We conducted a common garden experiment in order to measure the differentiation of three quantitative traits between 17 Moroccan populations of
M. javanica collected in both cultivated and natural O. europaea stands. We also characterized
genetic lineages of those RKNs using a mitochondrial marker, to control for their relatedness and assess lineage diversity within and among populations.
MATERIAL AND METHODS
BIOLOGICAL MATERIAL AND FIELD SAMPLING
In this study, we worked on the 17 Moroccan populations of the nematode Meloidogyne
javanica that were sampled in olive stands by Ali et al. (2016, 2017). Even if this species is
parasiting the roots, we collected soil in the upper rhizosphere (the 20–30 cm deep) with a small spade (Ali et al., 2016, 2017), because M. javanica spend almost all of their life cycle in the soil (Cadet & Thioulouse, 1998). This nematode survey was carried out from March to April 2012. Population locations (with GPS coordinates) are given in Fig. S1. We reused the same population labels as described in Ali et al. (2017). Those populations were either collected on cultivated olives or oleasters, to which we will then refer as "Cultivated" and "Wild" habitat, respectively [see Ali et al. (2017) for more details on sampling locations]. Cultivated olives from the agricultural sites correspond to the 'Picholine Marocaine' cultivar (Ali et al., 2017), that is largely spread in Morocco (Khadari et al., 2008), but we did not have any information about rootstock genotypes. All cultivated olives were conducted in traditional (7 locations) and
3 4 5 6 7 8 9 10 11 12 13 14 15 16 17 18 19 20 21 22 23 24 25 26 27 28 29 30 31 32 33 34 35 36 37 38 39 40 41 42 43 44 45 46 47 48 49 50 51 52 53 54 55 56 57 58 59
For Peer Review
high density orchards (5 locations; Ali et al., 2017). The soil sample was brought back in the quarantine laboratory at the Center for Biology and Management of populations (UMR CBGP, France). The species identification was first made morphologically (for the genera) and then was confirmed by esterase phenotype analysis (Ali et al., 2016). Meloidogyne javanica populations were then reared and maintained on tomato. For nematode inoculation, tomato plants (Lycopersicon esculentum Mill. cv. Roma) were prepared in 50-ml plastic corning tubes (35-mm diameter) containing a mixture of compost, sand and sodium polyacrylamide crystals.
CHARACTERIZATION OF MATERNAL LINEAGES WITH A MITOCHONDRIAL DNA SEQUENCE
We first controlled for the relatedness and lineage diversity within and among M. javanica populations. For this purpose, we collected individuals of M. javanica reared on tomatoes (Fig. 1) just after field collection as explained above. An individual second stage juvenile (J2) was isolated from fifteen egg masses per population and then conserved in 6 µL of distilled water at -20°C. DNA was then extracted from each J2 using the DNeasy Blood & Tissue kit (Qiagen Inc.). Because a small amount of living material was used, DNA extracts were poorly concentrated (< 1 ng/µL).
Considering the lack of suitable genetic markers for Meloidogyne, knowledge of their population genetic structure and colonization process remains poor. Given the asexual reproductive mode of M. javanica and its relatives (i.e. obligate parthenogenesis; Castagnone-Sereno, 2006), we expect that clonal reproduction led to no sexual recombination and an overall low genomic variation between isolates, as recently reported in a close relative (M. incognita; Koutsovoulos et al., 2020). Mitogenome (mtDNA) polymorphisms allowing distinguishing species and lineages among parthenogenetic RKNs of the M. incognita group (MIG group; Janssen et al., 2016), we developed an mtDNA marker based on a highly variable minisatellite. A non-coding region containing 63-bp tandem repeats, named 63R in M. javanica (Okimoto et
al., 1991; Besnard et al., 2014), was thus sequenced. The use of an mtDNA locus also had the
3 4 5 6 7 8 9 10 11 12 13 14 15 16 17 18 19 20 21 22 23 24 25 26 27 28 29 30 31 32 33 34 35 36 37 38 39 40 41 42 43 44 45 46 47 48 49 50 51 52 53 54 55 56 57 58 59 60
For Peer Review
advantage of an easier PCR amplification (compared to nuclear single-copy regions) due to multiple copies in the cell. Such a locus is thus a marker of choice when dealing with poorly concentrated DNA extracts. Although the mitogenome is supposedly non recombinant, heteroplasmy (i.e. mix of mtDNA variants within individuals) has however been reported in
Meloidogyne (especially in the 63R minisatellite, but not only; Okimoto et al., 1991; Besnard et al., 2019). Beforehand, such intra-individual variation needs to be carefully considered
because it may limit the usefulness of mtDNA polymorphisms for population genetics (Lunt et
al., 1998).
The 63R fragment was amplified by PCR with the following primers: 63R-For1 (TTGAAATTGCTTTATTGTTACTAAGAAG) and 63R-Rev (ACCTTAGAAATATGAAWCCTAWAGA). PCR
reaction assays were carried out in a 20-µL final volume containing 2 µL PCR buffer 10x (Qiagen), 1 µL of each primer (initial concentration at 10 µM), 12 µL of UV treated distilled water and 4 µL of genomic DNA. The thermocycler was programmed for 15 min at 95°C followed by 40 cycles of 30 s at 94°C, 1 min, 30 s at 55°C and 1 min 30 at 72°C and then 10 min at 72°C. PCR products were purified and sequenced in both directions using the same amplification primers referred above by Eurofins MWG (Germany). When necessary (i.e. fragment size > 800 bp), a third sequencing reaction was performed with an internal primer (63R-For2: GAATTCCATAAATCAGAAAATTGAGG). In total, we successfully analyzed 119
individuals from both natural (37 individuals) and agricultural locations (82 individuals; Table S1).
Sequences were manually edited with the BioEdit software (Hall, 1999). We noticed cases of heteroplasmy when a mix of distinct length or single nucleotide variants was observed in the chromatogram. In such cases (ca. 10% of isolates), the heteroplasmic pattern was carefully annotated and the most abundant sequence was considered (see results). Sequences were finally aligned in MEGA v.6 (Tamura et al., 2013). Mitotype networks were reconstructed
3 4 5 6 7 8 9 10 11 12 13 14 15 16 17 18 19 20 21 22 23 24 25 26 27 28 29 30 31 32 33 34 35 36 37 38 39 40 41 42 43 44 45 46 47 48 49 50 51 52 53 54 55 56 57 58 59
For Peer Review
with the reduced median method implemented in NETWORK v.10 (Bandelt et al., 1999) considering only single nucleotide polymorphisms (that allowed identifying 'haplogroups'). Mitotypes of two closely related species [M. arenaria (Ma; LS974734) and M. incognita (Mi; KJ476151)] were used as outgroups. Length polymorphisms due to variable number of repeats in the minisatellite (that allowed identifying 'haplotypes') were secondarily considered, but as this repeated motif shows a relatively high level of heteroplasmy, it was interpreted with caution (see results).
Population structure was analyzed using hierarchical F-statistics, estimated from variance components of gene frequencies (Weir & Cockerham, 1984). FST is a metric of population
differentiation at neutral genetic markers (Weir & Cockerham, 1984) and here was calculated between habitats (populations are nested within habitat i.e. cultivated vs. wild, and individuals are nested within population) with the package HIERFSTAT (Goudet, 2005) for the statistical
software R (R Development Core Team, 2019). For each population, we also estimated an index of mtDNA diversity as D = 1 − Σpi2, where pi is the frequency of haplogroup or haplotype i in
the population. This parameter was thus calculated for both mtDNA haplogroups (Dhaplogroups)
and haplotypes (Dhaplotypes).
EXPERIMENTAL DESIGN CONSTRUCTION
For each M. javanica population, egg masses were randomly selected from ten mothers (after molecular characterization, which was done on different individuals; Fig. 1) and put individually to hatch in distilled water in Petri dishes (5-cm diameter). This species reproduces by obligatory mitotic parthenogenesis, i.e. females reproduce without the involvement of males or sperm (Van der Beek et al., 1998). This means that all individuals coming from the same mother are expected genetically identical between them and also to their mother. Each egg mass is considered as progeny (i.e. family). Ten egg masses (i.e. ten families) were thus formed per population. From each egg mass, 50-60 infective juveniles (J2) were withdrawn by a pipette
3 4 5 6 7 8 9 10 11 12 13 14 15 16 17 18 19 20 21 22 23 24 25 26 27 28 29 30 31 32 33 34 35 36 37 38 39 40 41 42 43 44 45 46 47 48 49 50 51 52 53 54 55 56 57 58 59 60
For Peer Review
and used to inoculate a one-month-old tomato plant. The inoculum suspension was injected in several holes onto the soil surface around the stem base. The plants were maintained in a climate chamber with 12 hours light at 23°C and 12 hours dark at 20°C.
Four to six weeks after inoculation, egg masses of each family were isolated from each tomato plant (Fig. 1). Three egg masses per plant were collected representing three replicates per family. Egg masses were individually put to hatch in Petri dishes (5-cm diameter), and three individuals per egg mass were then randomly chosen for further phenotypic measurements (see below). The dishes were controlled every day in order to take individuals for morphological measurements at the same age. This was necessary to avoid a spurious relationship between the morphological variability among individuals with their stage of development. Fixing was thus done when individuals were ten-days old (after hatching). Freshly hatched second-stage juveniles (J2s) were randomly picked from each dish and placed in a drop of water. J2s were temporarily conserved in the fridge and then fixed and killed in the glycerol previously heated at 40°C (De Grisse, 1969).
TRAITS MEASUREMENTS AND ANALYSES
For the morphometric measures, three J2s per egg mass were collected and deposited in a drop of 15 μL of fixing solution on a slide with paraffin wax. The slide was then covered with a glass cover slip and then placed for a few seconds on a hot plate to ensure that the paraffin melts and then left to cool to keep the J2s trapped in the fixing solution. More than 1530 individuals were measured as described in Fig. 1. Several photos were performed on each J2. All observations were carried out under an optical microscope (Leica DMRD) attached to a camera (Leica DMF 20). Measurements were then done on photos using the LAS (Leica® Application Suite) applied software v.2.5.0 R1. On each J2, the following morphological traits were measured (Fig. 2): (i) maximum body width; (ii) width of the body at the median bulb (hereafter neck width); and
3 4 5 6 7 8 9 10 11 12 13 14 15 16 17 18 19 20 21 22 23 24 25 26 27 28 29 30 31 32 33 34 35 36 37 38 39 40 41 42 43 44 45 46 47 48 49 50 51 52 53 54 55 56 57 58 59
For Peer Review
characterization of RKNs, and an intraspecific quantitative variation has been reported (Jepson, 1987; Siddiqi, 2000; Hesar et al., 2011). The observations were made under magnification of 10× or 20× for the entire size of the individual, and under 100× for the two others characters. A Spearman test (Hall, 2015) was used to assess the correlation between the three traits.
We considered traditional and high-density orchards together as “cultivated” locations. We tested the values of traits between habitats ('Cultivated' or 'Wild') using a hierarchical analysis of variance (ANOVA) using the statistical software R (R Development Core Team, 2019). Populations were thus nested into habitat, families into population, and individuals into families. By this way, we estimated the variance components between habitats (σ²Hab), between populations within habitats (σ2
Pop), between families within populations (σ2Fam) and between
individuals within families (σ2
Ind) with the method of restricted maximum likelihood (REML;
Lynch & Walsh 1998). Individuals are thus nested within a family, which is nested within a population, which is nested within a habitat. REML estimates were obtained using the package NLME for R (Pinheiro et al., 2019). These components of variance allowed us to estimate broad-sense heritability (H²) for each phenotypic trait. H² represents the amount of the genetic part in the phenotypic variation of a given trait. Heritability scores range from 0 to 1; when H² = 1, then all variation in a population is due to differences or variation between genotypes (i.e. there is no environmentally caused variation); at the opposite, when H² = 0, all variation in the population comes from the environment experienced by individuals. Although there can be a range depending on the methodology used, heritability values less than 0.20 are usually considered low, between 0.21 and 0.40 are moderate, and above 0.40 are high (Lynch & Walsh, 1998). Broad-sense heritabilities were calculated as H² = VG / VP, with VG and VP the population
genetic and phenotypic variances, respectively (Falconer, 1989). Since individuals reproduced by parthenogenesis, offspring are considered genetically identical to their mother. Thus, genetic variation (VG) was estimated as the between-family variance (σ2Fam), and VE was estimated by 3 4 5 6 7 8 9 10 11 12 13 14 15 16 17 18 19 20 21 22 23 24 25 26 27 28 29 30 31 32 33 34 35 36 37 38 39 40 41 42 43 44 45 46 47 48 49 50 51 52 53 54 55 56 57 58 59 60
For Peer Review
the between-individuals variance (σ2
Ind). VP is the result of the genetic plus the environmental
variances. Barton & Turelli (1989) argued that common garden experiments like here can overestimate heritabilities because the environmental variance is greatly reduced. In order to investigate genetic variation without any environmental variance, Houle (1992) suggested using the coefficient of genetic variation (CVG): CVG = (σ2Fam)0.5 / m, where m is the population
phenotypic mean.
QST is the analog of FST but for quantitative trait. It measures differentiation at a
quantitative trait (Spitze, 1993; Whitlock, 2008). We thus estimated quantitative trait differentiation among habitats for each trait as the quantitative variance between habitats over the total [i.e. σ²Hab / (σ²Hab + σ2Pop + σ2Fam)].
A Mantel test was also used to evaluate if the morphological variability between populations is correlated with the geographical distance between populations. We computed this test using the library vegan (Dixon, 2003) in R.
At last, we tested a possible correlation between molecular diversity (D) and the quantitative diversity for each population (considering either σ2
Fam, H² or CVG). In particular,
we tested that a population with high molecular diversity could also show a high quantitative diversity. Correlations between diversity indexes (Dhaplogroups or Dhaplotypes) and quantitative
diversity parameters were estimated using the Pearson method (Hall, 2015) in R. However, as we tested multiple correlations for three traits, the problem of multiplicity occurs. Indeed, the more hypotheses we check, the higher the probability of finding a significant p-value by chance arises. We thus « corrected » those values by the « Bonferroni correction » in which the p-values are multiplied by the number of comparisons.
RESULTS
3 4 5 6 7 8 9 10 11 12 13 14 15 16 17 18 19 20 21 22 23 24 25 26 27 28 29 30 31 32 33 34 35 36 37 38 39 40 41 42 43 44 45 46 47 48 49 50 51 52 53 54 55 56 57 58 59For Peer Review
In this study, we collected 17 M. javanica populations in Morocco: 12 from cultivated conditions and five from natural conditions (Fig. S1). Populations belonging to the same habitat ('Cultivated' vs. 'Wild') are not significantly closer to one another than populations belonging to different habitats (Mantel test : R = 0.10 and p = 0.16). In other words, there is no correlation between the habitat type and the geographical distance.
MOLECULAR VARIATION
An mtDNA fragment (63R region) of 900 to 1400 bp was generated on 119 individuals. Sequencing revealed variation in the number of repeats in the minisatellite 63R region plus five additional single nucleotide polymorphisms (SNPs) located in regions flanking the 63R. A careful examination of these SNPs showed one case of heteroplasmy on individual '253-M6' that combined two types of sequences [referred to Mj I-7 (the most abundant; above 80%) and
Mj IV-7; Table S1]. Other accessions did not show such patterns of intra-individual polymorphisms on SNPs, indicating that these polymorphisms may be potentially informative to distinguish divergent evolutionary lineages of M. javanica. These five SNPs allowed the distinction of four mitochondrial haplogroups (Fig. 3). Haplogroup Mj III was only found at location P-285, and is relatively divergent from the others (distinguished by three or four SNPs). Individuals collected on wild and cultivated olives shared the two most frequent related
haplogroups Mj I and Mj II (> 40%; Table 1), while two minor haplogroups (< 10%) were only found in two cultivated locations (P-253 and P-285; Fig. 3). No clear distinction between isolates collected on wild and cultivated olives was thus observed based on SNPs.
When considering the number of repeats within the 63R minisatellite, a higher variation was observed (Figs S2, S3). The number of repeats varied from 7 to 14. By combining SNPs and length variation, 19 haplotypes were distinguished (Tables S1 and S2; GenBank nos: LS974735 to LS974753) but a relatively high level of heteroplasmy was also observed (13/119 isolates; Table S1). In addition, the haplotype network was mostly unresolved (Fig. S2) 3 4 5 6 7 8 9 10 11 12 13 14 15 16 17 18 19 20 21 22 23 24 25 26 27 28 29 30 31 32 33 34 35 36 37 38 39 40 41 42 43 44 45 46 47 48 49 50 51 52 53 54 55 56 57 58 59 60
For Peer Review
indicating a high level of homoplasy in the data. For these reasons, their interpretation has to be done with caution. Overall, the relatively high intra-population diversity (Fig. S3) coupled to the fact that many close locations did not share any haplotypes nevertheless suggest a complex pattern of isolation and migration between locations, but this needs to be investigated with more reliable DNA markers on a larger population sampling. Yet, isolates from wild and cultivated olives again shared numerous haplotypes indicating they do not represent old diverging evolutionary lineages.
We found no genetic structure between habitats (FST = -0.044 and-0.017, for haplogroups and haplotypes, respectively), while a relatively high structure was detected between populations within habitat (FST = 0.516 and 0.464, using haplogroups and haplotypes, respectively).
PHENOTYPIC VARIATION
The mean trait values per population are reported in Table 2, and are similar to those previously reported on M. javanica (e.g. Hesar et al., 2011). One weak correlation was found between neck and body widths (R = 0.10, p < 0.05). Individuals belonging to populations parasiting cultivated olive trees tend to be smaller. They exhibit a smaller body width, a smaller neck and a smaller stylet (Table 2). They all show a significant difference between the 'Cultivated' and 'Wild' conditions (Table 2). Between habitats, mean broad-sense heritabilities are varying across traits, ranging from 0.13 to 0.30 (Table 3). Mean CVG values between habitats are low and range from
0.01 to 0.02. Values per population are given in Table S3.
QST values were estimated between habitats for the three traits (Table 4). They range from
0.04 to 0.48, suggesting a structure in phenotypic traits between habitats, i.e. wild vs. cultivated hosts. QST values were relatively high for the neck and body widths (0.31 and 0.48,
respectively), in contrast to the size of the stylet, for which the measured QST was very low
3 4 5 6 7 8 9 10 11 12 13 14 15 16 17 18 19 20 21 22 23 24 25 26 27 28 29 30 31 32 33 34 35 36 37 38 39 40 41 42 43 44 45 46 47 48 49 50 51 52 53 54 55 56 57 58 59
For Peer Review
(0.04). No significant correlation between molecular diversity and quantitative values per population for all traits was detected (Table S3; Figs S4, S5).
Because our sample design was unbalanced (i.e. 12 and five populations respectively sampled on cultivated and wild olives), some of our comparisons could be biased. We thus chose to compare the five populations sampled on high-density cultivated olives against the five populations sampled on oleasters. The results are shown in supplementary material (Tables S4, S5, S6) and exhibit very similar results suggesting that our results based on the whole sample are reliable for molecular and quantitative data.
DISCUSSION
In this study, molecular and morphological variation was observed among isolates of a plant-parasitic nematode of the olive tree. We first checked that there is no genetic isolation between populations sampled in "Cultivated" and "Wild" habitats. After growing in controlled conditions, we found that populations collected from olive orchards are smaller (for stylet size, body and neck widths) than in oleaster stands. We then quantified the genetic basis of such phenotypic differences. A selective process was suggested by our observations despite the clonal reproductive mode of M. javanica. Our results sustain suggest an adaptive response of
this the root parasite for dealing with environmental changes between natural olive stands and orchards. 3 4 5 6 7 8 9 10 11 12 13 14 15 16 17 18 19 20 21 22 23 24 25 26 27 28 29 30 31 32 33 34 35 36 37 38 39 40 41 42 43 44 45 46 47 48 49 50 51 52 53 54 55 56 57 58 59 60
For Peer Review
ON THE M. JAVANICA ASEXUAL EVOLUTION AND POPULATION DIFFERENTIATION
While low intraspecific genetic variation has been previously reported in Meloidogyne species (Castagnone-Sereno, 2002; Castagone-Sereno et al., 2019; Besnard et al., 2019), a full nuclear genome analysis recently brought strong insights for clonal evolution in the parthenogenetic
M. incognita (Koutsovoulos et al., 2020). Yet, this species kept a high adaptive potential despite its clonal mode of reproduction, and a similar pattern may be expected in M. javanica that also belongs to the MIG group (Tigano et al., 2005). Such asexual evolution is not common in animals and may have deep consequences on adaptive responses.
In our study, we were able to distinguish four main mtDNA haplogroups in M. javanica (and a total of 19 haplotypes when considering minisatellite variation; Table S2). We thus confirm the utility of the mitogenome for distinguishing lineages among the MIG group, even at the species level (Janssen et al., 2016). Heteroplasmy was also detected (notably based on SNPs on one isolate). Such a mix of mitochondrial variants within some individuals may either result from the accumulation of mutations and maintenance of DNA polymorphisms over time, or some exchange of genetic material between individuals (possibly via horizontal gene transfers, demonstrated between distantly related species, but that could also happen between congeners; Danchin, 2011; Dunning & Christin, 2020). Whatever its origin, heteroplasmy has to be considered with caution, and we thus put more emphasize on SNPs, for which heteroplasmy was rare (< 1%). SNPs first allowed us to demonstrate that populations sampled on cultivated or wild olives are not differentiated. This means that M. javanica populations may exchange individuals between habitats. In contrast, we however showed a relatively high differentiation between populations within habitats, suggesting patterns of rapid isolation at the local scale, probably due to very stochastic events of extinction and dispersal via infected plant, soil or water [e.g. close populations 261 and 262 from the "Cultivated" habitat do not share any mitochondrial haplogroups (Fig. 3), while many haplotypes are specific to some populations
3 4 5 6 7 8 9 10 11 12 13 14 15 16 17 18 19 20 21 22 23 24 25 26 27 28 29 30 31 32 33 34 35 36 37 38 39 40 41 42 43 44 45 46 47 48 49 50 51 52 53 54 55 56 57 58 59
For Peer Review
(Fig. S3)]. Despite the supposed clonal evolution in M. javanica, an unexpected high mtDNA variation was thus observed within and among populations in both natural and cultivated habitats (Fig. 3). Distinct nematode lineages therefore co-occur within both habitats, which may maintain an evolutionary potential for adapting to variable conditions.
DIVERGING SELECTION BETWEEN HABITATS
In parallel, significant phenotypic difference was observed between habitats strongly suggesting local adaptation of M. javanica to "Cultivated" or "Wild" conditions. Here, low to moderate heritability and CVG values reveal a genetic basis to this variation. However, while
such morphological difference can be explained by selection, drift could also be responsible for this pattern. In this context, comparisons of population differentiation atquantitative traits (QST)
with population differentiation at genetic markers (FST) can provide a powerful tool (Merilä &
Crnokrak, 2001; McKay & Latta, 2002; Leinonen et al., 2008; Whitlock, 2008). Selection is expected to affect regions at or close to the quantitative trait loci underlying the phenotypic trait, while neutral processes should have equal chance to affect any genomic region. To be short, a phenotypic differentiation exceeding neutral differentiation (i.e. QST > FST) is a sign of directional selection (Merilä & Crnokrak, 2001). Here, we found no phylogenetic clustering among isolates collected in cultivated and natural conditions with a null FST value between habitats, while QST values for the weakly correlated neck and body widths were relatively high (0.31 and 0.48, respectively). This pattern (QST > FST) thus supports a selective effect on morphological divergence not due to drift alone. In contrast, we surprisingly did not detect a local adaptation signal between habitats for the size of the stylet, which is yet an important appendix for nematode nutrition. Environmental and genetic variances were however higher within the cultivated habitat than in the natural habitat. This absence of signal is possibly a consequence of a limited sampling in the wild, but another explanation could be the relaxation of selection on the stylet length due to a reduced inter-specific competition in the cultivated
3 4 5 6 7 8 9 10 11 12 13 14 15 16 17 18 19 20 21 22 23 24 25 26 27 28 29 30 31 32 33 34 35 36 37 38 39 40 41 42 43 44 45 46 47 48 49 50 51 52 53 54 55 56 57 58 59 60
For Peer Review
habitat where the nematode communities are less diverse compared to the natural habitat (Ali
et al., 2017).We should thus investigate how this trait behaves during intra- and inter-specific competition. In addition, we cannot exclude that the stylet size QST is also influenced by
non-additive components due to dominance and epistasis (Goudet & Büchi, 2006).
With its cultivation by humans, the environment of the olive has been considerably modified (via various cultural practices, including weed removal, nutrition and the use of pesticides), indirectly affecting phenotypes and community composition of microbes associated to the species (e.g. Ali et al., 2017). There is accumulating evidence on the ability of soil microbe communities to deal with such anthropogenic disturbances (e.g. Grishkan et al., 2018; Holterman et al., 2019), but this needs to be better documented to evaluate their role in the domestication process (Milla et al., 2015). A different composition of nematode communities was recently reported between cultivated and natural habitats of the olive tree in Morocco and Spain (Ali et al., 2017; Archidona-Yuste et al., 2020a). While cultivated conditions affect nematode richness and diversity, this can be due to many factors such as soil composition, cultural practices or the cultivated genotype. For instance, resistance to M. javanica has been reported in some olive genotypes (Palomares-Rius et al., 2019; Archidona-Yuste et al., 2020b), while crop intensification and grafting practices may have deep consequences on soil nematode communities (e.g. Warschefsky et al., 2016; Ali et al., 2017; Barazani et al., 2017). In the 17 locations here studied, Ali et al. (2017) showed a slightly lower phytoparasitic nematode (PPN) richness in cultivated stands than in the wild habitat (mean: 6.0 vs. 6.4 genera/dm3), while, in
contrast, the total PPN abundance increased (mean: 3977 vs. 3448 individuals/dm3)]. This trend
is in accordance with the general pattern reported in the study on 94 sites. The size reduction of M. javanica in cultivated conditions could thus be related to higher PPN density in this habitat. To deepen this hypothesis, measuring traits on several cohabiting nematode species would surely give insights on the structure and adaptive response of these communities in
3 4 5 6 7 8 9 10 11 12 13 14 15 16 17 18 19 20 21 22 23 24 25 26 27 28 29 30 31 32 33 34 35 36 37 38 39 40 41 42 43 44 45 46 47 48 49 50 51 52 53 54 55 56 57 58 59
For Peer Review
natural and cultivated habitats (e.g. displacement of characters for the coexistence of different species). We also recommend increasing the sampling and focusing on different types of orchards by controlling for a maximum of variables such as tree density, irrigation, crop genotype diversity (for both rootstocks and scions) and soil characteristics for testing their impact.
WHAT DETERMINES AN ADAPTIVE RESPONSE IN AN ASEXUAL NEMATODE?
Finally, our study highlighted an adaptive response in an asexual parasite. This could be might be unexpected since clonal reproduction should lead to limited genomic recombination. Nevertheless, genomic plasticity of RKNs should produce some diversity that is essential for their evolutionary response (Castagnone-Sereno & Danchin, 2014). This may be promoted via lateral gene transfers and large genomic rearrangements (Danchin, 2011; Koutsovoulos et al., 2020). An epigenetic response should be also investigated because this could be responsible for heritable variation in gene expression (e.g. Mirouze & Paszkowski, 2011). Such exhaustive phenotypic and genomic characterization of M. javanica populations parasiting olives may be very informative to test these hypotheses, but as shown in our study, its implementation at large scale still remains a technical challenge (i.e. both for settling controlled experiments and generating genomic data).
ACKNOWLEDGMENTS
This study was funded by the PESTOLIVE project (to E.C. and G.B.): Contribution of olive history for the management of soil-borne parasites in the Mediterranean Basin from EU and non-EU Mediterranean countries (ARIMNet action KBBE 219262). G.B is member of the EDB lab, supported by LABEX entitled TULIP and CEBA (0041; ANR-10-LABX-25-01). This work was also supported by a PhD grant from the Tishreen University (Latakia,
3 4 5 6 7 8 9 10 11 12 13 14 15 16 17 18 19 20 21 22 23 24 25 26 27 28 29 30 31 32 33 34 35 36 37 38 39 40 41 42 43 44 45 46 47 48 49 50 51 52 53 54 55 56 57 58 59 60
For Peer Review
Syrian Arabic Republic) to N.A. We also thank all people who participated to field collections or lab experiments (T. Mateille, J. Tavoillot, B. Khadari, M. Ater, M. Aït Hamza, A. El Mousadik, A. El Oualkadi, A. Moukhli, L. Essalouh, and A. El Bakkali) as well as four anonymous reviewers for their helpful comments.
REFERENCES
Abdelfattah A, Li Destri Nicosia MG, Cacciola SO, Droby S, Schena L. 2015.
Metabarcoding analysis of fungal diversity in the phyllosphere and carposphere of olive (Olea europaea). PLoS ONE 10: e0131069.
Ali N, Chapuis E, Tavoillot J, Mateille T. 2014. Plant-parasitic nematodes associated with
olive tree (Olea europaea L.) with a focus on the Mediterranean Basin: a review. Comptes
Rendus Biologies 337: 423–442.
Ali N, Tavoillot J, Chapuis E, Mateille T. 2016. Trend to explain the distribution of root-knot
nematodes Meloidogyne spp. associated with olive trees in Morocco. Agriculture,
Ecosystems & Environment 225: 22–32.
Ali N, Tavoillot J, Besnard G, Khadari B, Dmowska E, Winiszewska G, Fossati-Gaschignard O, Ater M, Aït Hamza M, El Mousadik A, El Oualkadi A, Moukhli A, Essalouh L, El Bakkali A, Chapuis E, Mateille T. 2017. How anthropogenic changes
may affect soil-borne parasite diversity? Plant-parasitic nematode communities associated with olive trees in Morocco as a case study. BMC Ecology 17: 4.
Archidona-Yuste A, Cantalapiedra-Navarrete C, Liébanas G, Rapoport HF, Castillo P, EA, Palomares-Rius JE. 2018. Diversity of root-knot nematodes of the genus
Meloidogyne Göeldi, 1892 (Nematoda: Meloidogynidae) associated with olive plants and
environmental cues regarding their distribution in southern Spain. PLoS One 13: e0198236.
Archidona-Yuste A, Cantalapiedra-Navarrete C, Palomares-Rius JE, Castillo P, Tzortzakakis EA. 2020a. Plant-parasitic nematodes associated with cultivated and wild
olive trees in Crete, Greece. Hellenic Plant Protection Journal 13: 24–28.
Archidona-Yuste A, Wiegand T, Castillo P, Navas-Cortés JA. 2020b. Spatial structure and
soil properties shape local community structure of plant-parasitic nematodes in cultivated olive trees in southern Spain. Agriculture, Ecosystems & Environment 287: 106688.
Bandelt HJ, Forster P, Röhl A. 1999. Median-joining networks for inferring intraspecific
phylogenies. Molecular Biology and Evolution 16: 37–48.
Barazani O, Waitz Y, Tugendhaft Y, Dorman M, Dag A, Hamidat M, Hijawi T, Kerem Z, Westberg E, Kadereit JW. 2017. Testing the potential significance of different
scion/rootstock genotype combinations on the ecology of old cultivated olive trees in the southeast Mediterranean area. BMC Ecology 17: 3.
Barton NH, Turelli, M. 1989. Evolutionary quantitative genetics: how little do we know?
Annual Review of Genetics 23: 337–370.
Besnard G, Jühling F, Chapuis É, Zedane L, Lhuillier E, Mateille T, Bellafiore S. 2014.
Fast assembly of the mitochondrial genome of a plant parasitic nematode (Meloidogyne
graminicola) using next generation sequencing. Comptes Rendus Biologies 337: 295–
301. 3 4 5 6 7 8 9 10 11 12 13 14 15 16 17 18 19 20 21 22 23 24 25 26 27 28 29 30 31 32 33 34 35 36 37 38 39 40 41 42 43 44 45 46 47 48 49 50 51 52 53 54 55 56 57 58 59
For Peer Review
Besnard G, Rubio de Casas R. 2016. Single vs multiple independent olive domestications:
the jury is (still) out. New Phytologist 209: 466–470.
Besnard G, Terral JF, Cornille A. 2018. On the origins and domestication of the olive: a
review and perspectives. Annals of Botany 121: 385–403.
Besnard G, Thi-Phan N, Ho-Bich H, Dereeper A, Nguyen HT, Quénéhervé P, Aribi J, Bellafiore S. 2019. On the close relatedness of two rice-parasitic root-knot nematode
species and the recent expansion of Meloidogyne graminicola in Southeast Asia. Genes
10: 175.
Braendle C, Teotonio H. 2015. Caenorhabditis nematodes as model organisms to study trait
variation and its evolution (workshop report). Worm 4: e1021109.
Cadet P, Thioulouse J. 1998. Identification of soil factors that relate to plant parasitic
nematode communities on tomato and yam in the French West Indies. Applied Soil
Ecology 8: 35–49.
Castagnone-Sereno P. 2002. Genetic variability in parthenogenetic root-knot nematodes,
Meloidogyne spp., and their ability to overcome plant resistance genes. Nematology 4:
605–608.
Castagnone-Sereno P. 2006. Genetic variability and adaptive evolution in parthenogenetic
root-knot nematodes. Heredity 96: 282–289.
Castagnone-Sereno P, Danchin EGJ. 2014. Parasitic success without sex – the nematode
experience. Journal of Evolutionary Biology 27: 1323–1333.
Castagnone‐Sereno P, Mulet K, Danchin EG, Koutsovoulos GD, Karaulic M, Da Rocha M, Bailly‐Bechet M, Pratx L, Perfus‐Barbeoch L, Abad P. 2019. Gene copy number
variations as signatures of adaptive evolution in the parthenogenetic, plant‐parasitic nematode Meloidogyne incognita. Molecular Ecology 28: 2559–2572.
Cook LM. 2018. Records of industrial melanism in British moths. Biological Journal of the
Linnean Society 125: 862–866.
da Silva EH, da Silva MV, Furlaneto C, Giband M, Barroso PAV, Moita AW, Jorge-Junior AM, Correa VR, Castagnone-Sereno P, Carneiro RMDG. 2014. Genetic
variability and virulence of Meloidogyne incognita populations from Brazil to resistant cotton genotypes. European Journal of Plant Pathology 139: 195–204.
Danchin ÉGJ. 2011. What nematode genomes tell us about the importance of horizontal gene
transfers in the evolutionary history of animals. Mobile Genetic Elements 1: 269–273.
De Grisse AT. 1969. Redescription ou modifications de quelques techniques utilisées dans
l’étude des nématodes phytoparasites. Medelingen Rijksfakulteit Landbouwwetenschappen Gent 34: 351–369.
Dίez CM, Trujillo I, Martinez-Uriroz N, Barranco D, Rallo L, Marfil P, Gaut BS. 2015.
Olive domestication and diversification in the Mediterranean basin. New Phytologist 206: 436–447.
Dixon P. 2003. VEGAN, a package of R functions for community ecology. Journal of
Vegetation Science 14: 927–930.
Dunning, LT, Christin PA. 2020. Reticulate evolution, lateral gene transfer, and innovation
in plants. American Journal of Botany 107: 1–4.
Eisenback JD, Triantaphyllou HH. 1991. Root-knot nematodes: Meloidogyne species and
races. Manual of Agricultural Nematology 1: 191–274.
Fabian D, Flatt T. 2012. Life history evolution. Nature Education Knowledge 3: 24.
Falconer DS. 1989. Introduction to Quantitative Genetics. Mill B (ed.), Third edition,
Longman Scientific & Technical, New York, Wiley.
Gladieux P, Zhang XG, Róldan-Ruiz I, Caffier V, Leroy T, Devaux M, Van Glabeke S, Coart E, Le Cam B. 2010. Evolution of the population structure of Venturia inaequalis,
3 4 5 6 7 8 9 10 11 12 13 14 15 16 17 18 19 20 21 22 23 24 25 26 27 28 29 30 31 32 33 34 35 36 37 38 39 40 41 42 43 44 45 46 47 48 49 50 51 52 53 54 55 56 57 58 59 60
For Peer Review
the apple scab fungus, associated with the domestication of its host. Molecular Ecology
19: 658–674.
Goudet J. 2005. Hierfstat, a package for R to compute and test hierarchical F-statistics.
Molecular Ecology Notes 5: 184–186.
Goudet J, Büchi L. 2006. The effects of dominance, regular inbreeding and sampling design
on QST an estimator of population differentiation for quantitative traits. Genetics 172:
1337–1347.
Grishkan I, Wakamatsu K, Perl T, Li K, Nevo E. 2018. Adaptive response of a soil fungus,
Aspergillus niger, to changed environmental conditions in a soil transplant experiment at
‘Evolution Canyon’ I, Mount Carmel, Israel. Biological Journal of the Linnean Society
125: 821–826.
Hall J. 2015. Pearson’s correlation coefficient. Available online: http://www.hep.ph.ic.ac.uk/~hallg/UG_2015/Pearsons.pdf
Hall TA. 1999. BioEdit: a user-friendly biological sequence alignment editor and analysis
program for Windows 95/98/NT. Nucleic Acids Symposium Series 41: 95–98.
Hesar AM, Mogadam EM, Maafi ZT. 2011. Morphometrical and genetic diversity of
Meloidogyne javanica isolates from the North East of Iran. Journal of Nematode Morphology and Systematics 14: 1–11.
Holterman M, Schratzberger M, Helder J. 2019. Nematodes as evolutionary commuters
between marine, freshwater and terrestrial habitats. Biological Journal of the Linnean
Society 128: 756–767.
Houle D. 1992. Comparing evolvability and variability of quantitative traits. Genetics 130:
195–204.
Janssen T, Karssen G, Verhaeven M, Coyne D, Bert W. 2016. Mitochondrial coding genome
analysis of tropical root-knot nematodes (Meloidogyne) supports haplotype based diagnostics and reveals evidence of recent reticulate evolution. Scientific Reports 6: 22591.
Jepson SB. 1987. Identification of root-knot nematodes (Meloidogyne species). First edition,
Wallingford, UK: CAB International.
Kaniewski D, Van Campo E, Boiy T, Terral JF, Khadari B, Besnard G. 2012. Primary
domestication and early uses of the emblematic olive tree: palaeobotanical, historical and molecular evidences from the Middle East. Biological Reviews 87: 885–899.
Khadari B., Charafi J., Moukhli A., Ater M. 2008. Substantial genetic diversity in cultivated
Moroccan olive despite a single major cultivar: a paradoxical situation evidenced by the use of SSR loci. Tree Genetics & Genomes 4: 213–221.
Koutsovoulos GD, Marques E, Arguel MJ, Duret L, Machado ACZ, Carneiro RMDG, Kozlowski DK, Bailly-Bechet M, Castagnone-Sereno P, Albuquerque EVS, Danchin EGJ. 2020. Population genomics supports clonal reproduction and multiple gains and
losses of parasitic abilities in the most devastating nematode pest. Evolutionary
Applications 13: 442–457.
Lamberti F, Lownsbery BF. 1968. Olive varieties differ in reaction to the root-knot nematode
Meloidogyne javanica (Treub) Chitw. Phytopathologia Mediterranea 7: 48–50.
Lamberti F, Baines RC. 1969. Pathogenicity of four species of Meloidogyne on three varieties
of olive trees. Journal of Nematology 1: 111–115.
Leinonen T, O’Hara RB, Cano JM, Merilä J. 2008. Comparative studies of quantitative trait
and neutral marker divergence: a meta‐analysis. Journal of Evolutionary Biology 21: 1– 17.
Lunt DH, Whipple LE, Hyman BC. 1998. Mitochondrial DNA variable number tandem repeats (VNTRs): utility and problems in molecular ecology. Molecular Ecology 7: 1441–1455. 3 4 5 6 7 8 9 10 11 12 13 14 15 16 17 18 19 20 21 22 23 24 25 26 27 28 29 30 31 32 33 34 35 36 37 38 39 40 41 42 43 44 45 46 47 48 49 50 51 52 53 54 55 56 57 58 59
For Peer Review
Lynch M, Walsh B. 1998. Genetics and analysis of quantitative traits. Sinauer Associates Inc.,
Sunderland, Massachusetts, 980 pages.
McKay JM, Latta RG. 2002. Adaptive population divergence: markers, QTL and traits.
Trends in Ecology and Evolution 17: 285–291.
Medina IL, Gomes CB, Correa VR, Mattos VS, Castagnone-Sereno P, Carneiro RMDG. 2017. Genetic diversity of Meloidogyne spp. parasitising potato in Brazil and
aggressiveness of M. javanica populations on susceptible cultivars. Nematology 19: 69– 80.
Merilä J, Crnokrak P. 2001. Comparison of genetic differentiation at marker loci and
quantitative traits. Journal of Evolutionary Biology 14: 892–903.
Meyer R, Purugganan M. 2013. Evolution of crop species: genetics of domestication and
diversification. Nature Reviews Genetics 14: 840–852.
Milla R, Osborne CP, Turcotte MM, Violle C. 2015. Plant domestication through an
ecological lens. Trends in Ecology and Evolution 30: 463–469.
Mirouze M, Paszkowski J. 2011. Epigenetic contribution to stress adaptation in plants.
Current Opinion in Plant Biology 14: 267–274.
Moens M, Perry RN, Starr JL. 2009. Meloidogyne species a diverse group of novel and
important plant parasites. In: Perry RN, Moens M & Starr JL (eds), Root-Knot
Nematodes. CABI, London, pp. 1–17.
Montes-Borrego M, Metsis M, Landa BB. 2014. Arbuscular mycorhizal fungi associated
with the olive crop across the Andalusian landscape: factors driving community differentiation. PLoS ONE 9: e96397.
Netscher C. 1978. Morphological and physiological variability of species of Meloidogyne in
West Africa and implications for their control. In: Veenman H & Zonen BV (eds),
Mededelingen Landbouwhogeschool Wageningen 78-3. Wageningen, The Netherlands,
46 pages.
Nico AI, Rapoport HF, Jimenez-Dıaz RM, Castillo P. 2002. Incidence and population
density of plant-parasitic nematodes associated with olive planting stocks at nurseries in southern Spain. Plant Disease 86: 1075–1079.
Okimoto R, Chamberlin HM, Macfarlane JL, Wolstenholme DR. 1991. Repeated sequence
sets in mitochondrial DNA molecules of root knot nematodes (Meloidogyne): nucleotide sequences, genome location and potential for host-race identification. Nucleic Acids
Research 19: 1619–1626.
Palomares-Rius JE, Castillo P, Montes-Borrego M, Müller H, Landa BB. 2012. Nematode
community populations in the rhizosphere of cultivated olive differs according to the plant genotype. Soil Biology and Biochemistry 45: 168–171.
Palomares-Rius JE, Castillo P, Montes-Borrego M, Navas-Cortés JA, Landa BB. 2015. Soil properties and olive cultivar determine the structure and diversity of
plant-parasitic nematode communities infesting olive orchards soils in southern Spain. PLoS
ONE 10: e0116890.
Palomares-Rius JE, Belaj A, León L, de la Rosa R, Rapoport HF, Castillo P. 2019. Evaluation of the phytopathological reaction of wild and cultivated olives as a
means of finding promising new sources of genetic diversity for resistance to root-knot nematodes. Plant Disease 103: 2559–2568.
Pinheiro J, Bates D, DebRoy S, Sarkar D, R Core Team. 2019. nlme: Linear and Nonlinear
Mixed Effects Models. R package version 3.1-143, https://CRAN.R-project.org/package=nlme.
Plantard O, Porte C. 2004. Population genetic structure of the sugar beet cyst nematode
Heterodera schachtii: A gonochoristic and amphimictic species with highly inbred but
weakly differentiated populations. Molecular Ecology 13: 33–41.
3 4 5 6 7 8 9 10 11 12 13 14 15 16 17 18 19 20 21 22 23 24 25 26 27 28 29 30 31 32 33 34 35 36 37 38 39 40 41 42 43 44 45 46 47 48 49 50 51 52 53 54 55 56 57 58 59 60
For Peer Review
R Development Core Team. 2019. R: A language and environment for statistical computing.
R Foundation for Statistical Computing, Vienna, Austria. ISBN 3-900051-07-0, URL:
http://www.R-project.org.
Ringot G, Gasparini J, Wagner M, Albassatneh MC, Frantz A. 2018. More and smaller
resting eggs along a gradient for pollution by metals: dispersal, dormancy and detoxification strategies in Daphnia? Biological Journal of the Linnean Society 124: 11– 20.
Sasanelli N, Fontanazza G, Lamberti F, D’Addabbo T, Patumi M, Vergari G. 1997.
Reaction of olive cultivars to Meloidogyne species. Nematologia Mediterranea 25: 183– 190.
Sasanelli N, D’Addabbo T, Lemos RM. 2002. Influence of Meloidogyne javanica on growth of olive cuttings in pots. Nematropica32: 59–64.
Siddiqi MR. 2000. Tylenchida: Parasites of Plants and Insects. Second edition, CABI
Publishing, Wallingford, UK, 813 pages.
Spitze K. 1993. Population structure in Daphnia obtusa: quantitative genetic and allozymic
variation. Genetics 135: 367–374.
Stukenbrock EH, Banke S, Javan-Nikkhah M, McDonald BA. 2007. Origin and
domestication of the fungal wheat pathogen Mycosphaerella graminicola via sympatric speciation. Molecular Biology and Evolution 24: 398–411.
Tamura K, Stecher G, Peterson D, Filipski A, Kumar S. 2013. MEGA6: molecular
evolutionary genetics analysis version 6.0. Molecular Biology and Evolution 30: 2725– 2729.
Tatu-Nyaku S, Luluf H, Cornelius E. 2018. Morphometric characterisation of root-knot
nematode populations from three regions in Ghana. The Plant Pathology Journal 34: 544–554
Tigano MS, Carneiro RMDG, Jeyaprakash A, Dickson DW, Adams BJ. 2005. Phylogeny
of Meloidogyne spp. based on 18S rDNA and the intergenic region of mitochondrial DNA sequences. Nematology 7: 851–862.
Van der Beek JG, Loss JA, Pijnacker LP. 1998. Cytology of parthenogenesis of five
Meloidogyne species. Fundamental and Applied Nematology 21: 393–399.
Warschefsky EJ, Klein LL, Frank MH, Chitwood DH, Londo JP, von Wettberg EJB, Miller AJ. 2016. Rootstocks: diversity, domestication, and impacts on shoot phenotypes.
Trends in Plant Science 21: 418–437.
Weir BS, Cockerham CC. 1984. Estimating F-statistics, for the analysis of population
structure. Evolution 38: 1358–1370.
Whitlock MC. 2008. Evolutionary inference from QST. Molecular Ecology 17: 1885–1896.
SUPPORTINGINFORMATION
Additional supporting Information may be found on the online version of this article at the publisher's website:
Table S1. List of the 119 isolates characterized with the 63R region.
Table S2. Mitotype occurrence in individuals isolated from cultivated and wild olives.
Table S3. Quantitative components of variance for three phenotypic traits.
3 4 5 6 7 8 9 10 11 12 13 14 15 16 17 18 19 20 21 22 23 24 25 26 27 28 29 30 31 32 33 34 35 36 37 38 39 40 41 42 43 44 45 46 47 48 49 50 51 52 53 54 55 56 57 58 59
For Peer Review
Table S4. FST values among habitats and between populations of Meloidogyne javanica when
considering only high-density cultivated and wild olive populations.
Table S5. Effect of habitat, population, and family on three life-history traits of
Meloidogyne javanica sampled in high-density cultivated or wild olive stands.
Table S6. REML variance components for three quantitative traits measured on
Meloidogyne javanica populations sampled in high-density cultivated and wild olive habitats.
Figure S1. Distribution of Meloidogyne javanica populations sampled in Morocco.
Figure S2. Mitochondrial haplotype reduced-median network.
Figure S3. Geographic distribution of mitochondrial haplotypes of Meloidogyne javanica in
wild and cultivated olive habitats in Morocco.
Figure S4. Correlation plot between haplogroup diversity and quantitative phenotypic diversity
calculated for the stylet size, neck width and body width.
Figure S5. Correlation plot between haplotype diversity and quantitative phenotypic diversity
calculated for the stylet size, neck width and body width.
3 4 5 6 7 8 9 10 11 12 13 14 15 16 17 18 19 20 21 22 23 24 25 26 27 28 29 30 31 32 33 34 35 36 37 38 39 40 41 42 43 44 45 46 47 48 49 50 51 52 53 54 55 56 57 58 59 60
For Peer Review
Table 1. Mitochondrial haplogroup frequency in individuals isolated from cultivated and wild
olives. Mitochondrial haplogroups were defined based on five SNPs (Fig. 3).
Mitotype Cultivated Wild
Mj I 45.1% 58.3% Mj II 43.9% 41.7% Mj III 8.6% -Mj IV 2.5% -3 4 5 6 7 8 9 10 11 12 13 14 15 16 17 18 19 20 21 22 23 24 25 26 27 28 29 30 31 32 33 34 35 36 37 38 39 40 41 42 43 44 45 46 47 48 49 50 51 52 53 54 55 56 57 58 59
For Peer Review
Table 2. Mean values of three life-history traits (measured in μm) studied on
Meloidogyne javanica individuals from Cultivated (C) and Wild (W) olive stands (definition in
text; locations given in Fig. S1). Standard deviation of each value is given in parentheses. The effects of habitat (Cultivated or Wild), population, and family (nested within population) were tested by hierarchical ANOVA. p-values are considered significant when inferior to 0.05, and coded as follow: *** for p < 0.001, ** for p < 0.01, * for p < 0.05.
Trait C W Habitat Population Family
Stylet size 12.85 (0.61) 13.05 (0.52) *** *** * Neck width 11.67 (0.38) 11.86 (0.33) *** *** *** Body width 13.08 (0.71) 13.51 (0.61) *** * *** 3 4 5 6 7 8 9 10 11 12 13 14 15 16 17 18 19 20 21 22 23 24 25 26 27 28 29 30 31 32 33 34 35 36 37 38 39 40 41 42 43 44 45 46 47 48 49 50 51 52 53 54 55 56 57 58 59 60
For Peer Review
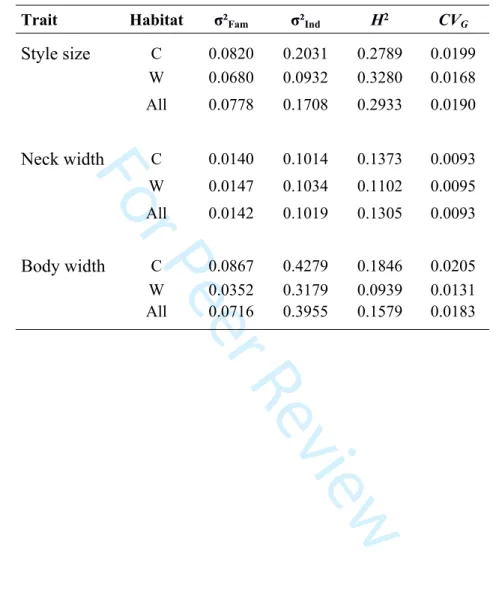
Table 3. Quantitative components of variance for three phenotypic traits (stylet size, neck width
and body width). These parameters (σ²Fam, σ²Ind, H2, CV
G) were estimated per population and
then used for calculating means by habitat (C = Cultivated; W = Wild) and on all samples (All).
Trait Habitat σ²Fam σ²Ind H2 CVG
Style size C 0.0820 0.2031 0.2789 0.0199 W 0.0680 0.0932 0.3280 0.0168 All 0.0778 0.1708 0.2933 0.0190 Neck width C 0.0140 0.1014 0.1373 0.0093 W 0.0147 0.1034 0.1102 0.0095 All 0.0142 0.1019 0.1305 0.0093 Body width C 0.0867 0.4279 0.1846 0.0205 W 0.0352 0.3179 0.0939 0.0131 All 0.0716 0.3955 0.1579 0.0183 3 4 5 6 7 8 9 10 11 12 13 14 15 16 17 18 19 20 21 22 23 24 25 26 27 28 29 30 31 32 33 34 35 36 37 38 39 40 41 42 43 44 45 46 47 48 49 50 51 52 53 54 55 56 57 58 59
For Peer Review
Table 4. REML variance component for quantitative traits between habitats. For each trait, we
report the variance between habitats (σ²Hab), between populations within habitat (σ²Pop), between families within populations (σ²Fam) and between individuals within families (σ²Ind). We also assessed the quantitative differentiation between habitats (QST) of each trait (details in text).
Trait σ²Hab σ²Pop σ²Fam σ²Ind QST
Stylet size 0.008 0.110 0.080 0.171 0.040 Neck width 0.014 0.019 0.014 0.103 0.310 Body width 0.085 0.012 0.085 0.379 0.479 3 4 5 6 7 8 9 10 11 12 13 14 15 16 17 18 19 20 21 22 23 24 25 26 27 28 29 30 31 32 33 34 35 36 37 38 39 40 41 42 43 44 45 46 47 48 49 50 51 52 53 54 55 56 57 58 59 60
For Peer Review
LEGENDS OF FIGURES
Figure 1. Experimental design for molecular characterization and trait measurements of
M. javanica populations. For each population, fifteen egg masses (one individual per egg mass)
were randomly chosen for molecular measures, while ten egg masses were collected (families), and reared on tomatoes for the morphological measures. Then, for each family in every population, three individuals per egg-mass were randomly sampled and measured after photography (details on traits in the text). As we worked on 17 populations, ten families per population and nine individuals (on average) per family, 1530 nematodes were measured for three traits.
Figure 2. Photography of a nematode (under microscope; 100×) indicating the three traits
measured and their morphological significance.
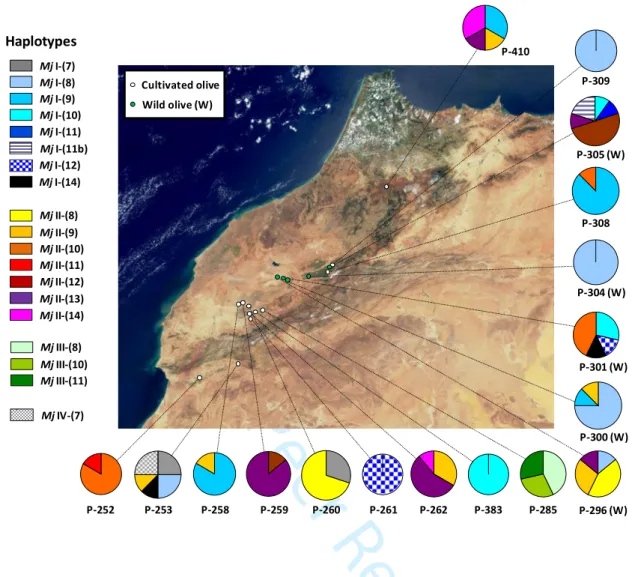
Figure 3. Mitochondrial DNA variation among Meloidogyne javanica isolates sampled on wild
and cultivated olives in Morocco. Mitochondrial haplogroups were defined based on five single nucleotide polymorphisms (SNPs) in regions flanking the 63R minisatellite. a) Mitochondrial haplogroup reduced-median network (Bandelt et al., 1999). Mitotypes of two closely related species [M. arenaria (Ma; LS974734) and M. incognita (Mi; KJ476151)] were used as outgroups (small black circles). Four haplogroups were distinguished among M. javanica isolates collected on cultivated olives, with the most two frequent ones (Mj I and Mj II) also observed on wild olive isolates (W). Size of pie charts is proportional to the relative frequency of each mitotype. b) Geographic distribution of haplogroups among the 17 provenances (between five and ten isolates were analyzed per location). Size of pie charts is proportional to the number of isolates analyzed per location. For mtDNA haplotypes defined on both SNPs and minisatellite length variation, see Figs S2 and S3.
3 4 5 6 7 8 9 10 11 12 13 14 15 16 17 18 19 20 21 22 23 24 25 26 27 28 29 30 31 32 33 34 35 36 37 38 39 40 41 42 43 44 45 46 47 48 49 50 51 52 53 54 55 56 57 58 59
For Peer Review
Mother population (Pop) 10 egg masses / Pop for morphological characterization Inoculation on 10 tomatoes C A B 3 egg masses / Family 3 J2s 3 J2s 3 J2s DeGrisse Fixation Families (M1 -> M10) Mounting on slides Photographie s Traits measures15 egg masses / Pop for molecular characterization
Biological Journal of the Linnean Society
3 4 5 6 7 8 9 10 11 12 13 14 15 16 17 18 19 20 21 22 23 24 25 26 27 28 29 30 31 32 33 34 35 36 37 38 39 40 41 42 43 44 45 46 47 48 49 50 51 52 53 54 55 56
For Peer Review
10
µm
Maximum body width Stylet size
Body width at the median bulb (‘neck width’)
Biological Journal of the Linnean Society
3 4 5 6 7 8 9 10 11 12 13 14 15 16 17 18 19 20 21 22 23 24 25 26 27 28 29 30 31 32 33 34 35 36 37 38 39 40 41 42 43 44 45 46 47 48 49 50 51 52 53 54 55
For Peer Review
Figure 3. Mitochondrial DNA variation among Meloidogyne javanica isolates sampled on wild and cultivated olives in Morocco. 254x190mm (96 x 96 DPI) 3 4 5 6 7 8 9 10 11 12 13 14 15 16 17 18 19 20 21 22 23 24 25 26 27 28 29 30 31 32 33 34 35 36 37 38 39 40 41 42 43 44 45 46 47 48 49 50 51 52 53 54 55 56