Carbon Dioxide Flash-Freezing Applied to Ice Cream Production by
Teresa Susan Baker B.S. Mechanical Engineering
B.S. Earth, Atmospheric, and Planetary Sciences Massachusetts Institute of Technology, 2003
SUBMITTED TO THE DEPARTMENT OF MECHANICAL ENGINEERING IN PARTIAL FULLFILLMENT OF THE REQUIREMENTS FOR THE DEGREE OF
MASTER OF SCIENCE IN MECHANICAL ENGINEERING AT THE
MASSACHUSETTS INSTITUTE OF TECHNOLOGY FEBRUARY 2006
© 2006 Massachusetts Institute of Technology. All rights reserved.
Signature of Author:
Department of Mechanical Engineering January 20, 2006 Certified by:_
John G. Brisson II Assqviate Professor of Mechanical Engineering Thesis Supervisor Accepted by:
Lallit Anand Chairman, Department Committee on Graduate Students
MASSACHUSES RfNSTVUT OF TECHNOLOGY
LRAE
LIBRARIES
Carbon Dioxide Flash-Freezing Applied to Ice Cream Production by
Teresa Susan Baker
Submitted to the Department of Mechanical Engineering on January 20, 2006 in Partial Fulfillment of the Requirements for the Degree of Master of Science in
Mechanical Engineering
ABSTRACT
Ice cream mix and other liquids are frozen by direct contact with carbon dioxide while carbon dioxide is throttled from a liquid phase to a saturated vapor phase. The process is demonstrated with a proof-of-principle apparatus that freezes discrete batches of mix. The fluid consumption, power consumption and space requirement of a continuous cycle implementation are modeled. In the proof-of-principle apparatus and the continuous cycle model, the ice cream mix is sprayed into the liquid carbon dioxide using 1.0 GPH Delavan fuel nozzles; the combined fluid is throttled by 2.0 GPH Delavan fuel nozzles, forming a fine mist during flash-freezing. The pressure at the outlet of the throttle determines the temperature of the saturated carbon dioxide vapor after the flashing process. The resulting product is a frozen carbonated ice cream powder. Depending on the implementation, 50-99% of the carbon dioxide flow is vented and can be compressed and recycled with additional make-up carbon dioxide flow.
The required ratio of carbon dioxide to ice cream mix is found by balancing the change in enthalpy of each liquid from the inlet to the outlet state. For ice cream mix frozen from 5*C to -20*C, the ratio is shown to be about 1.1. Carbon dioxide is recompressed from 1.97 x 10⁶ Pa (285 psi) to 3.96 x 10⁶ Pa (575 psi). The process is scaled by increasing the number of nozzles to accommodate the desired flow rate. Only 165 nozzles are required to flash freeze the ice cream mix at a 2000 L/hr ice cream production rate. The power consumption of a continuous cycle implementation is modeled including single or double stage carbon dioxide recovery and compression, pre-cooling of the carbon dioxide by a standard condensing unit, pumping of the ice cream mix at high pressure and extrusion of the ice cream powder by a piston or screw extruder. The power consumption of an implementation recovering 95% of the carbon dioxide is approximately 37.3% of the power consumption of a conventional process. The cost of the make-up carbon dioxide is $0.002 per liter of ice cream. A cart implementation is also possible.
Thesis Supervisor: John G Brisson II
Table of Contents
A BSTRA CT... 3
Table of Contents... 5
List of Figures ... 7
List of Tables ... 7
List of Sym bols ... 8
List of Subscripts ... 8
CH APTER 1 - IN TRODU CTION ... 9
1.1 Flash-Freezing Process ... 9
CH APTER 2 - BA CK GROUN D ... 11
2.1 Ice C ream ... 11
2.2 Ice Cream Quality... 12
2.3 Conventional Ice Cream Freezing Process ... 13
2.4 Industry Interests... 14
CH A PTER 3 - TH EORY ... 16
3.1 D esign Param eters ... 16
3.2 Carbon D ioxide-M ix M ass Flow Ratio... 17
3.3 Pre-cooling Refrigeration R ... 19
3.4 Pow er Consum ption... 21
3.4.1 Com pressor Pow er Consum ption ... 21
3.4.2 Condensing U nit Pow er Consum ption... 23
3.4.3 Ice Cream Pump and Extruder Power Consumption... 24
3.4.4 Sample Power Consumption of Four Components... 27
3.4.5 Screw Extrusion... 27
3.5 Clathrate Hydrates ... 30
3.6 Emulsion ... 31
CHAPTER 4 - PROOF OF PRINCIPLE APPARATUS... 33
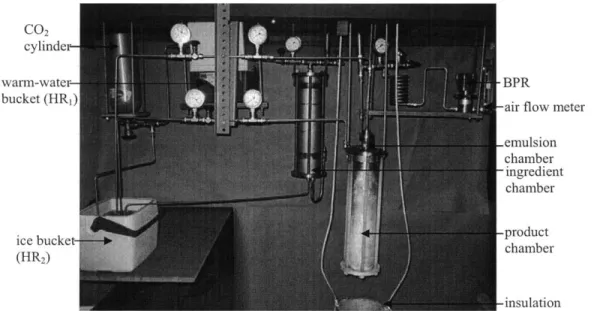
4.1 O verview of Apparatus... 33
4.2 N ozzles... 36
4.2.1 Types... 36
4.2.2 Flow rates... 36
4.2.3 Cleaning ... 41
4.3 Tests w ith W ater ... 41
4.4 Tests w ith Ice Cream M ix... 43
4.5 Carbon D ioxide Flow Observations... 44
4.6 Expansion to A tm ospheric Pressure ... 46
4.7 Product D etails... 47
4.8 Effect of Ingredients ... 48
CH APTER 5 - D ISCU SSION ... 50
5.1 Com parison to Conventional Process ... 50
5.1.1 Equipm ent and Expenses ... 50
5.1.2 Pow er ... 52
5.1.3 Pre-Cooling A lternatives ... 53
5.2 Food Grade D esign ... 54
5.3.1 Example Cart Sizing ... 57
5.4 Comments on Home Implementation ... 59
CHAPTER 6 - CONCLUSION...61
A cknow ledgem ents... 61
R EFER EN C ES ... 62
Appendix A Milkfat and NMS Properties of Common Ingredients for Mix Calculation 65 Appendix B Relevant Fluid Properties ... 65
Appendix C Ice Cream and Ice Cream Mix Properties ... 65
List of Figures
1-1 Novel freezing process, basic implementation 2-1 Ice cream structure schematic
2-2 Continuous freezer assembly 2-3 Ice cream plant hardening tunnel 3-1 Flow diagram with power inputs
3-2 CO2 P-h diagram with cycle for main compressor
3-2 Piston extruder geometry 3-3 Screw extruder geometry
3-4 Carbon dioxide-water phase diagram 4-la Proof-of-principle apparatus
4-lb Schematic of proof-of-principle apparatus 4-2a Water flow rate, 1.0 GPH nozzle
4-2b Carbon dioxide flow rate, 2.0 GPH nozzle
4-3 Overrun, product vessel fill time and CO2 vent flow rate vs. ice cream mix fat content 4-4 Sample atmospheric expansion set-ups
5-1 Nozzle packing
5-2 CO2 P-h diagram with main compressor cycle assuming no condensing unit
5-3 Flow diagram for cart implementation List of Tables
3.1 Design parameters for three exit states.
3.2 Energy consumed per kilogram ice cream mix. 3.3 Screw extruder geometry and power consumption. 4.1 Nozzle flow rate calibration
List of Subscripts A-area
b-distance between flights (for screw extruder)
D-barrel diameter (for screw extruder) e-flight wall thickness (for screw extruder)
F-volume flow rate f-frequency
h-specific enthalpy (except in screw extruder geometry)
L-length
ih -mass flow rate
N-rotation rate of screw extruder n-number of nozzles
O-overrun P-pressure
Q-heat
Q-volume
flow rate (for screw extruder) R-ratio of carbon dioxide and water or mix mass flow ratesR-radius of hexagonal nozzle arrangement
r-number of hexagonal rings T-temperature
U-velocity V-volume
V -volume flow rate
w-volume fraction in flow (except in screw extruder geometry)
x-distance piston has traveled
s-clearance between flight and barrel wall (for screw extruder)
y-percent of carbon dioxide flow recycled
p-viscosity
ri-compressor efficiency p-density
p-helix angle (for screw extruder)
C0 2-carbon dioxide
CO2, makep-carbon dioxide supplied from
reservoir, not recycled
CO2, i-carbon dioxide liquid entering emulsion chamber
H20-water NH3-ammonia
0-initial (i.e. density of powder)
a,b-used to differentiate measurement at different conditions
atm-at atmospheric condition c-cross-sectional
comp-compression, compressor container-container holding ice cream exit-value for CO2 established in the product chamber
f-final i-initial
icm-ice cream mix in-before pre-cooling 1-liquid
main-compression of CO2 from Psat,v to PCO2,1
max-maximum density of solid particulates
new- value for combined fluid partial-mixed liquid and vapor phase pc-pre-cooling
pg-pressurizing gas
piston-piston extruder for ice cream powder
pump-ice cream mix pump rev-reversible
s-solid
sat-saturated state
sat,v-condition at product chamber exit
stage 1-compression of CO2 from
atmospheric pressure to Pat,v stroke-portion of piston cycle in one direction
tot-value for combined fluid (emulsion) total-ice cream and container
v-vapor
CHAPTER 1 - INTRODUCTION
A new process for freezing ice cream and similar desserts has been developed. Liquid carbon dioxide is used as a direct refrigerant to freeze ice cream mix as these
emulsified fluids are throttled through a nozzle to form a fine mist. This chapter describes the flash-freezing process. In Chapter 2 basic information about ice cream, conventional freezing and factors important to ice cream quality are presented. Chapter 3 discusses the design parameters for implementing the process. This includes the
thermodynamics of the fluid interaction and additional refrigeration and processing required. Chapter 3 includes consideration of continuous, large scale implementations of the process and cart implementation without carbon dioxide recovery. Chapter 4 presents the proof-of-principle apparatus that was developed to test the flash-freezing concept. In Chapter 5 a comparison of the novel and conventional freezing processes is presented, with consideration of food grade equipment requirements. Preliminary sizing of a cart implementation and a home implementation are discussed. Chapter 6 identifies aspects of the process that should be studied in further work.
1.1 Flash-Freezing Process
For the flash-freezing process, ice cream mix and liquid carbon dioxide are pre-cooled to near the freezing temperature of water. The carbon dioxide is maintained above its 5'C saturation pressure, 3.97 x 10⁶ Pa (576 psi). Figure 1-1 shows a basic implementation of the process. The ice cream mix is sprayed as a fine mist into the liquid carbon dioxide, creating a temporary emulsion of the fluids. This emulsion is sprayed through a second nozzle into a product chamber at the saturation conditions of carbon dioxide at -20*C. The carbon dioxide vaporizes upon entering the lower pressure chamber. The ice cream mix is flash-frozen, rapidly losing enthalpy because it is in intimate contact with the carbon dioxide. The ice cream micro-crystals fall to the bottom of the chamber, trapping some carbon dioxide. The remaining vaporized carbon dioxide escapes through an exhaust vent.
In a continuous implementation, the vented carbon dioxide is filtered and
recompressed as shown in Figure 1-1. This carbon dioxide is supplemented by additional make-up carbon dioxide and re-used in a partially closed cycle. The ice cream micro-crystals are extracted from the chamber through a pressure lock and compressed to the desired gas volume fraction.
0ce Cream1
En-dson cnmbr
Figure 1-1 Novel freezing process, basic implementation. PR-pressure regulator,
V-valve, Q-heat transfer
The use of carbon dioxide in food and even in dairy products is not new. Carbon dioxide is generally regarded as safe (GRAS) and is commonly found in beverages such
as soda pop, champagne and beer. In addition, carbon dioxide is commonly added to
dairy foods to extend the shelf life of the food (Hotchkiss, 1996). Carbon dioxide is a natural antimicrobial agent present in raw milk. Carbon dioxide is also more soluble in water than oxygen, so it replaces oxygen and may limit rancidity which is caused by oxidation. With the addition of carbon dioxide, the shelf life of ice cream mix can be increased from 18 days to 60 days (Hotchkiss, 1996). Studies of ice cream produced with a gas such as nitrogen or carbon dioxide replacing air found some reduction in oxidation, particularly for mixes with milkfat substitutes such as canola and soybean oil (Marshall, 2003).
Industrial carbon dioxide for beverage service is available through most gas distributors. Other cryogenic gases are not practical for this process because either the critical point is much lower than the desired temperature of ice cream (i.e. Nitrogen), the gas is not consumable (i.e. Ammonia), or the gas is prohibitively expensive (i.e.
CHAPTER 2 - BACKGROUND
2.1 Ice Cream
Ice cream is made from a mixture of dairy ingredients, sweeteners and flavoring. In commercial processing the mix also includes emulsifiers and stabilizers to improve the whipping properties of the mix and the body of the product. Air is incorporated into the ice cream during the freezing process.
Various related frozen desserts are available on the market and many are standardized by federal regulations. In the United States, for a product to be called ice cream it must be at least 10% milkfat by weight. Sweeteners are generally 12-16% of the composition by weight. Custards or French ice cream must additionally be 1.4% egg yolk solids. Sherbets have 1-2% milkfat content, and sorbet and ices are generally defined as containing no dairy ingredients. Regulations vary from country to country.
Ice cream is an emulsion of milkfat in a solution of water, ice crystals, milk proteins, and carbohydrates. Approximately 85% of the water content is frozen at -20'C (Marshall, 2003). The remaining water is a highly concentrated solution of sugars. As the water freezes out of solution the freezing temperature of the solution progressively lowers. Figure 2-1 shows a schematic of the texture of ice cream. The milkfat exists in tiny globules that are formed by the homogenizer before the mix is frozen. The fat globules agglomerate on the surface of the air cells, helping to stabilize the foam structure of ice cream. Nonfat milk solids (NMS) are the proteins, lactose and mineral salts derived from milk products. NMS are important to the texture of ice cream, improving the distribution of air cells and surrounding the fat globules to prevent too large an agglomeration (Tetrapak, 2004). Fat globules in ice cream have an average diameter of 1 micron, leading to an extremely large total surface area of fat in ice cream. One study found that it is the surface of the fat globules that contributes to the flavor and consistency, while the interior of a molecule merely adds calories (Freedman, 2004).
Fat I c - sc-globule.~. . , Air bubble ce * Crystal Casein. ~70 um
2.2 Ice Cream Quality
High quality ice cream is recognized largely based on mouth feel. The mouth feel is affected most strongly by the size of the ice crystals and also the density of the frozen ice cream. Smaller crystals give a creamier texture. Ice crystals in ice cream are of average diameter 50 microns and air bubbles are of average diameter 70 microns. In premium ice creams the ice crystal diameter may be less than 30 microns. If the ice crystals become larger, due to recrystallization after melting and re-freezing or due to incomplete processing, the ice cream can incur a grainy texture. The fat content of the ice cream additionally improves the creamy texture and the smoothness of the mouth feel. Premium ice creams can be more than 20% milkfat.
The density of frozen ice cream is indicated by percent overrun. With too much air the ice cream will seem to lack substance. Overrun is ratio of the volume of gas to the volume of ice cream mix in ice cream. The overrun, 0, can be calculated for any full collection container according to
Kontainer _
Vim
Vcm = total container
Pim
where Vcontainer is the volume of the container of ice cream, Vim is the volume of ice
cream mix in the container, mtotal is the mass of the full container of ice cream, and
Imcontainer is the mass of the container. This calculation neglects additions to the ice cream
such as nuts that do not incorporate air. Typically, the production rate of an ice cream machine is quoted at 100% overrun; the volume of air in the frozen structure is equal to the volume of ice cream mix in the frozen structure. The legal maximum in the United States is around 120%. Super premium ice creams may have as low as 60% overrun. Homemade ice cream and small batch machines often have lower air content due to reduced whipping.
The quantity of each ingredient in a mix can affect the freezing properties of the ice cream, and therefore the ice crystallization. Mix calculations are typically based on the percent mass of each constituent in the mix. Particular constituents in the mix, including NMS, fat, sucrose and water often come from multiple sources, such as cream, milk, sweetened condensed milk and nonfat dry milk. The contribution of NMS from each source (i.e. milk and cream) is summed. Whole milk is typically 3.25% fat and
8.25% NMS; light cream is typically 20% fat and 7.2% NMS. Appendix A gives an
example calculation of the milkfat, sucrose and NMS content of a mix used to test the flash-freezing proof-of-principle apparatus described in Chapter 4. The mix has a 2:1:0.5 mass ratio of light cream to whole milk to sugar, resulting in 12.4% fat, 6.5% NMS and
14.3% sucrose, with the remaining 66.8% being nominally water. The water content and density of a typical ice cream mix are -60% and 1054-1087 kg/M3 respectively. The
NMS content of the 2:1:0.5 mix is low compared to commercial mixes. Whole milk is slightly denser than light cream, and both fluids are denser than sugar; however the mass ratio can be used as a volume ratio with negligible change to the mix calculation.
2.3 Conventional Ice Cream Freezing Process
Conventional freezing processes involve both a dynamic and a static freezing step. During dynamic freezing, ice cream mix is pumped through an annular chamber with a refrigerant such as ammonia or R-22 surrounding and actively cooling the walls. Compressed air is concurrently metered and injected into the chamber. The mix is churned and aerated by a beater-dasher assembly, shearing and dispersing small air bubbles in the ice cream. The mix freezes on the cylinder walls and is continuously scraped off by rotating blades on the dasher. These blades operate with small clearances in order to shear small ice crystals off the wall. Crystals that have been scraped off the wall can grow in the volume of the cylinder, so an additional pump is sometimes used to push the ice cream quickly through the freezer. A schematic of the basic barrel freezer assembly is shown in Figure 2-2. The mix exits the continuous freezer at approximately
-5 *C, with 30-55% of the water content frozen. Any dry or soft ingredients, such as
nuts, cookie dough or caramel, are added at this point in the process. The mix is poured into cups, cones, or containers as desired. Continuous freezers are available with capacities from 50-4000 L/hr.
A second step is required to arrest the crystal growth process and maintain the fine structure achieved in the barrel freezer. The ice cream containers are passed through a hardening tunnel where the ice cream is frozen below -200C. No new ice crystals are nucleated, water freezes out of solution onto existing ice in the mix. Blast freezers and cold-plate freezers are operated at temperatures of -40*C to facilitate rapid freezing and maintain the quality of the ice cream. The hardening time is defined as the time required for the temperature in the middle of a package to decrease to -1 8*C. A hardening time of 6-8 hours for an 18.9 L (5 gal) package is typical of a conventional hardening room operating at optimal conditions. Large commercial manufacturing plants may freeze
5,000 -10,000 L/hr (Tetrapak, 2004). Figure 2-3 is an example of a hardening tunnel.
The ice cream freezing process achieves three important features in the frozen dessert. At least 80% of the water content is frozen, air is incorporated into the mix and dispersed in small bubbles, and fat globules partially coalesce helping to stabilize the dessert structure. To improve the quality of the ice cream some processes incorporate an additional dynamic freezing step with a double screw apparatus. In small plants batch freezers sometimes replace the continuous freezer. These tend to incorporate less air and require an increased ice cream residence time. Small plants may place the partially frozen mix directly into the cold storage facility to avoid the cost of a hardening tunnel. Until the ice cream has been hardened, extra space between packages must be maintained to allow for cooling. Larger ice crystals typically result from the slower hardening.
Beater Dasher Knives
Cyfinder Jacket
Refrigerant
Figure 2-2 Continuous freezer assembly. [Source: Tetrapak]
Figure 2-3. Ice cream plant hardening tunnel. [Source: Tetrapak]
2.4 Industry Interests
Ice cream is a $20 billion market in the US alone, but the market is highly competitive. Industry players are particularly interested in opportunities to differentiate their product, such as novel molded forms or unique flavors. In addition, the
conventional ice cream freezing process is expensive. The continuous freezers and a hardening tunnel require capital investments of greater than $100,000 each. The beater-dasher assembly in the continuous freezer operates with small clearances against a high viscosity mix; the blades must be carefully maintained. The hardening tunnels involve intricate conveying mechanisms. The equipment has a large footprint on the plant floor. The conventional ice cream freezing process is a significant energy consumer. The largest energy consumer is the hardening tunnel, where rapid freezing requires low
temperatures and plenty of space between packages for effective heat transfer. Energy is also consumed in the continuous freezer to shear the ice crystals and move the high viscosity mix. The re-introduction of sheared crystals into the bulk of the mix allows the crystals to grow. Additional cooling is required to remove the heat generated in the shearing process.
Low temperature continuous freezers were introduced by Tetra Pak in June 2003, based on ice cream plant manufacturers' interests (Tetra Pak Hoyer, 2003). These
freezers draw ice cream at -12*C, in many cases obviating the need for a hardening tunnel
and shortening the production line. These low temperature freezers can produce fine ice crystals, leading to a smooth creamy ice cream texture with a lower fat content. In addition, the ice cream has improved melting resistance. Drawing the ice cream at -1 2*C is not advantageous for adding inclusions like nuts or chips because the ice cream
viscosity is significantly increased at the colder temperature.
A method to produce lightly carbonated yogurt was developed at Brigham Young
University. Streams of yogurt and carbon dioxide gas pass through a pressurized shear-field to incorporate the carbon dioxide in the yogurt. Preliminary market tests were carried out for sales of the yogurt in an on-campus convenience store. Additional market tests were carried out by Ipsos-Insight in Brussels in 2000. The yogurt received high acceptance rates, particularly by teenagers and young adults. There is typically also a small segment, -10%, which do not like carbonated yogurt at all (BYU, 2000). Various fruit flavors were tested. Carbon dioxide was also injected into a pressurized freezing chamber with non-fat soft-serve yogurt mix. In a 160 kg mix with 60% overrun, the
frozen yogurt contained 156 g of dissolved CO2 (975 ppm) and 208 g of CO2 gas bubbles
(1300 ppm) (Ogden, 2002). This is on the order of the concentration of carbon dioxide in
CHAPTER 3 - THEORY
3.1 Design Parameters
Implementation of the novel ice cream freezing process involves several design parameters, including choice of nozzle size and the pressure and temperature states in
each chamber. The expansion process requires liquid phase initial fluid states, emulsion of the fluids, an effective refrigerant/mix balance and exit conditions that will induce flash freezing of the ice cream mix.
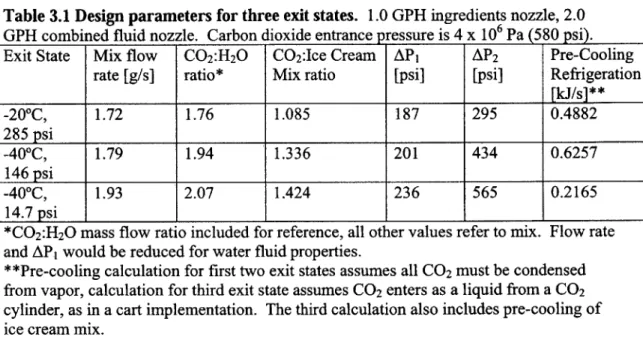
To implement the flash-freezing process the desired exit state of the ice cream and the required production rate should be chosen. Table 3.1 shows the design parameters for three exit conditions referred to in the following sections. Ice cream exiting at -20*C can be directly compared to the conventional process, ice cream exiting at -40*C corresponds to the existing proof-of-principle apparatus, and ice cream frozen directly to atmospheric pressure is applicable for a cart implementation. Note that for the first two cases, the temperature of the ice cream product corresponds to the temperature of the saturated carbon dioxide exiting the product chamber at Psat,v. In the third case, the carbon dioxide is throttled to a pressure and temperature below its triple point; carbon dioxide sublimates at -78.5*C and atmospheric pressure. In this case the mix is frozen to -20*C rather than
-78.5*C by maintaining an appropriate fluid ratio. Cooling ice cream to -78.5*C would
require a very large ratio of carbon dioxide to mix and would not provide any advantages for the microstructure of the ice cream or the ice cream distribution chain.
For standard implementations of the flash freezing process, the following parameters should be assumed: initial ice cream mix and liquid carbon dioxide
temperature of 5*C, initial carbon dioxide pressure of 4.0 x 10⁶ Pa (580 psi), and Delavan fuel nozzles rated at 1.00 GPH for the mix and 2.00 GPH for the combined flow. The initial carbon dioxide temperature and pressure ensure liquid phase carbon dioxide in the emulsion. The nozzle sizes are based on tests with the proof-of-principle apparatus that led to a desirable powder consistency. The choice of nozzle is discussed in detail in Chapter 4. Larger nozzles would make the texture of the frozen product coarser. The required production rate should be met by increasing the number of nozzles rather than increasing the size of the nozzles or the pressure drop across the nozzles. Although increasing the pressure drop across a nozzle would increase the total flow rate, the power required to pump and compress the fluids would be increased.
In addition to the size of the nozzles and the pressure drop across each nozzle, the composition of the ice cream mix affects the flow rate of the fluids and the product overrun. The values in Table 3.1 are for a 10% fat mix. The effects of alternate recipes are described in the discussion of the proof-of-principle apparatus in Chapter 4.
Ice cream mix can include many ingredients, which alter the freezing properties of the mix. Typically 60% of the mass of ice cream mix is contributed by the water content (TetraPak, 2004). The sweeteners, cane and beet sugar or corn syrup, depress the initial freezing temperature of the mix. The freezing point of common mixes is depressed by approximately 3*C. During freezing the water solidifies in fine crystals, leaving an increasingly concentrated serum solution of carbohydrates, fats and NMS. In a conventional process the concentration of sweeteners in the solution will increase as
some of the water is frozen out, further depressing the freezing point. Below
approximately -30*C a sucrose solution undergoes a transition to a glass phase and no more water can be frozen out of the highly concentrated serum (Clarke, 2004); only
-85% of the water content is frozen.
Table 3.1 Design parameters for three exit states. 1.0 GPH ingredients nozzle, 2.0 GPH combined fluid nozzle. Carbon dioxide entrance pressure is 4 x 10⁶ Pa (580 psi). Exit State Mix flow C0 2:H20 C0 2:Ice Cream AP1 AP2 Pre-Cooling
rate [g/s] ratio* Mix ratio [psi] [psi] Refrigeration
[kJ/s]** -200C, 1.72 1.76 1.085 187 295 0.4882 285 psi -40*C, 1.79 1.94 1.336 201 434 0.6257 146 psi -400C, 1.93 2.07 1.424 236 565 0.2165 14.7 psi I I I I I _I
*C02:H 20 mass flow ratio included for reference, all other values refer to mix. Flow rate and AP1 would be reduced for water fluid properties.
**Pre-cooling calculation for first two exit states assumes all CO2 must be condensed from vapor, calculation for third exit state assumes CO2 enters as a liquid from a CO2 cylinder, as in a cart implementation. The third calculation also includes pre-cooling of ice cream mix.
3.2 Carbon Dioxide-Mix Mass Flow Ratio
The mass flow ratio of liquid carbon dioxide to ice cream mix must be balanced so that the enthalpy carried away by the vaporized carbon dioxide matches the enthalpy released by the freezing of the ice cream mix. Before calculating the required ratio, the enthalpy change of each fluid for the expected entry and exit states must be determined. The appropriate carbon dioxide enthalpies are found in the saturation tables for a pure substance. Carbon dioxide is expanded from saturated liquid at 5*C to saturated vapor at the exit condition chosen for the process implementation. The values for the relevant conditions are provided in Appendix B.
The water content of the ice cream mix freezes out of solution while the rest of the mix is cooled to the freezer temperature. The specific enthalpy of the ice cream mix is decreased by the sum of the latent heat of fusion of the ice content (334.2 kJ/kg) and the sensible heat that is removed to cool the unfrozen mix and the partially frozen mix. The heat capacity of unfrozen mix is approximately 3.35 kJ/kgK (Marshall, 2003). This is less than the heat capacity of pure water due to the presence of the fats, sugars and other ingredients. The heat capacity of the ice cream decreases as the volume of ice in the mix increases because ice has a lower heat capacity than water. The heat capacity of partially frozen ice cream is about 2.72 kJ/kgK, while the heat capacity of ice cream near -20*C is typically 1.88 kJ/kgK. For the typical ice cream heat capacities stated above, the enthalpy change is
kJ kJ J
Ah.e, = (5- 3)*C x 3.35 +0.85 x 0.60 x 334.2 +(3 -T- ,)C x 2.72 . (la)
kg*C kg kg*C
The heat capacity of semi-frozen ice cream was used for the sensible heat that must be removed from the partially frozen mix. This leads to a small over-estimate of the carbon dioxide required because the heat capacity of the ice cream decreases as it freezes. If the mix is replaced by pure water, the enthalpy change can be found using pure substance tables for liquid water at 50C and solid water at the appropriate exit temperature,
Ahicm = bH20,1,5c - H20,s,-20C (b)
The enthalpy of the solid can be found in a solid-vapor equilibrium table.
The mass flow ratio of carbon dioxide to mix or water is calculated according to,
R= Acm , (2)
hco2satv -bCo2,1
where hCO2,sat,v is the specific enthalpy of the carbon dioxide exiting the product chamber
and hco2,1 is the specific enthalpy of the liquid carbon dioxide entering the emulsion chamber. For the implementation conditions presented in Table 3.1, the carbon dioxide flow must be greater than the ice cream mix flow rate. To freeze pure water, the carbon dioxide flow rate must be approximately double the water mass flow rate. This mass flow ratio calculation assumes that the product chamber is already at a steady state temperature close to the desired product temperature. In the proof-of-principle tests the product chamber is pre-cooled using liquid nitrogen. In a continuous process, a start-up period during which carbon dioxide is expanded in the absence of ice cream flow can be used to cool the process equipment.
The specific enthalpy that the carbon dioxide vapor can carry away decreases as the temperature of the exit state decreases. In addition, the specific enthalpy that must be removed from the ice cream mix increases for colder product temperatures. Therefore, the carbon dioxide to mix ratio must be increased to produce a colder product. The flow ratio increases by 21% for the 20 degree decrease in the product exit temperatures provided in Table 3.1.
The mass flow ratio calculation can also be applied if only the carbon dioxide or if both fluids enter the emulsion chamber near room temperature. The specific enthalpy of the incoming flow is increased when the flow enters at the temperature of the
environment, reducing the change in enthalpy of the carbon dioxide and or increasing the change in enthalpy of the mix. The mass flow ratio required to freeze ice cream mix is increased by approximately 15% if both fluids enter at room temperature. In addition, the incoming fluid pressures must be increased to maintain liquid phase carbon dioxide before the combined fluid nozzle. The power required for a cycle without pre-cooling refrigeration is slightly larger than for a cycle with pre-cooling, however, omitting the pre-cooling condensing unit could be preferable for environmental reasons. This is
3.3 Pre-cooling Refrigeration Requirement
For a standard implementation of the flash-freezing process, the ice cream mix and the liquid carbon dioxide enter the emulsion chamber at 5*C. An evaporating
refrigerant can be used to separately pre-cool the mix and the carbon dioxide. A standard condensing unit can be used for the refrigeration cycle.
Carbon dioxide for the freezing process comes from two sources. The majority of the flow is the carbon dioxide vented from the product chamber. This recycled flow is a vapor slightly warmer than the temperature of the environment after passing through the compressor and the after-cooler. The additional make-up CO2 enters as a vapor at the temperature of the environment. The recycled flow has been compressed to the pressure required in the emulsion chamber. The pressure of the make-up CO2 is regulated to match the pressure of the recycled flow. The percent of the carbon dioxide flow that is recycled is calculated based on the difference between the mass of carbon dioxide required for flash-freezing the mix and the mass of carbon dioxide removed from the cycle with the product. The mass of carbon dioxide removed with the product is estimated as the mass of carbon dioxide required to fill the void space in the product,
7sat =- Ox PCoRx 2,satv .3a)
pH20
The mass of carbon dioxide recovered varies with the density of the carbon dioxide gas contained in the frozen powder and the overrun. This calculation neglects carbon dioxide in solution in the product and solid carbon dioxide present with the product. Carbon dioxide has low solubility in water and ice, so the mass of carbon dioxide dissolved in the product is much less than the mass of carbon dioxide filling the void volume. Formation of solid carbon dioxide is not expected for the general case; formation of dry ice powder would require product temperatures less than -78.5*C or flashing to atmospheric pressure with excess carbon dioxide. More than 99% of the carbon dioxide flow can be recovered from ice cream product exiting at -20*C, atmospheric pressure and 100% overrun.
Approximately 95% of the carbon dioxide flow can be recovered as saturated vapor if the powder is compacted to 100% overrun before it is removed from the product chamber. Additional carbon dioxide can be recovered from the gas volume in the ice cream powder after it passes through the airlock. The tests with the proof-of-principle apparatus
described in Chapter 4 suggest high overrun at the saturated vapor carbon dioxide exit conditions. As little as 52% of the total carbon dioxide flow may be recovered from the product while it is at the saturated vapor pressure.
Additional carbon dioxide can be recovered when the product is brought from saturated to atmospheric pressure. This carbon dioxide must be compressed in at least two stages. First it is compressed from atmospheric pressure to the saturated vapor pressure and then it is mixed with the recovered saturated vapor and compressed to the pressure required for flash-freezing. The percent of the carbon dioxide recompressed
from atmospheric pressure is the difference between Eq. 3a evaluated for the overrun and density at saturated conditions and Eq. 3a evaluated for overrun and density at
- mHO
Yatm = xm R-(x- Xcam - Ysau (3b)
The make-up carbon dioxide flow rate is then
mco2makeup = 0 - Ysat - Yatm)x R. (4)
MH20
If carbon dioxide is only recovered from the saturated vapor, Yatm can be omitted from Eq.
4 and the make-up carbon dioxide mass flow must be increased. The carbon dioxide
remaining in the interstitial space in 100% overrun powder at atmospheric pressure is less than 0.25% of the total carbon dioxide flow.
The heat that must be removed from the carbon dioxide flow, per mass ice cream mix flow, can be calculated as
QC02 = Rx
(r
x (hCQ,350C,, - C +c,)+(1-r)
x (hCO220 c, v - h0 2 5 0c,)), (5) MH20where y is the sum of Yatm and Ysat or just Ysat if only one compression stage is used. For this model, 20*C is the assumed environmental temperature and 35*C is the assumed temperature of the vapor CO2 that has been recompressed and air-cooled.
The heat that must be removed to pre-cool the ice cream mix is
Q"
=(T1 -5)*Cx3.35 . (6)mH20 kg*C
The heat that must be removed to pre-cool the ice cream mix is significantly less than the heat that must be removed to condense the carbon dioxide. The ice cream mix does not need to be pre-cooled in an ice cream manufacturing plant because the mix is stored in
aging tanks for 4-24 hours after it is pasteurized and homogenized (Marshall, 2003). To allow the fat to crystallize, the aging tanks are cooler than 4*C. Pre-cooling should be incorporated for a laboratory continuous cycle or cart implementation if the ice cream mix source is warm.
3.4 Power Consumption
The flash-freezing cycle has four main power consuming elements. Power is required for the carbon dioxide compressor, the condensing unit, extraction and
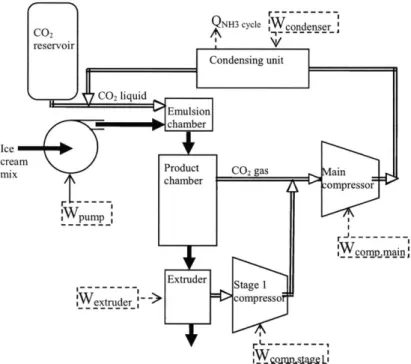
compression of the ice cream powder from the product chamber, and for pumping the ice cream mix at the appropriate entrance pressure, typically greater than 4.83 x 10⁶ Pa (700 psi). Figure 3-1 shows a flow diagram with these power inputs.
r --- ,I CO2 NH3 cycle Ncn~d ser'
reservoir L'Jj 02 lquidCondensing unit Emulsion chamber Ice creamPrdc
mix Product Co2 gas Main
hamber crecsompressor 1pump r r -j --- -- --- -, WcojTm.Siain' --- Extruder Stage I ex~tr~der_- ->compresso
Figure 3-1. Flow diagram with power inputs. The carbon dioxide content of the ice cream mix exiting the product chamber and the carbon dioxide content of the ice cream mix exiting the extruder vary with process implementation.
3.4.1 Compressor Power Consumption
The flash freezing cycle includes one to two compressors to recycle the carbon dioxide. The main compressor compresses carbon dioxide from the saturated vapor exit pressure, Psat,v, to the pressure of the liquid CO2 in the emulsion chamber, PCO2,1. In Figure 3-1, this power input is labeled Wcomp,main. If incorporated, a second compressor
compresses carbon dioxide recovered from the product at atmospheric pressure, Patm, to the pressure at the entrance to the main compressor, Psat,v. In Figure 3-1, this power is labeled Wcomp,stagei.
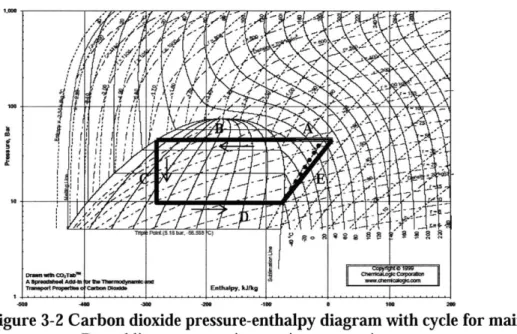
Figure 3-2 shows a simplified model of the main carbon dioxide refrigeration cycle on a pressure-enthalpy diagram. Line segment A represents the heat removed by the air-cooled after-cooler. Line B represents the cooling provided by the condensing unit. Line C corresponds to the constant enthalpy throttling of the carbon dioxide flow
and line D corresponds to the expansion during flash freezing. The compression work is shown by line segment E. Both an isentropic compressor and a 70% efficient compressor are represented. The model shows constant carbon dioxide enthalpy through the throttle (segment C). It is actually the net enthalpy of the carbon dioxide and ice cream mix emulsion that remains constant through the throttle. Interaction between the carbon dioxide and the ice cream mix could be significant despite the short time scale of the throttle due to the large interfacial surface area of the emulsion. If the carbon dioxide exits the product chamber as a saturated vapor at the pressure set by the BPR, the compression work is not changed by the assumption that the throttle process is isenthalpic for carbon dioxide.
I
Figure 3-2 Carbon dioxide pressure-enthalpy diagram with cycle for main
compressor. Dotted line represents isentropic compression.
The carbon dioxide compression work for the simple cycle shown in Figure 3-2, per unit mass flow of ice cream mix is
W4 .cm , x Rx (hPIQ 2J - hsatv)
()
MH20q
where il represents the compressor efficiency and hrev,PCo2,I is the specific enthalpy of the carbon dioxide for an ideal compression to the pressure, Pco2,1, that the carbon dioxide must have in the emulsion chamber. The specific enthalpy for an ideal, adiabatic
compression is equal to the enthalpy of carbon dioxide at 3.96 x 10⁶ Pa (575 psi) and the same specific entropy as the saturated vapor exiting the flash freezing. The enthalpy and hence temperature of the carbon dioxide after a real compression can be found by adding the compressor work to the enthalpy of the saturated vapor. The first two terms on the right-hand side of Eq. 7 represent the mass of carbon dioxide that is recompressed per unit mass of water or mix.
The power consumption of a flash freezing cycle that recovers carbon dioxide in two stages is larger than for the process described above. The work to compress part of the flow from atmospheric pressure to the saturated pressure of the vapor carbon dioxide exiting the product chamber is calculated by,
Wcomp'stagel
(8)
This portion of the carbon dioxide flow is then cooled to room temperature by an after-cooler and mixed with the recovered saturated vapor. The new specific enthalpy and entropy of the carbon dioxide flow entering the main carbon dioxide compressor are greater than the enthalpy and entropy of the saturated vapor alone. The work done by the main compressor is calculated as in Eq. 8, substituting a mass averaged value for the enthalpy of the incoming carbon dioxide and using the mass averaged entropy of the incoming flow to the compressor to determine the final enthalpy for a reversible process. The work per unit mass of water or ice cream mix can be found as
__ = =R___ * y am comp'stagel ~ ' 'Yatm ' (y Yt+ +7 ,)x s XwCOPMi 9
com'p""m.af9
MH20
sCO2 C0 2
3.4.2 Condensing Unit Power Consumption
The compression work and refrigerant flow rate for the condensing unit are calculated based on a refrigerant evaporating at -5*C in a heat exchanger. The pre-cooling refrigeration cycle could be represented similarly to the carbon dioxide cycle on a pressure-enthalpy diagram for ammonia or another refrigerant. The throttling process for the refrigerant is again assumed to be isenthalpic. The refrigerant to ice cream mix mass flow ratio is calculated according to
+C2 +
RNH = H20 MH20 (10)
NH3,-5*C,V NH3,-5C,1pvw
The enthalpy of the refrigerant before the heat exchanger, hNH3,-5C,IpartiaI, is determined by the enthalpy of the condensed refrigerant before it is throttled to the -5 'C saturation pressure. The refrigerant is two-phase after the isenthalpic throttle. In this model, it is assumed that the refrigerant in the condensing unit is air-cooled to 35*C before throttling. Water-cooling would reduce the compression work required as well as the ratio of refrigerant to ice cream mix flow. When the ice cream mix comes directly from the aging tanks, the term corresponding to pre-cooling the ice cream mix, QpC, can be omitted from the numerator of Eq. 10. The work required for the refrigeration cycle is calculated
as in Eq. 7, replacing the first two terms on the right-hand side with RN3; Y is Omitted because refrigerant leak from the pre-cooling refrigeration cycle is neglected.
The thermal energy that must be removed from the carbon dioxide flow by the condensing unit is increased slightly when carbon dioxide is recovered in two stages. The specific enthalpy of the carbon dioxide vapor entering the condensing unit is not changed assuming the increased flow is still air-cooled to 35*C. The mass of the carbon dioxide flow that must be condensed from a superheated vapor is increased by
y,n x R x mH20. The power consumption of the condensing unit is correspondingly
increased. The calculation is the same as in Eq. 7 with RNH3 replacing y x R as described above.
3.4.3 Ice Cream Pump and Extruder Power Consumption
Power is also required to move the ice cream mix and frozen powder through the flash freezing process. The ice cream mix must be pumped to the first nozzle under high pressure and the powder must be extracted from the pressurized flash chamber and compressed to a desired overrun. The pressure of the incoming mix must be at least 6.89 x 10⁵ Pa (100 psi) greater than the pressure in the emulsion chamber, approximately 4.83 x 10⁶ Pa (700 psi). The power required to pump the ice cream mix is
W , W =m APAP (11)
mH2 PH 20 X 7
where AP is the difference between the pressure at the first nozzle and the pressure of the mix leaving the aging tank, typically atmospheric pressure. Ice cream mix is one to two orders of magnitude more viscous than water at standard temperature and pressure. Ice cream mix is shear-thinning. The pump must be designed to accommodate these fluid properties. Typically pumps for ice cream mix do not achieve pressures greater than -1.38 x 10⁶ Pa (200 psi), except where the mix is pumped through a homogenizer, at pressures greater than 5.5 x 10⁶ Pa (800 psi).
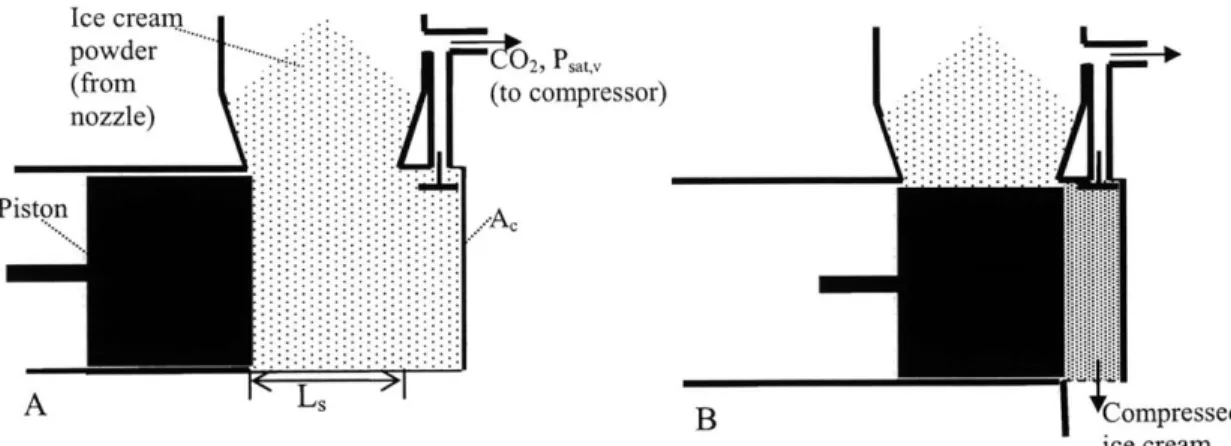
The ice cream product can be extracted by a piston-cylinder system, a screw extruder or another positive displacement pump. Figure 3-3 shows a simple piston-cylinder geometry. In this model the piston-cylinder length is shorter than the piston stroke so that the powder is compressed against the end of the cylinder. The model includes a valve in the cylinder to allow carbon dioxide flow and a removable bottom plate to allow the powder "block" to fall out of the extruder. With each stroke, a fixed volume of powder is moved out of the collection area and compressed against the cylinder end. During the forward stroke carbon dioxide at Psat,v flows into the carbon dioxide exhaust stream from the product chamber through the open valve. When the piston reaches the end of its stroke, L,, the valve is closed and the bottom plate is opened slightly to allow carbon dioxide to escape until the compressed product reaches atmospheric pressure. The escaping carbon dioxide could be captured and recompressed using an additional CO2 compressor stage as described in Section 3.4.1. The bottom plate is removed and the
powder block drops out of the cylinder. The bottom plate is then replaced and the valve is reopened. Carbon dioxide vapor at Psat,v refills the compressed product volume. The piston retracts to its starting position.
Ice cream
powder
...--nozle)
A
(to compressor)nozzle) : . . . .. . .
p...A.
A s BCompressed
ice cream Figure 3-3. Piston extruder geometry. A: initial piston position. B: compressed
powder exiting extruder. (Schematic for 100% overrun product.)
For this simplified model the piston is assumed to be massless and frictionless. Air at atmospheric pressure is present in the volume of the cylinder after the product is removed, but it is neglected for this model. This model does not include filtering of the carbon dioxide passing through the valve, but an actual implementation may require filtering to remove ice cream powder entrained in the carbon dioxide flow.
In this model the piston only does work against the carbon dioxide vapor and the ice cream powder. By assuming that the powder remains permeable to carbon dioxide vapor during the compression and recognizing that the valve is open during the entire piston stroke, the carbon dioxide pressure can be modeled as uniform throughout the volume and constant during the entire stroke. The work done by the piston on the gas is equal to the product of the pressure at the piston face and the change in volume during the piston stroke. The work done by the piston on the gas during the forward stroke is exactly equal to the work done by the gas on the piston when the piston is retracted. This could be implemented using a fly-wheel. Thus, the net power consumption of the piston is solely due to moving and compressing the powder. If the inertia of the powder and the friction between the powder and the cylinder walls are neglected, power is mainly required to compress the powder. The power required to simply move the powder out of the product chamber is neglected based on these assumptions.
The bulk mechanical properties of the ice cream powder are not understood at this time. Tests with the proof-of-principle apparatus suggest an initial overrun of at least 400%. It may be necessary to compress the powder to a typical density for ice cream,
100% overrun. Snow compaction has been studied for several applications including tire traction and forming ice blocks for stored cooling; Shapiro et al present an overview (Shapiro, 1997). The microstructure of snow has a significant impact on the particle deformation and stresses during compression. The force required to compress snow varies with the age and temperature of the snow and the strain rate applied due to changes in the bonding between particles, particle contact area and fracture and recrystallization of particles. Fresh snow is typically not well-bonded. In addition, in the ice cream
powder, bonding between particles may be reduced by the presence of ingredients other than water.
For simplicity, the ice cream powder is modeled here as incompressible
particulate solids with interstitial gas. Because the ice cream powder is only compressed to 100% overrun it is assumed that the bulk density of the powder is increased mainly by particle realignments rather than deformation of the particles. A commonly used
relationship based on experiments with various powders is given by Osswald and Stradinis (Osswald, 1995). The density of the solids is an exponential function of pressure,
p(P,)=pmax +(po - pm)e' , (12)
where po is the initial density of the powder, pmax is the maximum density of the
particulates, and 0 is an empirical compressibility coefficient; Osswald and Stradinis give an average value of 2.38 MPa~1 for wax-coated RDX. An appropriate value of 0 for ice cream powder is not known. The maximum density of the ice cream mix is similar to that of water, 1000 kg/m3. Assuming 400% overrun, the initial density of the powder is 200 kg/m3. The density of a 100% overrun product is 500 kg/M3. Using Eq. 12 and 2.38 MPa~1 for P, the additional pressure required to achieve this compression ratio (5:2) is
1.97 x 10⁵ Pa (28.64 psi). This is the same order of magnitude as was applied to an ice cream powder sample in a test described in Chapter 4.
A rough estimate of the power required to compress the powder can be made by assuming that the piston applies a force equal to Pf times the cross-sectional area, Ae, for its entire forward stroke. The force transmitted through the particles along the length of the cylinder decays exponentially (Rosenzweig, 1995), so the powder closest to the piston is compacted first, until it reaches the maximum density for the applied force. The force is then transmitted through the compacted portion of the powder to the uncompressed portion. Eventually the powder at the end of the cylinder is influenced by the force applied by the piston. This model does not account for the possibility that particles could form interconnected chains along the cylinder length and no longer behave as a fine powder. The compression work can be estimated as the product of the applied force and the distance traveled by the piston. The frequency of the piston motion determines the power required. The frequency, f, of the piston cycle is determined by the uncompressed volume flow rate of the ice cream powder,
f PHO (13)
A, x L,
This frequency calculation neglects pauses of the piston stroke to vent carbon dioxide and allow the compacted "block" to drop out. The power for the compression is then
xtruder f X Ac X s X f - (14)
Because A, and Ls are also in the denominator of the expression for frequency, these terms drop out, leading to an expression independent of the piston-cylinder geometry.
Wextruder Pf 0 . (15)
mH20 PH
2O
This model should be revisited after the properties of the ice cream powder are investigated.
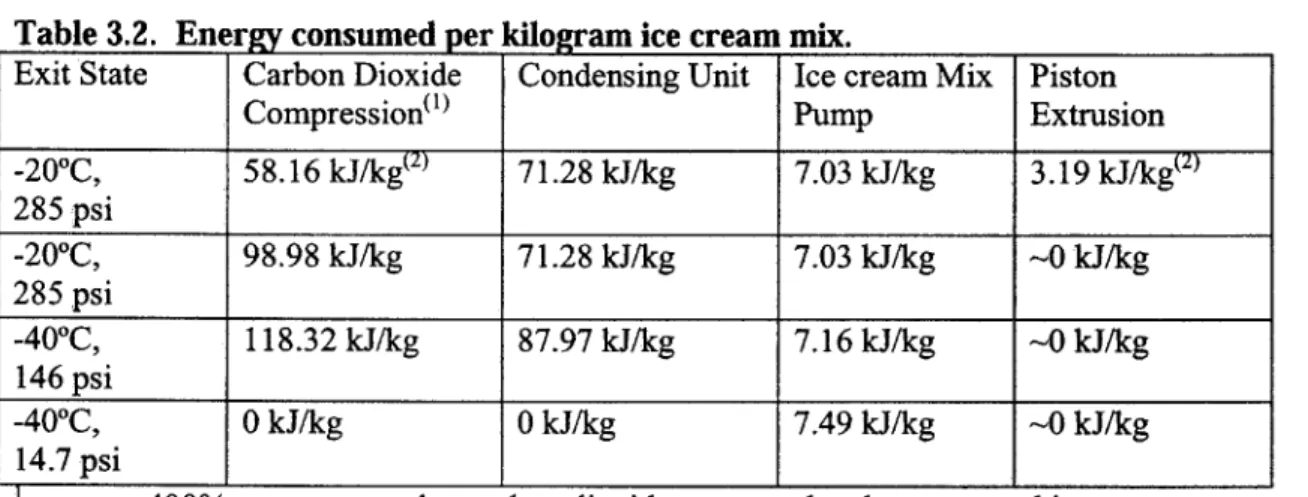
3.4.4 Sample Power Consumption of Four Components
Table 3.2 shows the power requirement for the three exit conditions modeled using the methods presented in the previous sections. The carbon dioxide compressor and pre-cooling refrigeration cycle compressor are the main power consumers. In the cart model, carbon dioxide is not recycled or condensed, so the power consumption of the compressor and the condensing unit are zero. The power required to compress the powder is small relative to the other process components; however compressing the powder has a very strong effect on the power required for the carbon dioxide
compression. More carbon dioxide is recovered at Psat,v when the compression is carried out, reducing the load on the first stage carbon dioxide compressor.
Table 3.2. Energy consumed per kilogram ice cream mix.
Exit State Carbon Dioxide Condensing Unit Ice cream Mix Piston
Compression') Pump Extrusion
-200C, 58.16 kJ/kg(2) 71.28 kJ/kg 7.03 kJ/kg 3.19 kJ/kg(2) 285 psi -200C, 98.98 kJ/kg 71.28 kJ/kg 7.03 kJ/kg -0 kJ/kg 285 psi -400C, 118.32 kJ/kg 87.97 kJ/kg 7.16 kJ/kg -0 kJ/kg 146 psi -400C, 0 kJ/kg 0 kJ/kg 7.49 kJ/kg -0 kJ/kg 14.7 psi
2assumes 400% overrun powder, carbon dioxide recovered and compressed in two stages
assumes powder compression from 400% to 100% overrun, carbon dioxide recovered at
Psat,v during powder compression
3.4.5 Screw Extrusion
Screw extrusion is an alternate method to extract the ice cream powder. The incompressible solids flow can be modeled according to (Bernhardt, 1959). In the screw size required to accommodate the flow rate of the ice cream, the fine powder will
undergo internal shear, so the flow can be modeled as a fluid with an appropriate viscosity. The flow is moved down the channel by viscous drag and impeded by the pressure gradient imposed by the die at the end of the screw. If there is no die the flow is moved forward by the pressure gradient from Psat,v at the entrance to the screw to Patm at the end of the screw. Figure 3-4 shows the screw geometry. For a simple model, the screw channel is "unwound" into a straight channel of width w and height h, with the walls corresponding to the flight(s) in the screw. Assuming h<<w, the Boussinesq approximation is valid.
8Z
Figure 3-4 Screw extruder geometry. [Modified from (Bemhardt,1959).]
Using the variables shown in Figure 3-4, Bernhardt gives the volumetric drag
flow rate, Qd, as
QdU h*Fd (19)
2
where Fd is a shape factor for drag flow based on the channel depth-to-width ratio and U. is the velocity of the barrel in the down the channel direction, given by
Uz= N*n*D*cos(<p). (20)
N is the rotation rate of the screw, D is the diameter of the barrel around the screw and <p is the helix angle. Typically in a single flight screw, the channel width is similar to the diameter of the screw, giving <p - 17.6 degrees. The shape factor, Fd varies from 1.0 for a depth-to-width ratio approaching zero to a value of 0.5 for a depth-to-width ratio of 1.0.
The volumetric pressure flow,
Qp,
again following Bernhardt, is- w*b 3 * FP * dp
Q = 12 dz (21)
12pu
where Fp is a shape factor for pressure-flow, is the pressure gradient along the
dz
channel and pt is the viscosity of the powder. Fp varies from 1.0 for a depth-to-width ratio approaching zero to a value of 0.42 for a depth-to-width ratio of 1.0. The powder
viscosity should be high due to the large solids content and the cohesion of the particles as any melting occurs. For these models, the viscosity of cookie cream premix at 65'C was used, 29.6 Pa-s. The pressure gradient is determined by the required pressure gain for compression or the pressure drop to atmospheric conditions along the length of the screw channel. The sum of the drag and pressure flows gives the total volume flow of the ice cream product. The small volume of back flow through the clearance between the channel flights and the barrel is neglected. The channel length, rotation rate and screw
diameter can be varied to design an extruder that meets the flow requirements. The rotation rate should not typically exceed 180 rpm, and smaller values will reduce the shearing and heating of the powder.
In the screw extrusion model by Bernhardt there are three causes of power dissipation: shear in the channel, the pressure gradient down the channel and shear in the clearance between the flight and the barrel wall. Bernhardt gives the power dissipation by shear in the channel as
P=,= 3D3N2 * e *
t1+3
Jcos2(V)+4sin22
()j , (22)e+b
(
QdP )hwhere e is the flight thickness, b is the screw flight width in the axial direction, and L is the length of the screw. Power dissipation due to pressure is
Pp = (Qp+Qd)*AP, (23)
where AP is the change in pressure from the beginning to the end of the screw. Power dissipation due to the clearance between the flights and the barrel is
PC 2 D 2 N 2 pAeL (4
P = 2 Ue ,rDN (24)
S*tan()
where 6 is the clearance between the flight and the barrel. The viscosity in the clearance, pa, is the viscosity of a highly sheared layer of the ice cream. For these models, the
viscosity of light cream was used, 0.004 Pa-s.
Table 3.3 shows the resulting geometry and power requirement for a screw to extrude 400% overrun ice cream powder at a mix flow rate of approximately 1000 L/hr. The depth-to-width ratio is 0.39, giving Fd equal to 0.78 and F, equal to 0.74. The power required for screw extrusion can be compared to the power required for the piston-cylinder apparatus by multiplying the result in Table 3.2 by the mix flow rate and the density of ice cream mix. The power required to extract and compress -1000 L/hr of ice cream mix by screw extrusion, 1.51 kW, is slightly larger than the power required to compress the powder with the piston-cylinder apparatus, 0.93 kW; however the screw extrusion model accounts for shearing of the powder along the extruder walls. If the powder does not need to be compressed, the screw extruder simply meters the product continuously and reduces the pressure in the product from Psat,v to Patm in a controlled manner. The pressure in the product chamber provides most of the motive power. Table 3.3 Screw extruder geometry and power consumption (1000 L/hr ice cream mix).
Exit state D [m] H [m] L.[m] N .rpm] Power [kW]
Uncompressed, -20'C, 0.05 0.017 0.2 60 0.52
1.965 x 10⁶Pa (285psi)
100% overrun, -200C, 0.16 0.047 1 180 1.51
3.5 Clathrate Hydrates
Clathrate hydrates are solid formations of water with a small non-polar molecule, such as a light hydrocarbon or carbon dioxide, trapped in the lattice. The hydrogen-bonded water molecules trap the guest gas molecule by geometrical constraints, not by chemical bonding. The water-carbon dioxide clathrate phase is thermodynamically stable in two of the pressure and temperature ranges that occur in the flash freezing process. A viable thermodynamic state for clathrates occurs in the emulsion chamber if the fluids are cooler than 284 K and in the product chamber at Psat,v before the powder is brought to atmospheric pressure. A phase diagram for carbon dioxide and water is shown in Figure 3-5. 7- 6- 3- 2- 1-A
N
-' ILIV\ 260 270 00/MI
TPNOc 280 290 300 310 T (KFigure 3-5 Carbon dioxide-water phase diagram. H-hydrate, Ll-water, L2-liquid
carbon dioxide, V-carbon dioxide vapor, I-water ice [Source: Wendland]
Clathrates form upon contact at the interface between liquid carbon dioxide and water (Irvin et al, 2000), particularly with increasing pressure and decreasing temperature from the phase boundary. A hydrate skin forms, limiting the rate of formation to the
C0 2-water diffusion rate, less than 1.95 x 10⁻⁹ m2/s (Mills, 1995). The hydrate skin is likely to collapse when it is disturbed, exposing new surface area for further clathrate formation (Irvin et al, 2000). In the flash freezing process conditions for clathrate formation are favorable. The atomized spray from the first nozzle ensures a very large water or ice cream mix surface area in the liquid carbon dioxide. In addition, the fluid in the chamber is moving turbulently, possibly increasing the collapse of hydrate skins. The
IL two-phase line (pure) LILAV three-phase line (binary)
CP critical point (pure)
TP triple point (pure)
Q quadruple point(binary)
rapid mixing and short residence time of the fluids prevent the emulsion chamber from freezing solid.
The clathrate particle diameter is typically close to 6 x 10⁻⁶ m, but can be as large as 2.7 x 10⁻⁵ m (Clarke, 20052. In the proof-of-principle apparatus, the nozzle channels are approximately 1.27 x 10~ m wide, but several particles could form a clump across the gap. Nozzle blockage is more likely when freezing pure water than when freezing ice cream mix because the additional ingredients in ice cream mix reduce the water-carbon dioxide contact and may moderate clumping of clathrates. Heat can be applied to dissociate the clathrates and reopen the nozzle. The hydration number, or ratio of water to carbon dioxide molecules, in a clathrate is approximately six, giving a carbon dioxide to water mass ratio of 0.407 in a clathrate. The mass flow ratio of carbon dioxide to water in the flash freezing process is greater than one, ensuring that even if all of the water were converted to clathrates, a \carbon dioxide solution would remain.
In ice cream mix, clathrate formation is reduced because the water volume is only -60% of the mix volume and some of the ingredients are inhibitors to clathrate
formation. Clathrate formation is inhibited by the presence of electrolytes, alcohol or sucrose dissolved in the water solution (Chun, 1999). Ice cream contains about 10% sucrose by mass and 20-30% fats and NMS.
Carbon dioxide-water clathrates are not thermodynamically stable at atmospheric pressure; however, particularly at temperatures below 0*C, the dissociation rate is extremely slow (Gudmundsson, 2000). In a test by Kang et al (Kang, 2001), significant clathrate dissociation in a solid block of carbon dioxide clathrates did not occur for at least 92 minutes after the sample was exposed to atmospheric pressure. The enthalpy of dissociation of the carbon dioxide clathrate (-560 kJ/kg) (Anderson, 2003) is larger than the enthalpy of fusion of water (334.2 kJ/kg), causing the water molecules to go directly to conventional ice when the clathrate collapses, as well as providing additional cooling. Clathrates may exist with the ice in the flash frozen product. The density of clathrates is approximately 1120 kg/M3 (Anderson, 2003), which is larger than the density of ice. If a volume of product contains a high concentration of clathrates, the amount of water or ice cream mix in the product will be over-estimated. In addition, a high concentration of clathrates will reduce the amount of carbon dioxide recovered from the product. 3.6 Emulsion
The emulsion of carbon dioxide and ice cream mix is important for the direct freezing of the mix. The solubility of carbon dioxide in water in the emulsion chamber is less than 8.8 x 10- kg C02/kg H20 (0.02 moles C02/L H20) (Chapoy, 2004). Under quiescent conditions in the absence of clathrate formation, the non-polar, less dense carbon dioxide droplets rise from a mixture of the fluids and coalesce to form a
continuous phase above the water. Gentle stirring of the fluids can easily redisperse the carbon dioxide in the water (Lee, 1999). The fluids do not form a thermodynamically stable emulsion, but addition of surfactants may stabilize the emulsion for a long period of time. Emulsions with high molecular weight surfactants that are nevertheless unstable are maintained for less than a couple seconds (Lee, 1999). The highly turbulent emulsion chamber and short residence time found in the flash-freezing process are necessary to

![Figure 2-2 Continuous freezer assembly. [Source: Tetrapak]](https://thumb-eu.123doks.com/thumbv2/123doknet/14199869.479777/14.918.192.718.117.398/figure-continuous-freezer-assembly-source-tetrapak.webp)
![Figure 3-4 Screw extruder geometry. [Modified from (Bemhardt,1959).]](https://thumb-eu.123doks.com/thumbv2/123doknet/14199869.479777/28.918.229.548.126.291/figure-screw-extruder-geometry-modified-from-bemhardt.webp)
![Figure 3-5 Carbon dioxide-water phase diagram. H-hydrate, Ll-water, L2-liquid carbon dioxide, V-carbon dioxide vapor, I-water ice [Source: Wendland]](https://thumb-eu.123doks.com/thumbv2/123doknet/14199869.479777/30.918.188.764.367.733/figure-carbon-dioxide-diagram-hydrate-dioxide-dioxide-wendland.webp)