DESIGN AND EVALUATION OF BRT AND LIMITED-STOP SERVICES By
Harvey Scorcia
B.S. Civil Engineering, Universidad de los Andes (2005) B.A. Music, Universidad de los Andes (2006) M.S. Civil Engineering, Universidad de los Andes (2006)
Submitted to the Department of Urban Studies and Planning and the Department of Civil and Environmental Engineering in partial fulfillment of the requirements for the degrees of
Master in City Planning and
Master of Science in Transportation at the
Massachusetts Institute of Technology June 2010
© Massachusetts Institute of Technology. All rights reserved
Signature of the Authui
Department of Department of Civil and
MASACHUSETTS INSTIUTE OF TECHNOLOGY
JUL 15 2010
LIBRARIES
ARCHIVES
Urban Studies and Planning Environmental Engineering May 24, 2010 Certified by
Certified by
Nigel H.M. Wilson Professor of Civil and Environmental Engineering Thesis Supervisor
Researc ( <iate
John Attanucci of Civil and Environmental Engineering Thesis Supervisor Accepted by
//
Joseph FerreiraChairman, Master in City Planning Committee 07egment 9 Urjp
tdies
and Planning Accepted byDaniele Veneziano Chairman, Departmental Committee for Graduate Students
DESIGN AND EVALUATION OF BRT AND LIMITED-STOP SERVICES By
Harvey Scorcia
Submitted to the Department of Urban Studies and Planning and the Department of Civil and Environmental Engineering
on May 20, 2010, in partial fulfillment of the requirements for the degrees of Master in City Planning and Master of Science in Transportation
Abstract
Many transit agencies operate limited-stop or Bus Rapid Transit (BRT) services overlapped with local services in corridors with high demand. These service strategies have the potential to improve bus performance as well as service quality. However, the implementation of these service strategies may lead to an increase in access times and waiting times for some passengers compared with an all-local service configuration. Therefore, agencies face trade-offs between reducing bus running times and reducing total passenger travel time when designing a service plan for these overlapping strategies.
This thesis focuses on developing a methodology for the design and evaluation of service
configurations for limited-stop (or BRT) services overlapping with local services. The developed methodology proposes evaluating limited-stop (or BRT) service configurations by six measures of effectiveness including: market share (passengers always waiting for the limited-stop service, passengers always waiting for the local service, and passengers always taking the first bus that comes), demand split, average passengers per trip, service running times, change in average passenger travel time, and change in corridor ridership.
A model was developed to obtain the proposed measures of effectiveness for user-defined service configurations. This model is an improvement to that developed by Schwarcz (2004) since it allows forecasting ridership changes due to the implementation of these service
configurations, assigns demand using a probabilistic choice approach, and models running time changes when BRT elements are introduced.
The methodology developed to evaluate limited-stop and BRT services was applied to two CTA case studies: Chicago Avenue and 7 9th Street. Different scenarios of limited-stop and BRT
services overlapped with local services were tested, examining variations in stop spacing, service frequencies, and different BRT elements such as: right-of-way segregation, enhanced boarding, and Transit Signal Priority. The results of the analysis shows the critical importance of the enforcement of preferential rights-of-way (in BRT scenarios) to achieve high corridor performance and that frequency shares (the ratio of limit-stop services buses to local buses
serving the corridor in an hour) should be greater than 50% for limited-stop services and greater than or equal to 60% for BRT services. Additionally, total demand, concentration of origins and destinations, average trip length, and trip length distribution were shown to be critical to the effectiveness of limited-stop and BRT services.
Thesis Supervisor: Nigel H.N. Wilson
Title: Professor of Civil and Environmental Engineering Thesis Supervisor: John Attanucci
Title: Research Associate of Civil and Environmental Engineering Thesis Reader: Christopher Zegras
ACKNOWLEDGEMENTS
This thesis is the culmination of 3 challenging years of my life. Coming to MIT was an
experience that taught me to be a better person and to appreciate things I took for granted such as family, love and friendship. I have countless people who I want to thank:
First, I would like to thank to my family for the unconditional support I have received during these years. There was no time that I felt I could not count with my mom Elsa, my dad Augusto, or my sister Yiya.
Second, I offer my gratitude to the MIT faculty members who work with me. I want to thank Professor Nigel Wilson for guiding me through my research always pushing me towards excellence, to John Attanucci and Professor Rabi Mishalani for their guidance during the
research process. Other faculty members I would like to thank for encourage me to come to MIT are German Lleras, Arturo Ardila, and Jorge Acevedo. Also, thanks to the Chicago Transit Authority for making this research possible.
Third, I would like to thanks my 1-235 colleagues including Sean, Hazem, Catherine, DCBS, Martin, Liz, Valerie, Andrew, Winnie, Mike F., Mike H., Mike K., Clara, Yossi, Caroline, Matt, Nihit, Jay, Joe, Albert, Sam, and Miguel. Very special thanks to Tony and Jared for helping carrying out surveys in Chicago during Spring Break and to Ginny Siggia for her helping me with the administrative work. I cannot forget thanking my DUSP friends Renata and Andrea. Fourth, I would like to thank to Candy Brakewood for the unconditional help in Boston,
Chicago, and London; thanks to Andre for the good times helping me to survive my second year; thanks to Carlos Mojica for all the provided help and listening to all my complaints about MIT during the first year; thanks to David Uniman for all the good times and always reminding me that MIT was just a small period of my life; thanks to Juliin G6mez for always laughing about my bad jokes; and thanks to Felipe Delgado for showing me Boston and remembering me there was life outside 1-235.
Fifth, I thank to the people who were in Boston during this 3 years and that I could count with when need it including Tomis, Sandra, William, and Alvaro
Sixth, I would like to thank my Colombian friends who always support me: Pablo Pirraga, Carlos Diaz, Oscar Torres, Juan Diego Villalobos, Walther Garcia, Juan Carlos Rodriguez, and Claudia Diaz.
Last, I would like to thank Andrea Murcia for her love and patience during these years. I am very happy for being at this moment and I am looking forward to spend a long time together.
Today, this is the end of a period of my life but "far from being the end, this is just the beginning" (Gomez, 2010).
TABLE OF CONTENTS
TA BLE O F CO NTEN TS...6
LIST O F FIG URES...9
LIST O F TABLES ... 11
1 INTROD U CTIO N ... 13
1.1 M OTIVATION... 14
1.2 OBJECTIVES ... 15
1.3 M ETHODOLOGY AND APPROACH ... 16
1.4 THESIS ORGANIZATION ... 17
2 LITERATUR E R EV IEW ... 19
2.1 MODELING AND EVALUATING LIMITED-STOP SERVICE: THE SCHWARCZ MODEL ... 19
2.1.1 M odel D escription ... 19
2.1.2 M odel validation... 21
2.1.3 Critical Assessm ent ... 22
2.2 RIDERSHIP ESTIM ATION ... 23
2.3 PASSENGER SERVICE CHOICE ... 27
2.4 RUNNING TIM ES...28
2.4.1 Right-of-way...28
2.4.2 Transit Signal Priority (TSP) ... 29
2.4.3 Queue jumps/Bypass lanes ... 30
2.4.4 Vehicle design and fare collection... 31
2.4.5 Stop spacing... 32
2.5 EXPERIENCES IN CITIES WITH CONVENTIONAL LIMITED-STOP AND BRT SERVICE... ... 32
2.5.1 Transm ilenio... 32
2.5.2 Los Angeles County Metropolitan Transportation Authority (LACMTA): ... 37
2.6 SUMMARY ... 42
3 PREDICTING RID ER SH IP CH A N GES ... 43
3.1 PROPOSED M ETHODOLOGY...44
3.2 MEASURING TRAVEL TIME ELASTICITIES IN THE ASHLAND CORRIDOR IN CHICAGO...45
3.2.1 Service changes on the corridor... 45
3.2.3 Changes in Passenger Travel Tim e ... 52
3.2.4 Travel Tim e E lasticities ... 5 7 3.3 RIDERSHIP CHANGE WHEN IMPLEMENTING BRT LIMITED-STOP SERVICES... ... 59
3.4 SUM M ARY ...--- ....---.----. ... 60
4 BUS SERVICE CHOICE: UNDERSTANDING PASSENGER BEHAVIOR ... 62
4.1 CONCEPTUAL FRAM EW ORK ...--.-.-.-.-.--.-... ... 62
4.2 PROPOSED MODELING APPROACH... ... ... 65
4.3 CTA CUSTOMER BEHAVIOR SURVEY ... 73
4.3.1 S urvey P rocess.. ... ... 73
4.3.2 F ield O bservations ...- ... -. ... . --. 74
4.3.3 D ata A nalysis.... ... ... ... 75
4.4 D ISCRETE CHOICE M ODEL ...- ... ---... ----. . ... 82
5 PROPOSED METHODOLOGY...---...85
5.1 M ODEL A PPROACH ...- -... --... ---... ---... 85
5.2 M ODEL FRAM EW ORK ...---.-...---...---... 87
5.3 M ODEL INPUTS...---- ... - .---.--... 88. 5.4 RUNNING TIME ESTIMATION...-...-... ..---.. 90
5.4.1 Estimate base running times by type ... 90
5.4.2 Compute average m ovem ent speed... 91
5.4.3 D w ell tim e calibration ... 92
5.4.4 Estim ate change in running tim e ... 92
5.5 ORIGIN-DESTINATION (OD) DEMAND MATRIX ESTIMATION...95
5.6 PASSENGER DEMAND ASSIGNMENT AND ESTIMATION OF DEMAND CHANGES...95
5.6.1 P assenger travel tim e estim ation... 96
5.6 2 M arket classification ... 98
5.6.3 Service and Stop Assignm ent... ... .. 99
5.6.4 Example of market classification and demand assignment ... 99
5.6.5 P redicting changes in ridership ... 101
5.7 MODEL OUTPUTS: MEASURES FOR EVALUATING LIMITED-STOP SERVICE CONFIGURATIONS ... 103
5 .7.1 M a rket S h a re ... 10 4 5 .7.2 D em a n d Sp lit ... 10 4 5.7.3 A verage Passengers per B us Trip...104
5.7.4 Running Time Savings/Changes on Speeds ...104
5.7.5 Change in Average Passenger Travel Tim e ... 105
5.7.6 C hang e in R idership ... 105
5.8 SUM M ARY ... . ---... . ---... 105
6 MODEL APPLICATION ... 106
6.1 CHICAGO CORRIDOR APPLICATION... 106
6.1.1 C orridor D escrip tion ... 106
6.1.2 Scenario 1. Conventional Limited-Stop... ... 110
6.1.3 Scenario 2: Moderate BRT enhancements...113
6.1.4 Scenario 3 . F ull B R T ... 117
6.1.5 Summary of Chicago Avenue Corridor Findings ... ... 121
6.2 APPLICATION: 7 9TH STREET CORRIDOR ... 122
6.2.1 C orridor D escrip tion ... 122
6.2.2 Scenario 1: Conventional Limited-Stop... ... 125
6.2.3 Scenario 2: Moderate BR T enhancements...128
6.2.4 Scenario 3: F ull B R T ... 133
6.2.5 Summary of 79'h Corridor Findings ... ... ... 137
7 CONCLUSIONS AND RECOMENDATIONS...139
7 .1 S U M M A R Y ... 13 9 7.2 GENERAL RECOMMENDATIONS... 143
7.2.1 Corridors/Routes with Potential for introducing BRT and/or Limited-Stop Services ... 143
7.2.2 BRT and Limited-Stop Service Configuration Design...145
7.3 C T A R ECOM M EN DA TION S ... 148 7.4 M O D EL L IM ITA TIO N S ... 150 7.5 F UTU RE R ESEA R CH ... 15 1 BIBLIOGRAPHY ... 153 APPENDIX A ... 155 APPENDIX B...158 8
LIST OF FIGURES
Figure 2-1 Conceptual framework of the Schwarcz model ... 20
Figure 2-2 Transmilenio System... 33
Figure 2-3 Articulated and Bi-Articulated Transmilenio Buses ... 34
Figure 2-4 Transmilenio Right-of-Way... 35
Figure 2-5 Transm ilenio station... 35
Figure 2-6 Boarding and ticket validation processes... 36
Figure 2-7 M etro L ocal bus ... 37
Figure 2-8 Metro Rapid System... 38
Figure 2-9 Metro Rapid bus and station ... 39
Figure 2-10 Los Angeles Orange Line... 40
Figure 2-11 Los Angeles Orange Line bus... 41
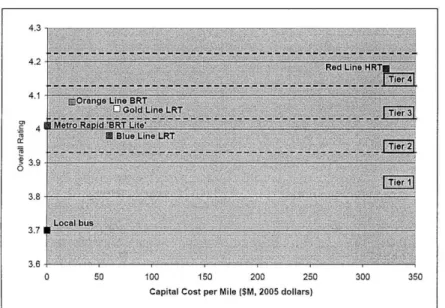
Figure 2-12 Overall customer rating of different transit modes in LA vs. Capital Cost ... 42
Figure 3-1 CTA Routes 9 and X9... 46
Figure 3-2 Combined headways before and after the implementation of Route X9 ... 47
Figure 3-3 Average Daily Boardings Route 9/X9 ... 48
Figure 3-4 R oute 9/X 9 ridership ... 49
Figure 3-5 Route 9/X9 trip length histograms ... 51
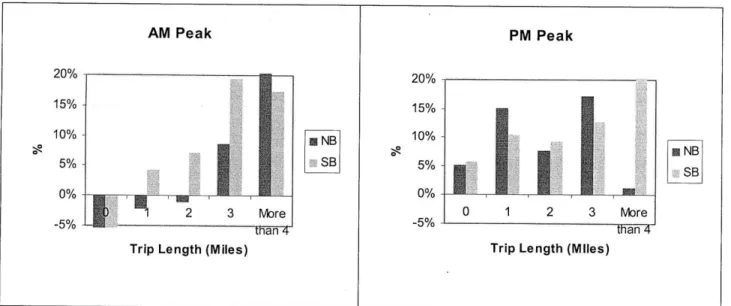
Figure 3-6 Route 9/X9 ridership change by trip length, trip period and direction ... 52
Figure 3-7 Headway variation before and after implementation of Route X9 ... 54
Figure 3-8 Speed profiles before and after implementation of Route X9... 55
Figure 3-9 Changes in travel time weighted by demand ... 57
Figure 3-10 Travel Time Elasticities by Trip Length ... 58
Figure 3-11 Average Travel Time Elasticities by Trip Length... 59
Figure 4-1 Multinomial Logit Model... 64
Figure 4-2 Cross-Nested Logit Model... 64
Figure 4-3 Alternative Cross-Nested Logit Model Structures... 65
Figure 4-4 Example of Path-size definition... 67
Figure 4-5 Access Time Diagram... 68
Figure 4-6 In-Vehicle Time Diagram ... 70
Figure 4-7 In-Vehicle Time for the Local Strategy ... 70
Figure 4-8 Egress Time Diagram... 72
Figure 4-9 Frequency of use and trip purpose during the morning in the Ashland and Cicero co rrid o rs ... 7 6 Figure 4-10 Strategy by local service passengers boarding at a local stop... 77
Figure 4-11 Strategy by local service passengers boarding at a combined stop... 77
Figure 4-12 Strategy by limited-stop passengers boarding at a combined stop ... 77
Figure 4-13 Demand Split between services and stops ... 78
Figure 4-14 Market shares in the Ashland and Cicero Corridors ... 79
Figure 4-15 Demand split of local service passengers boarding at a local stop (N=39) ... 80
Figure 4-16 Demand split of local service passengers boarding at a combined stop (N=8 1) ... 80
Figure 4-17 Demand split of limited-stop service passengers boarding at a combined stop (N = 4 1)... 8 0 Figure 5-1 M odel Fram ew ork... 88
Figure 5-3 Market Classification Example... 99
Figure 6-1 C T A R oute 66 ... 107
Figure 6-2 Route 66 Trip Length Distribution... 108
Figure 6-3 Cumulative AM Peak Eastbound demand for Route 66 ... 109
Figure 6-4 Running Time Components for Route 66 in the AM Peak eastbound... 109
Figure 6-5 Change in travel time by trip length for the limited-stop service only configuration for R o u te 6 6 ... 1 12 Figure 6-6 Change in travel time by trip length for the moderate BRT only service configuration ... 1 1 5 Figure 6-7 R oute 66 L oad Profile ... 116
Figure 6-8 Change in travel time by trip length for the full BRT only configuration ... 120
Figure 6-9 C T A R oute 79 ... 123
Figure 6-10 Route 79 Trip Length Distribution... 124
Figure 6-11 Cumulative AM Peak Westbound demand for Route 79... 124
Figure 6-12 Running Time Components for Route 79 in the AM Peak westbound... 125
Figure 6-13 Change in travel time by trip length for the limited-stop only service configuration for R ou te 6 6 ... 12 7 Figure 6-14 Change in travel time by trip length for the moderate BRT only service co n figu ratio n ... 13 1 Figure 6-15 R oute 79 Load Profile ... 132
LIST OF TABLES
Table 2-1 Typical service elasticities... 25
Table 2-2 Additional ridership impacts of selected BRT components ... 26
Table 2-3 Bus Speeds on Busways and Exclusive Freeway HOV Lanes... 29
Table 2-4 Bus Speeds on Dedicated Arterials ... 29
Table 2-5 Bus Speeds in General Purpose Traffic Lanes ... 29
Table 2-6 Passenger service times with single-channel passenger movement... 31
Table 2-7 Passenger service times with multiple-channel passenger movement ... 31
Table 2-8 Base Running Speeds for Dedicated Arterial Bus Lanes ... 32
Table 3-1 Headways on Route 9 and X9 ... 47
Table 3-2 Frequency split between Routes 9 and X9 ... 48
Table 3-3 Route 9/X 9 ridership split ... 50
Table 3-4 Route 9/X9 average trip lengths (miles)... 50
Table 3-5 Headway Variability for Routes 9 and X9 ... 54
Table 3-6 Average Speeds before and after the implementation of Route X9 ... 55
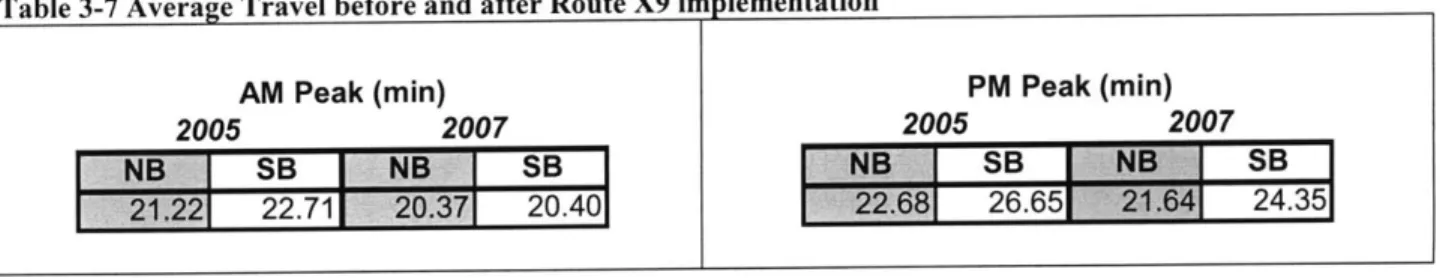
Table 3-7 Average Travel before and after Route X9 implementation ... 57
Table 3-8 Additional ridership impacts of selected BRT components ... 60
Table 4-1 N um ber of surveys by type... 75
Table 4-2 Param eters of the logit m odel... 84
Table 5-1 Passenger service times with single-channel passenger movement ... 92
Table 5-2 Base Running Times for Exclusive Bus Lanes ... 93
Table 5-3 Passenger service times with multiple-channel passenger movement ... 94
Table 5-4 Probabilities, access time, egress time, waiting time, and in-vehicle time ... 101
Table 5-5 Passenger Travel Time Elasticities in Chicago ... 101
Table 5-6 Example of estimating the additional ridership due to Branding ... 103
Table 6-1 Running times components in the Chicago Corridor Scenario 1: Conventional Limited-S top Limited-S erv ice ... ... --- ...- . 1 10 Table 6-2 Chicago Corridor Scenario 1: Conventional Limited-Stop Service... 111
Table 6-3 Running times components in the Chicago Corridor Scenario 2: Moderate BRT S erv ices ...- .... . ----... 1 13 Table 6-4 Chicago Corridor Scenario 2: Moderate BRT Services ... 114
Table 6-5 Chicago Corridor Scenario 2 including the effect of new demand: Moderate BRT S ervices ... . . . . ... .... ... 116
Table 6-6 Running times components in the Chicago Corridor Scenario 3: Full BRT Services 118 Table 6-7 Chicago Corridor Scenario 3: Full BRT Services ... 119
Table 6-8 Chicago Corridor Scenario 3 including the effect of new demand: Full BRT Services . . . . ... - - -- - - . 12 1 Table 6-9 Running times components in the 79th Street Corridor Scenario 1: Conventional L im ited-Stop Service ... 126
Table 6-10 7 9th Street Corridor Scenario 1: Conventional Limited-Stop Service... 127
Table 6-11 Running times components in the 7 9th Street Corridor Scenario 2: Moderate BRT S erv ices ... . --- .. . . . ---... 12 9 Table 6-12 7 9th Street Corridor Scenario 2: Moderate BRT Services ... 130
Table 6-13 7 9th Corridor Scenario 2 including the effect of new demand: Moderate BRT Services ... 132
Table 6-14 Running times components in the 7 9th Street Corridor Scenario 3: Full BRT Services
... 1 3 4 Table 6-15 7 9th Street Corridor Scenario 3: Full BRT Services ... 135
1 INTRODUCTION
Conventional bus services in the largest US cities are characterized by having little or no special infrastructure, low quality waiting areas, no distinct image, and high stop densities. These characteristics often lead to poor performance with slow service, low reliability, and low productivity that has become more severe as congestion has worsened in large cities.
In order to improve bus performance, enhance bus image, and increase ridership, transit agencies can implement different strategies. One no-cost strategy is to increase bus stop spacing; however, for political reasons this is often unacceptable since it will negatively affect people with
disabilities or other mobility constraints. A second strategy is the implementation of limited-stop services overlapping with existing local services. A third, more costly, strategy is the
implementation of Bus Rapid Transit' (BRT) services. There are two options of this latter strategy. The first is to discontinue the existing local service and replace it with a single BRT service. The second is to maintain local service but with a much lower frequency and implement an overlapping BRT service on the same corridor.
This thesis focuses on developing a methodology for the design and evaluation of service configurations for limited-stop services overlapping with local services, and BRT services overlapping with local services. These two strategies have the potential to improve bus performance as well as passengers' perception of bus while still serving people with restricted mobility. Despite the fact that both of these service strategies have been implemented in cities such as Chicago, Los Angeles, New York, and Bogota, and that transit agencies and consultants have developed guidelines on how to implement them, there is no clear framework for the design
and evaluation of service configurations for these types of high quality bus services.
Bus Rapid Transit (BRT) is defined as "a rubber-tired form of rapid transit that combines stations, vehicles, services, running ways, and ITS elements into an integrated system with a strong image and identity". TCRP Report 90. Bus Rapid Transit. Volume 1: Case Studies in Bus Rapid Transit (2003)
One key problem with the design of these services, especially in the context of a constrained operating budget where the existing local service resources are split between the limited-stop service and the local service, is the trade-off between decreasing in-vehicle travel time (by increasing speeds) and increasing out-of-vehicle travel time (by increasing wait times and walk distances). For example, a low stop density configuration can reduce the in-vehicle time (and the running time), leading to a fleet size reduction; but, at the same time, this configuration could increase the access and egress time, to the point that the overall passenger travel time is increased with respect to the base case. Another design challenge with these services is the possible passenger load imbalance between the local and the limited-stop (or BRT) services. For instance, low frequencies on the limited-stop (or BRT) service can encourage passengers to take the local service leading to more crowded local buses and half-empty BRT buses. In addition, when planning BRT services, transit agencies need to assess the effect on route performance (and attractiveness for new riders) of variables such as vehicle size, right of way, transit signal priority, and boarding enhancements.
To address the aforementioned problems, this thesis has as its primary goal to establish a methodology for the design and evaluation of service configurations of limited-stop and BRT services which overlap with existing local services. The configuration and BRT elements studied in this thesis are: bus stop locations (stop spacing), service frequencies (for the limited-stop or BRT service and for the local service), right-of-way (lane segregation level), enhanced boarding elements (i.e. fare media and bus design), and Transit Signal Priority (TSP).
In order to assess different service configurations in a corridor, a model which estimates (for a single configuration) measures of effectiveness (demand split between services, average
passengers per trip for both services, change in passengers travel time, service speed or running times, and change in corridor/route demand) will be developed. The model will be largely based on the one developed by Schwarcz (2004).
1.1 Motivation
Many transit agencies in the US operate both limited-stop and local bus service in corridors with high demand. The combined services have the potential to benefit both the agency and the riders
by reducing passenger travel times and operator cost. However, in a budget-constrained
resource-neutral strategy, the implementation of a strategy with both services leads to an increase in access times and waiting times for some passengers compared with an all-local service
configuration. Therefore, agencies face trade-offs between reducing bus running times and reducing total passenger travel time when designing a service plan for this strategy. Different configurations (varying bus stop densities, vehicle types, frequencies, fare technology, etc.) will result in different operational and infrastructure costs for the agency, as well as in different levels of service for the passengers. The methodology proposed in this thesis will help transit agencies in developing and evaluating service configurations for new or existing limited-stop services overlapping with local services.
In addition, many transit agencies in the US are implementing or considering new BRT services. Some of these are the result of an evolution from conventional limited-stop services, and others are simply improvements to conventional local bus services. When a BRT service is
implemented, there is often a focus on measuring its success by the increase in vehicle operating speeds, with less emphasis on other important measures such as passenger travel time savings, changes in productivity, or passenger distribution between local and BRT service. The
methodology to design and evaluate limited-stop service configurations developed in this thesis will help provide a more balanced assessment of proposed service configurations based on more than one measure of effectiveness.
1.2 Objectives
There are two primary objectives of this thesis. The first is to develop a methodology for the design and evaluation of configurations of limited-stop and BRT services overlapping with local services. The configuration elements within the scope of this thesis are: bus stops locations (stop spacing), service frequencies (for the limited-stop or BRT service and for the local service), right-of-way (lane segregation level), enhanced boarding elements (i.e. fare media and bus design), and Transit Signal Priority (TSP). The second is to apply the methodology to specific routes operated by the Chicago Transit Authority (CTA), examining several configurations, to develop some general recommendations for the design of limited-stop and BRT services, and to
provide specific recommendations to the CTA regarding their strategy to implement and design BRT and limited-stop services.
This thesis addresses the following specific questions:
" How to model the relationship between the service configuration elements and the measures of effectiveness
* How the key BRT elements, the stop spacing, and the service frequency split affect route performance
* How to model the changes in ridership when limited-stop or BRT services are introduced " How passengers choose between local and limited-stop (or BRT) services
1.3 Methodology and Approach
This thesis will be based on a model developed by Schwarcz (2004). This model has certain limitations such as the inability to predict changes in demand as a result of the implementation of limited-stop services, a deterministic approach for assigning passenger demand (between the limited-stop and the local services) which does not recognize that individual passengers have different preferences, and an inability to model BRT services.
For the past decade or so, the CTA has operated numerous limited-stop services. The available information at the CTA largely from Automatic Vehicle Location (AVL) and Automatic Passenger Counting (APC) systems provides detailed information on the changes (i.e. demand, running times, passenger travel times, etc.) in the corridors where limited-stop service has been implemented in addition to providing base data for other corridors where limited-stop or BRT services could be implemented in the future.
To accomplish the objectives of this thesis, the following steps are necessary:
e Review prior research on modeling limited-stop services. This step reviews the state-of-the-art of modeling limited-stop and BRT services, and examines the areas where the previous model requires improvements such as the prediction of ridership changes due to the implementation of limited-stop and BRT services, the modeling of passenger service
choices, and the modeling of running times including the effect of BRT elements. e Develop a methodology for examining and predicting changes in demand. Based on the
experience and data from the CTA and the literature review, this step proposes a methodology to examine the relationship between changes in ridership and changes in travel times (including access, egress, waiting and in-vehicle time), and the effects of branding.
e Develop a methodology for modeling the passenger choices between limited-stop (or BRT) services and local services in the same corridor. A discrete choice model is developed for Chicago corridors based on the experience and data from the CTA, and a survey carried out on several limited-stop and local services in Chicago.
* Develop a new model to design and evaluate service configurations of limited-stop (or BRT) services overlapping with local service. This model evaluates a user-defined service configuration: meaning that the local and limited-stop frequencies and stops are specified, as well as the BRT elements (right-of-way, enhanced boarding and Transit Signal
Priority). The model calculates several measures of effectiveness (based on comparison with the existing local service) including demand split between services, productivity for both services, and changes in passengers travel time, service speed (running times), and corridor/route demand.
e Apply the model to CTA case studies and establish some general recommendations for the design of limited-stop and BRT services. This step interprets the effects of the service configuration elements (stop spacing, service frequencies, etc.) on corridor performance using the measures of effectiveness. Several configurations are examined including a
sensitivity analysis of the different configurations and BRT elements. 1.4 Thesis Organization
This thesis is organized as follows:
Chapter 2 reviews and critiques the Schwarcz model to evaluate limited-stop services, presents a review of the state-of-the-art in the areas where the model needs improvement (including
and limited-stop services), and reviews several cities experiences with limited-stop and BRT services.
Chapter 3 develops a methodology for assessing and predicting changes in demand when conventional limited-stop and BRT services overlapping with local services are introduced. The chapter explores the relationships between changes in passenger travel time (including access time, waiting time, and in-vehicle time) and changes in ridership, based on the experience of limited-stop services in Chicago. The chapter also proposes a methodology for accounting for the branding effects based on the literature review.
Chapter 4 presents a methodology for developing a discrete-choice model for passengers choosing between local and limited-stop (or BRT) services. A specific discrete-choice model is developed for Chicago based on the CTA's AVL and APC data, and a survey carried out during spring 2009 in Chicago. The chapter also summarizes the survey results, and the field
observations.
Chapter 5 describes the enhanced limited-stop and BRT planning model. The new model predicts measures of effectiveness for a specific service configuration of limited-stop (or BRT) service overlapping with local service: the demand split between services, the productivity for both services, and the changes in passengers travel time including in-vehicle and out-of-vehicle time, services speed (running times), and demand.
Chapter 6 applies the model to the Chicago Avenue corridor and the 7 9th street corridor in the
city of Chicago. Several configurations are modeled including limited-stop services overlapping with local services, BRT services (with different levels of lane segregation, enhanced boarding, and TSP) overlapping with local services, and variations of stop spacing and service frequencies.
Chapter 7 summarizes the thesis findings, presents general recommendations for the design of limited-stop and BRT services overlapping with local services, including the impact of the different service configuration elements (stop spacing, service frequencies, right-of-way,
enhanced boarding, and TSP), provides recommendations for the CTA, and presents suggestions for future research on this topic.
2 LITERATURE REVIEW
This chapter is composed of five sections. The first summarizes the methodology proposed by Schwarcz (2004) to evaluate limited-stop bus service configurations and discuses its limitations. The second section reviews the state-of-the-art of how to estimate ridership for conventional limited-stop and BRT limited-stop services. The third section examines the literature in how to model passenger choices when limited-stop services overlap with local services. The fourth section summarizes the literature regarding modeling running times for limited-stop and BRT services. The fifth section reviews several cities' experiences with the aforementioned services.
2.1 Modeling and Evaluating Limited-Stop Service: The Schwarcz Model
Schwarcz (2004) developed a descriptive model to evaluate limited-stop service that assesses future corridor performance based on the current local service and the proposed future service configuration. The performance of a specific proposed configuration is measured in terms of the market share2, the demand split between the local and the limited-stop service, the change in passenger's travel time, and the change in productivity.
2.1.1 Model Description
Figure 2-1 presents the basic framework of the Schwarcz model. The model inputs include, for an specific time period and direction: the resources (number of buses and platform hours), the frequencies of both services, the current and proposed stop locations, the distance between stops, the demand at the stop level, the running times, and the travel time component "weights" (i.e. the relative importance of the various components of trip travel time -walking, waiting, and
travelling on-board the bus- to typical passengers).
2 This measure refers to the percentage of passengers that choose to wait for the limited-stop service, the percentage that choose to wait for the local service, and the percentage that choose to take whichever bus come first.
Figure 2-1 Conceptual framework of the Schwarcz model
The model starts by estimating of the Origin-Destination (OD) matrix of the existing local service. Unless an actual OD matrix is known from a detailed passenger survey, this matrix is estimated based on boardings and alightings counts at the stop level using Iterative Proportional Fitting (IPF) and the methodology proposed by Navick and Furth (1994).
Once the OD matrix is estimated, the model performs the passenger assignment process in three steps. In the first step, the model computes the weighted travel time of every OD combination for three strategies: a) the passenger waits for the local service (local preferred), b) the passenger waits for the limited-stop service (limited preferred), and c) the passenger takes the first bus that
arrives (choice) at a particular stop. The model assumes no access and egress time for any existing passengers travelling between proposed combined stops (stops served by both local and limited-stop buses) and estimates the extra walking (access and egress) times for the passengers boarding and/or alighting at the local-only stops. The waiting times are estimated based on the proposed frequencies and on the expected headway coefficient of variation. The in-vehicle times are estimated based on the distances traveled on the bus and the projected speeds. Equations (2-1), (2-2), and (2-3) show how the weighted travel times are estimated for the three possible strategies.
Assignment
1. Compute Travel Time
components (Access + Waiting
+ In vehicle) for each OD pair,
for three possibilities (Local, Limited, and First Bus) 2.Market Classification. For each
OD pair take the min. travel
time of the 3 cases
3. Assignment.
" Stop assignment. Number of passengers per stop
- Route assignment. Number of local and limited service passengers on
TTLOC =WTLoc -W7T +IVTLoc -W (2-1)
TTLi, =[A Togi + A TDest ]W ± +WT Lim *WWT + IVTLin -WIV (2-2)
TTcloice= A To,,, + (F)- A TDestJ. WAT + WTom -w+ [(1 - F). IVTChoiceLoc + (F)- IVTLim]-W 4 (2-3)
Where: TTLOc, TTLim, TTChoice are the total weighted travel times for local preferred, limited preferred, and choice passengers respectively
WAT, WwT, WIVT are the travel time weights for access, wait, and in-vehicle time respectively. The model accounts for the fact that passengers perceive out-of-vehicle times to be more onerous that in-vehicle time. The suggested weights by Schwarcz are
2.5 for access time, 2 for waiting time, and 1 for in-vehicle time
A Torigin, A TDest, are the origin and destination access times respectively
WTLoc, WTLim, WTCom are the local, limited-stop, and combined service expected wait
times respectively
IVTLoc, IVTLim, IVTChoiceLoc, are the local, limited, and ChoiceLoc in-vehicle times respectively (ChoiceLoc is the in-vehicle time on the local service from the nearest limited-service stop)
F, is the frequency share (the percentage of total bus trips that are provided on the limited-stop service)
In the second step, the model assigns a market share for each OD pair based on the alternative with the minimum weighted travel time (local preferred, limited preferred, or choice). In the third step, the model assigns the current passengers to the bus stops and to the route (local or
limited-stop) based on the market share established in the second step and the frequency share. The results of the second and third steps are aggregated to estimate measures of effectiveness of the proposed service configuration including: the market share (the total amount of passengers in
each of the three strategies), the demand split (number of passengers taking each service), the change in average passenger travel time, and the productivity of each service
(passengers/platform hours).
2.1.2 Model validation
The Schwarcz model was validated by Scorcia using the data from the Ashland Avenue corridor in the city of Chicago where a limited-stop service (Route X9) was introduced overlapping the local service (Route 9) in summer 2006. The data collected before the implementation of the
service was used to predict the change in passenger travel time, services speeds, productivity (passengers/platform hour), market classification, and demand split between routes and compared all these predictions with the actual numbers after 18 months of implementation.
The validation process showed that the predictions of the model were accurate for the demand split, the service speeds, and the productivity. However, the market share prediction could not be validated since it requires a survey where passengers are asked whether they wait for the limited-stop service, wait for the local service, or take the first bus that comes. Route 9/X9 also showed ridership increases above the system average and increases in reliability that were not predictable using the Schwarz model.
2.1.3 Critical Assessment
The Schwarcz model has several limitations. The first is that the model does not predict any change in demand when limited-stop service is implemented. However, transit agencies (including NYC Transit, Chicago Transit Authority, and Metro Rapid in Los Angeles) have found that the introduction of limited-stop service often results in ridership increases. BRT services in North America have also proven to be successful in attracting new ridership. For instance, the experience of six major urban areas, where BRT was implemented, including Los Angeles, Miami, Brisbane (Australia), Vancouver (BC), Boston, and Oakland have shown that "corridor ridership has grown faster than the reduction in transit travel time, suggesting
demand/travel time elasticities over 1.O."(TCRP Report 118, 2007)
The second limitation is that the Schwarcz model assumes that all passengers for a given OD choose the strategy (local preferred, limited preferred, or choice) that minimizes their weighted travel time. In other words, the model performs an all-or-nothing market share assignment. However, while the model seems to give reasonable results, it is well known that individual passengers' decisions are not based only on travel time but are also influenced by many other variables such as socioeconomic characteristics, age, weather conditions, availability of shelters at stops, real time information, trip purpose, and lack of awareness about the limited-stop service.
" The model was designed for limited-stop services and not for BRT services.
" Running times for proposed limited-stop services are estimated with a simple approach based solely on the number of skipped stops.
" It does not account for the effects of branding on ridership changes and on passengers' service choice behavior.
" The model can only test one specific configuration at a time. * It is a descriptive rather than an optimization model.
This thesis is focused on addressing some of these limitations, specifically by estimating
ridership changes, including a probabilistic approach for assigning demand, and allowing one to evaluate not only limited-stop services but also BRT services.
2.2 Ridership Estimation
Conventional limited-stop and BRT services have been successful in attracting new ridership in the US. Nonetheless, there is little prior research on ridership estimation for these services. The information available in the literature is not exclusive to how limited-stop services influence demand but rather discusses how general changes in service characteristics (i.e. fares, travel times, hours of service, and frequencies) affect ridership.
TCRP Report 118 (2007) recommends two approaches for estimating BRT ridership: The first approach is to use either a four-step travel demand model or an incremental logit model. The
four-stop model approach is appropriate for a system (or corridor) over long time horizons and with large-scale investments. The information needed includes estimates of current and future
employment, surveys, land uses, and flows in the corridors. However, TCRP Report 118 (2007) advises that whenever possible, the incremental logit modeling approach should be used instead of running a full-scale travel demand model, since it only requires describing the system
components that are anticipated to change and the individual passenger data for the influence area of the route or corridor under study.
The incremental logit methodology estimates the changes in modal share based on the changes in level of service. The predicted changes in level of service are applied to the base OD matrix to
predict future changes in mode choice. The future mode share is a function of the existing mode share and the change in utility for the mode of interest compared with changes in utility for all modes being analyzed. The utility functions usually include out-of-vehicle time, in-vehicle time, transfers, and fare. The formulation of the incremental logit model is as follows:
P. A.U, (2-4)
Pi P = kv , e AUi
where:Pi is the baseline probability of using mode i P'i is the revised probability of using mode i
AUi is the change in utility for mode i k is the number of travel modes available
The second approach, which is also suitable to conventional limited-stop services overlapping with existing local services, is to apply service elasticities3. The application of the elasticity methodology is more appropriate for short time horizons, small-scale investments, and where the new service is overlaid on an existing service. The procedure consists of applying the various elasticities to service changes (i.e. fares elasticity to fare changes, travel time elasticity to travel time changes, and frequency elasticities to frequency changes).
Service elasticities have been estimated from a variety of sources; however, these values can vary significantly across countries, regions, and cities. For this reason is recommended that each city develop its own values if possible. Table 2-1 presents a summary of the different services elasticities found in the literature.
Table 2-1 Typical service elasticities
Item Travel Time Bus Miles Bus Frequency New routes or routes Service Greater Frequency Application complementing existing expansion of existing route
services
Range -0.3 to -0.5 0.6 to 1.0 0.3 to 0.5
Source: TCRP Report 99 and TCRP Report 118
TCRP Web Document 12 (2000) summarizes how changes in other service attributes (including span of service, out-of-vehicle times, reliability, and new express services) affect ridership. However, the document does not provide elasticities but instead presents evidence from different cases of how changes in these variables affected ridership.
There is consensus in the literature that branding is a major element that can attract ridership to BRT services in addition to service improvements. The branding element is so important that
some critics of limited-stop service, such as the Metro Rapid in Los Angeles, claim that those services are "a triumph of marketing over substance"4.
Different sources including Henke (2006), Baltes (2003), and Tann et al (2009) state that
between 20% and 33% of ridership gains or increases in overall customer satisfaction with BRT service cannot be explained by traditional factors such as travel time, frequency, reliability, or capacity improvements but rather result from improvement in image and perception of the new service (branding).
Despite the fact that different documents acknowledge the effect of branding on ridership, the TCRP Report 118 (2007) is the only document that suggests a method for estimating this effect.
The method can be used either when predicting the new demand with a four-step travel demand model or with an elasticity approach. When using a four-step travel demand model, the report recommends adding a travel time bias constant to the BRT alternative equivalent to up to 10
minutes of in-vehicle time. When an elasticity method is used, the report suggests that BRT could attract up to 25% more riders than that obtained simply by applying elasticities.
Table 2-2, taken from the TCRP Report 118, shows how the different BRT components affect the branding element in the ridership estimation process.
Table 2-2 Additional ridership impacts of selected BRT components
COMPONENT PERCENTAGE
Running Ways (not additive) 20%
Grade-separated busway (special right-of way) 20%
At-grade busway (special) 15%
Median arterial busway 10%
All-day bus lanes (specially delineated) 5%
Peak-hour bus lanes 0%
Mixed traffic 0%
Stations (additive) 15%
Conventional shelter 0%
Unique/attractively designed shelter 2%
llumination 2%
Telephones/security phones 3%
Climate-controlled waiting area 3%
Passenger amenities 3%
Passenger services 2%
Vehicles (additive) 15%
Conventional vehicles 0%
Uniquely designed vehicles (external) 5%
Air conditioning 0%
Wide multi-door configuration 5%
Level boarding (low-floor or high platform) 5%
Service Patterns (additive) 15%
All-day service span 4%
High-frequency service (10 min or less) 4%
Clear, simple, service pattern 4%
Off-vehicle fare collection 3%
ITS Application (selective additive) 10%
Passenger information at stops 7%
Passenger information on vehicles 3%
BRT Brandina (additive) 10%
Vehicles and stations
Source: TCRP Report 118
The proposed methodology can be divided into four steps. The first step is to select and add the BRT points for any components included in the proposed new BRT service to obtain the subtotal. The second step is to add the synergy points; if the subtotal points are greater than 60, the synergy points (15 points) are added, and if not, no points are added. The third is to add the subtotal and the synergy points to obtain the total points. When an incremental logit approach is used, the fourth step is to multiply the total points by 10 and the result is the bias constant that
should be added to the BRT alternative in the discrete choice model. When an elasticity approach is used, the fourth step is to multiply the total points by 0.25 and that number is the percentage increase in ridership (with respect to the baseline riders that choose the BRT service over the local service) due to the branding effect.
2.3 Passenger Service Choice
Previous research on how passengers choose between local and limited-stop services is sparse. TCRP Report 118 (2007) suggests that when a BRT operates as a limited-stop service
configuration overlapping with a local service, the ridership allocation can be based on judgment, equal division between the services, or based on patterns of boarding and alighting and relative travel times. The document recommends that the split should be based upon origin to destination and boarding/alighting patterns, and/or market research but does not present a
methodology.
TCRP Report 118 provides the following set of equations that establish possible demand allocations based on relative running times between the BRT limited-stop and the local service.
P Lim ited + ( 2 -5)R BRT Limited -1 + tBRT (2-6) tBRT ~Limited -1 ±tRT(2) PLimited e I + e tBR T (2-7) e Limited -- 1-t_T P~mtd e 1+e tBR T (2-8)
where:PLimited is the share of riders assigned to the limited-stop service
tBRT is the BRT (limited-stop) service running time relative to local service running time
Chicago showed that similar frequencies on the local and the limited-stop service do not
necessarily lead to similar demand split. In these cases given equal frequencies the demand split ranged between only 33% and 42% riders for the limited-stop service. The reasons for this include the lack of awareness and understanding of the limited-stop service, the small percentage of riders that always take the limited-stop service, and the large percentage of riders that take
5
whichever bus comes first .
2.4 Running Times
This section focuses on the estimation of running times for BRT services since this is more complex than the conventional limited-stop service case.
TCRP Reports 26 (1997), 90 (2003), 100 (2003), 118 (2007), and the NBRTI document (2008) illustrate how each of the BRT components affects running times. The travel time savings of BRT systems are a result of the combination of all the components; thus, it can be hard to isolate the effect of each of them since the results presented in the reports are usually empirical and based on the experience in different cities rather than on a modeling approach. In addition, the
effectiveness of different components depends on the current split of the running time into movement, dwell, traffic, and traffic signal times. For example, a corridor with a small number
of signals and where the bus delays are mainly affected by congestion will benefit more from a completely segregated right-of-way than from the implementation of Transit Signal Priority.
In the next sub-sections the potential travel time savings and speed increases for the different BRT components are discussed.
2.4.1 Right-of-way
The level of right-of-way segregation of the bus system is one of the more important variables affecting speed although speed is also a function of the stop spacing, dwell times, and traffic
signals. Table 2-3 through Table 2-5 summarize bus speeds as a function of stop spacing and dwell times for busways and HOV lanes, for dedicated arterial lanes, and for general purpose traffic lanes respectively.
Table 2-3 Bus Speeds on Busways and Exclusive Freeway HOV Lanes
Average Stop Averae Dwell Time er Sto s secs
Spacing (miles) 15 30 45 60 0.5 26 mph 21 mph 18 mph 16 mph 1.0 34 mph 30 mph 27 mph 24 mph 1.5 38 mph 35 mph 32 mph 29 mph 2.0 41 mph 37 mph 35 mph 32 mph 2.5 42 mph 39 mph 37 mph 35 mph
Note: Assumes 50 mph top running speed in bus lane
Source: Characteristics of Bus Rapid Transit for Decision-Making
Table 2-4 Bus Speeds on Dedicated Arterials
Average Stop Average Dwell Time per Stos (secs)
Spacing (miles) 10 20 30 40
0.1 9mph 7mph 6mph 5mph
0.2 16 mph 13 mph 11 mph 10 mph 0.3 18 mph 15 mph 13 mph 11 mph 0.5 25 mph 22 mph 20 mph 18 mph
Note: Does not include the effect of traffic or signal delays. TCRP Report 100 establishes correction factors for accounting those
Source: Characteristics of Bus Rapid Transit for Decision-Making
Table 2-5 Bus Speeds in General Purpose Traffic Lanes
Average Stop Average Dwell Time per Stops (secs)
Spacing (miles) 10 20 30 40
0.1 6mph 5mph 5mph 4mph
0.2 9 mph 8 mph 7 mph 6 mph
0.3 10 mph 9 mph 8 mph 7 mph
0.5 11 mph 10 mph 10 mph 9 mph
Source: Characteristics of Bus Rapid Transit for Decision-Making
2.4.2 Transit Signal Priority (TSP)
There is no agreement in the literature on how much travel time savings can be attributed to TSP. This is in part because of the different priority treatments available (including passive, active,
real-time, and preemption) and also because transit agencies rarely provide comparable statistics. For example, reductions in traffic delays or travel times are often cited without providing further
detail such as whether these reductions represent a saving of 2 seconds per intersection or 45 seconds per intersection, or whether the travel time savings are estimated for an average passenger trip or for the entire route.
According to TCRP Report 118 (2007), travel time savings associated with TSP in North America and Europe have ranged from 2% to 18% with a typical reduction of 8% to 12%. The Evaluation Report for the City of Los Angeles (2003) established that for the case of Ventura and Wilshire/Whittier Corridors in Los Angeles, where 20% of the base running time was spent at traffic signals, the implementation of TSP reduced the traffic signal time by 35%.
Furth6 acknowledges the difficulty and lack of literature regarding the prediction of travel time reductions as a result of the implementation of a TSP strategy. Furth suggests the following to assess the percentage reduction in time spent at traffic lights:
0 10 to 20% traffic delay reduction for the typical timid priority applied in the US * PLUS 20 to 30% further traffic delay reduction from having a queue jump lane * PLUS 20% further traffic delay reduction from using aggressive priority tactics
2.4.3 Queue jumps/Bypass lanes
BRT vehicles can bypass traffic queues at intersections through the application of a "queue jump" or "bypass lane". TCRP Report 118 estimates that travel time reductions as a result of the application of these elements are between 7-27 seconds per bus intersection with the highest savings during peak periods.
6 Interview by author with Professor Peter Furth. Department of Civil and Environmental Engineering, Northeastern University, 2010
2.4.4 Vehicle design and fare collection
The vehicle size and floor level play important roles in dwell times and can have a major impact on the running times depending on the number of stops, and the total ridership on a route. Wright (2007) stresses that reductions in dwell times are particularly important in high capacity BRT systems where the most efficient vehicle design can reduce passenger service times to as little as 0.3 seconds per passenger (Transmilenio in Bogota).
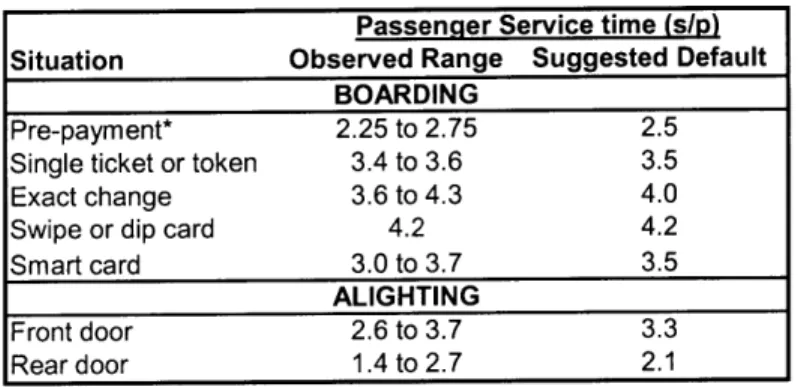
Table 2-6 and Table 2-7 show the service time per passenger on a vehicle with a single door and multiple doors respectively.
Table 2-6 Passenger service times with single-channel passenger movement Passenger Service time (s/p)
Situation Observed Range Suggested Default
BOARDING
Pre-payment* 2.25 to 2.75 2.5
Single ticket or token 3.4 to 3.6 3.5
Exact change 3.6 to 4.3 4.0
Swipe or dip card 4.2 4.2
Smart card 3.0 to 3.7 3.5
ALIGHTING
Front door 2.6 to 3.7 3.3
Reardoor 1.4 to 2.7 2.1
Note: * includes no fare, bus pass, free, and pay-on-exit. Note: Add 0.5 s/p to boarding times when standees are present and subtract 0.5 s/p from boarding and alighting times for low-floor buses
Source: TCRP Report 100
Table 2-7 Passenger service times with multiple-channel passenger movement Available Default Passenger Service Time (s/p)
Door Channels Boarding* Front Alighting Rear Alighting
1 2.5 3.3 2.1
2 1.5 1.8 1.2
3 1.1 1.5 0.9
4 0.9 1.1 0.7
6 0.6 0.7 0.5
Note: * Assumes no on-board fare payment required
Note: Increase boarding times by 20% when standees are present. For low-floor buses, reduced boarding times by 20%, front alighting by 15%, and rear alighting times by 25%
2.4.5 Stop spacing
Stop spacing is the only major design component that a conventional limited-stop service has in common with BRT service. Table 2-8 provides estimates of bus running speeds as a function of stop spacing (without including the effect of dwell time) which are consistent with the average bus speed presented in Table 2-4 for dedicated arterial bus lanes. It is important to recognize that a reduction in stops might result in more passengers at each stop which will offset some of the benefits of fewer stops.
Table 2-8 Base Running Speeds for Dedicated Arterial Bus Lanes Stops per mile
Dwell Time 2 4 5 1 6 1 7 8 10
0 s 2.06 min/mi 2.61 min/mi 2.94 min/mi 3.3 min/mi 3.72 min/mi 4.2 min/mi 5.34 min/mi Note: Interpolated from a Table with a range between 10-60 s dwell times. The original table does not provide numbers for 0 s dwell times but suggests that these values can be interpolated.
Note: The provided values assume no signal or traffic delays.
Note: For Central Business District (CBD): Add 1.2. CBD + Right Turns: Add 2.0. CBD + Right Turns + Lanes blocked by Traffic: Add 3.0.
Note: For Arterial Roads with no traffic: Add 0.5-1.0. For Arterials with mixed traffic: Add: 1.0 Source: TCRP Report 100
2.5 Experiences in Cities with Conventional Limited-Stop and BRT Service
This section describes two case studies of cities with significant experience in the operation with limited-stop and BRT services: Transmilenio in Bogota (Colombia) and Los Angeles County Metropolitan Transit Authority.
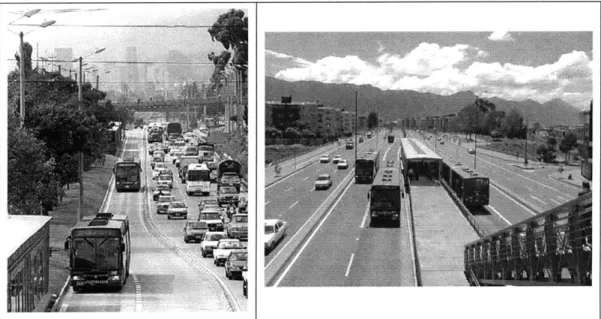
2.5.1 Transmilenio
Bogota implemented the Transmilenio BRT system in December 2000. Transmilenio currently consists of 84 km of interconnected BRT lines, a fleet of 1,074 articulated buses and 5 bi-articulated buses, and 114 stations. An integrated feeder network of 515 km and 438 conventional buses complements the BRT network providing access from surrounding
neighborhoods. Figure 2-2 shows the current system.
Figure 2-2 Transmilenio System
Transmilenio was conceived as a long term expansion plan consisting of seven Phases. At the moment Phases I and II7 have been implemented and Phase III is under construction. However, the implementation plans for the remaining phases are unclear due to the possible
implementation of a rail-based transit system. The plan for Phase III, which had contemplated the implementation of 3 new corridors, has been modified. The new plan includes the original Avenida 26 and Avenida 10 corridors, but the Avenida 7, the third corridor, will possibly include just a segment of the original design, no overtaking lane at the stations, and some priority lanes (different from the fully segregated lanes typical of Transmilenio).
The system is recognized world-wide for many reasons including its high capacity, high level of service, and low cost. During the morning peak period the system carries up to 43,000
7 Phase I included the Avenida Caracas, Autopista Norte, and Calle 80 corridors. Phase II included the Avenida
NQS, Avenida de las Americas, and Avenida Suba corridors IMAPA GENEA
pas/hour/dir (Steer Davies Gleave, 2007) and serves a daily demand of 1.5 million trips that represent 19% of all journeys made in Bogota. Surveys showed that the system was perceived by the great majority of Bogotanos to be a better option than the traditional public transportation
services. Additionally, at least 10% of Transmilenio riders own a private automobile. After the implementation of the first two corridors (Avenida Caracas and Calle 80) bus speeds increased from 12 to 26 km/h in these corridors and the number of accidents in the Transmilenio corridors was also reduced significantly from 1060 to 220 per year, between 1999 and 2001 (Yepes, 2003).
Key elements which allow the system to carry such high passenger volumes with high levels of service include:
High-capacity buses. Transmilenio uses articulated high-floor buses with 160-passenger capacity and multiple wide doors, combined with high platforms to provide level boarding. In August 2009, the system started operating 5 bi-articulated buses with a 260-passenger capacity. Figure 2-3 shows the standard and bi-articulated Transmilenio buses.
Figure 2-3 Articulated and Bi-Articulated Transmilenio Buses
Exclusive lanes. All the corridors allow overtaking. In some cases the system has two exclusives lanes in each direction, and in others the system has one exclusive lane between stations and two
lanes at each station to allow express buses to overtake local buses. Figure 2-4 shows the typical configurations.