The Carbon Footprint Analysis of Wastewater Treatment Plants and
Nitrous Oxide Emissions from Full-Scale Biological Nitrogen Removal
Processes in Spain
byXin Xu
B. Eng., Department of Civil Engineering Southeast University, 2011
Submitted to the Department of Civil and Environmental Engineering in Partial Fulfillment of the Requirements for the Degree of
MASTER OF SCIENCE IN CIVIL AND ENVIRONMENTAL ENGINEERING at the
MASSACHUSETTS INSTITUTE OF TECHNOLOGY June 2013
C 2013 Massachusetts Institute of Technology. All rights reserved.
Signature of Author
Departmentlof Civil and Environmental Engineering March 29, 2013
Certified by
Senior Research Engineer and Lecturer of Civil
E. Eric Adams and Environmental Engineering Thesig Supervisor
Accepted by
Heidi MMNep Chair, Departmental Committee for Graduate Studentl
ARCHNES
MASSACHUSETTS INSTMnEOF TECHNOLOGY
JUL
0 8 2013
The Carbon Footprint Analysis of Wastewater Treatment Plants and
Nitrous Oxide Emissions from Full-Scale Biological Nitrogen Removal
Processes in Spain
byXin Xu
Submitted to the Department of Civil and Environmental Engineering on March 29, 2013 in Partial Fulfillment of the Requirements for the Degree of
Master of Science in Civil and Environmental Engineering
Abstract
This thesis presents a general model for the carbon footprint analysis of advanced wastewater treatment plants (WWTPs) with biological nitrogen removal processes, using a life cycle assessment (LCA) approach. Literature on greenhouse gas (GHG) emissions and LCA are reviewed and the methodology employed in the analysis is discussed. Two selected WWTPs in Madrid, Spain, i.e. La Gavia and Boadilla, are analyzed and the carbon footprints are calculated, using GaBi software by PE-intemational.
In quantifying the N20 emissions from the biological nitrogen removal processes in the WWTPs, huge uncertainty on N20 emission factor is identified and thus a comprehensive study on N20 generation and emission is conducted. Different measurement strategies are investigated and an on-site aqueous N20 measurement is carried out at Boadilla WWTP. Estimation of N20 emission from the plant is given and compared with other calculation results. Recommendations on future measurement campaign are provided at last.
The final results have shown that a big portion of the carbon footprints from the WWTPs is from the indirect emissions of C0 2, which is caused by the intensive energy consumption. However, the emissions resulting from the N20 in biological nitrogen removal processes cannot be ignored. Depending on different estimation methodologies, and the operational conditions that affect the N20 production, the N20 emission can range from 17% to 38% of the total carbon footprint of the WWTP.
Thesis Supervisor: Eric Adams
ACKNOWLEDGEMENTS
I would like to thank everyone who helped us in this project. This thesis would not have been possible without your support.
I would like to thank Dr. Adams, my thesis advisor, and Prof Harry Hemond, my co-advisor, for giving me patient guidance and valuable advice throughout the entire project.
I would like to give special thanks to Emma Montes Parra and Gloria Garralon Lafuente from Cadagua S.A. for allowing us to visit Spain, and Emma's great efforts in assisting me with field measurement. Thanks for being such a wonderful host in Spain and supporting the project. Last but not least, we would also like to thank Dr. Pete Shanahan, Angela Schindler and Laura Morrison for giving us continuous support for the project.
Contents
A CKN OW LEDGEM ENTS ... ... 3
LIST OF TABLES...----..-.. ---... 7
LIST OF FIGU RES ... ---... 8
1 IN TRODU CTION ...-- . ..-- 10
1.1 Background ...---..--- 10
1.2 Project D escription... ... 11
1.3 Objectives ...----. . ---... 11
2 LITERATU RE REVIEW ... 13
2.1 Green House Gas (GHG)...13
2.1.1 Em ission Sources ... 13
2.1.2 Global W arm ing Potential (GW P) ... 14
2.1.3 Direct Em issions... ... .. 14
2.1.4 Indirect Em issions ... 15
2.1.5 Carbon Dioxide ... 15
2.1.6 M ethane ...---... ...16
2.1.7 N itrous Oxide ... ...--- 17
2.2 Life Cycle Assessm ent (LCA)... 17
2.2.1 Concept of LCA ... 17
2.2.2 The LCA Fram ework... 19
2.2.3 Goal and Scope Definition... 19
2.2.4 Inventory Analysis... 22
2.2.5 Im pact Assessm ent ... 24
2.3 Cadagua and its W W TPs ... ... 25
2.3.1 Company Profile...25
2.3.2 La Gavia W astewater Treatment Plant ... 27
2.3.3 Boadilla W astewater Treatment Plant ... 35
3.1 M ethodology ...-- - - - 37
3.1.1 G oal ...- - -. ---... 37
3.1.2 Scope... . - - - --... 37
3.1.3 La Gavia and Boadilla Wastewater Treatment Systems... 37
3.1.4 Functional Unit...-...--. 37
3.1.5 System Boundaries ... 38
3.1.6 GaBi 6 Software ... - --... 39
3.2 R esults ...---... 42
3.2.1 Life Cycle Inventory...42
3.2.2 Data Quality ... 42
3.2.3 M ass Balance ... 43
3.2.4 Life Cycle Inventory of the two WWTPs... 49
3.2.5 GaBi 6 Modeling ... 53
3.2.6 Selected Impact Categories... -- ... 56
3.2.7 GaBi 6 Results for La Gavia WWTP ... 56
3.2.8 GaBi 6 Results for Boadilla WWTP ... 58
3.3 D iscussion...- --... ---... 60
4 N20 EMISSION FROM BIOLOGICAL NITROGEN REMOVAL PROCESS ... 62
4.1 Introduction ... ...---.. 62
4.2 Production and Emission of Nitrous Oxide (N20) from WWTPs ... 63
4.2.1 N itrification ...---... 64
4.2.2 Denitrification...64
4.2.3 N20 Em issions from W W TPs in Spain ... 65
4.3 Literature Review on the Estimation of Nitrous Oxide (N20) Emission ... 67
4.3.1 Various Literature Estimates ... 67
4.3.2 Problems and Challenges with N20 Estimation from WWTPs ... 69
4.3.3 Existing Models for N20 Estimation ... 72
4.4 N20 Measurement at Boadilla WWTP... 74
4.4.1 Field Sampling Site... 74
4.4.2 M ethodology...- ... ---... 74
4.4.3 M aterials... . ---... 75
4.4.4 Sample Collection... - --... 79
4.4.5 D ata A nalysis... . -... ---... 82
4.4.5 N20 M ass Flux and Emission Factor... .. 83
4.5 D iscussion ...- - . ---... 87
5 CONCLUSIONS AND RECOMMENDATIONS... 93
5.1 Conclusions...---... ---... 93
5.2 Recommendations on Future Research ... .... 94
REFEREN CES ... . ---... 95
APPENDIX A GABI MODEL FOR LA GAVIA WWTP... 103
APPENDIX B GABI MODEL FOR BOADILLA WWTP... 112
LIST OF TABLES
Table 1 Global Warming Potential of C02, CH4 and N20 Table 2.1 Removal Efficiency at the La Gavia WWTP Table 3.1 Reported Data Categories
Table 3.2 Electricity Summary
Table 3.3 List of Inputs and Outputs for the La Gavia WWTP Table 3.4 List of Inputs and Outputs for the Boadilla WWTP Table 3.5 LCIA Results from GaBi 6
Table 4.1 Dissolved N20 concentrations Ci (pM) in wastewater at 12 locations Table 4.2 Calculation of N20 mass transfers in divided reactor zones
Table 4.3 Literature reviews on N20 emission factor for full scale BNR WWTPs
LIST OF FIGURES
Figure 2.1 Greenhouse Gas Emissions by Types of GHG
Figure 2.2 Global Anthropogenic Greenhouse Gas Emissions in 2004
Figure 2.3 Methane Emission by Sectors(a) and Nitrous Oxide Emissions by Sector(b) Figure 2.4 Four Phases of LCA
Figure 2.5 Generic Data Collection
Figure 2.6 Treatment Capacity of Cadagua
Figure 2.7 La Gavia Wastewater Treatment Plant Plan View Figure 2.8 La Gavia WWTP Service Areas
Figure 2.9 Schematic Diagram of Treatment Processes at the La Gavia WWTP Figure 2.10 Coarse screen (left) and Fine screen (right)
Figure 2.11 Aerated Grit Chamber
Figure 2.12 Secondary Biological Treatment process
Figure 2.13 Tertiary Treatment: Filtration Tanks and UV Disinfection Figure 2.14 Gasholder for Biogas Produced from Sludge Digesters Figure 2.15 Motor Generators
Figure 2.16 Boadilla WWTP - A20 process (photo by Bo Dong) Figure 3.1 System Boundary of the La Gavia WWTP
Figure 3.2 the La Gavia WWTP in GaBi 6 Figure 3.3 Mass Balance of Flow Rate Figure 3.4 Mass Balance ofNitrogen Figure 3.5 Mass Balance of Phosphorus Figure 3.6 Direct Emissions of CO2 and CH4
Figure 3.7 Primary Treatment Process of the La Gavia WWTP in GaBi 6 Figure 3.7 Global Warming Potential of the La Gavia WWTP
Figure 3.9 Eutrophication Potential of the La Gavia WWTP Figure 3.10 Global Warming Potential of the Boadilla WWTP Figure 3.11 Eutrophication Potential of the Boadilla WWTP
Figure 4.1 Biological nitrogen conversions (Kampschreur et al., 2009) (1) Aerobic ammonia oxidation, (2) aerobic nitrite oxidation, (3) nitrate reduction to nitrite, (4) nitrite reduction to nitric oxide, (5) nitric oxide reduction to nitrous oxide, (6) nitrous oxide reduction to nitrogen gas, (7) nitrogen fixation (not relevant in most WWTPs), (8)
ammonium oxidation with nitrite to nitrogen gas. Complete nitrification comprises step 1 and 2, complete denitrification step 3 through 6.
Figure 4.2 Schematics of different types of process with nitrification/denitrification (Wang et al. 2009): (a) A20 process; (b) Carrousel Oxidation Ditch; (c) UCT process
Figure 4.3 AC'SCENT* Emission Isolation Flux Hood by St. Croix Sensory, Inc Figure 4.4 Cut-away diagram of the SEIFC and support equipment (EPA/600/8-86/008) Figure 4.5 Teledyne API Model T320 Gas Filter Correlation N20 Analyzer
Figure 4.6 Unisense* microsensor(left) and Monometer (right)
Figure 4.7 Schematic of the A20 tanks in Boadilla WWTP and proposed sampling locations Figure 4.8 The set-up for continuous measurement
Figure 4.9 N20 concentrations at 12 sampling points and the averaged concentration in each section
Figure 4.10 N20 volumetric mass transfer coefficients (kLa) from lab-scale stripping experiments and from field measurements (Foley and Lant, 2009)
Figure 4.11 Flow information and concentrations of N species at La Gavia and Boadilla WWTPs
1 INTRODUCTION
1.1 Background
Global climate change, also known as global warming, is caused by the atmospheric build-up of greenhouse gas. The increased concentration of greenhouse gas in the atmosphere directly leads to global temperature rise, which in turn causes sea level rise, flooding, and extreme weathers.
The three major greenhouse gases are generally considered as carbon dioxide (C02), methane (CH4) and nitrous oxide (N20, also known as laughing gas). CO2 is no doubt the most important of all greenhouse gases, followed by CH4, which has a 21 times greater global warming potential (GWP) than CO2 on a 100-year base. Although N20 is the least abundant among these three gases, contributing 4.5 percent of total GHG emissions (USEPA, 2011), the high GWP (310 C02-eq.) of N20 has drawn people's increasing attention.
While people have focused on CO2 emissions from construction, transportation and power generation, wastewater treatment plants (WWTPs) also play a significant role. USEPA (2011) has listed WWTPs as the 7th largest contributors to both CH4 and nitrous N20 emissions. Therefore, in order to reduce GHG emissions, more and more regulators worldwide began to require and enforce mandatory reports and measurements on GHG emissions from WWTPs.
A typical WWTP consists of a series of unit processes including primary treatment, biological secondary treatment, occasional tertiary treatment and sludge treatment. There are multiple sources of GHG emissions (direct and indirect) from WWTPs. The major source of CO2
emission associated with WWTPs is from electricity consumed to operate different treatment processes. CO2 is also a product of aerobic digestion in biological secondary treatment. CH4 is a typical product of anaerobic digestion employed in some forms of primary and secondary treatment and in sludge digestion. N20 is the intermediate product resulting from incomplete reactions in the biological nutrient removal process. The total N20 is also recognized for its uncertainty among the three GHGs.
To properly account for all these emissions over the entire lifetime of a WWTP, a life cycle assessment (LCA) is often conducted. There are various commercial LCA packages on the market; and the GaBi 6 developed by PE International is used in this project.
1.2 Project Description
This project is sponsored by Cadagua S.A., a water and wastewater utility company in Spain seeking sustainable development and commitment to environmental regulations. In order to better understand the real contributions to global warming from wastewater treatment plants in
Spain, they have requested an evaluation of the GHG emissions from WWTPs, and potential methods to reduce such gas emissions, with particular emphasis on N20 emission.
In response to Cadagua's request, a team of three students in MIT's Dept of Civil and
Environmental Engineering's Master of Engineering (Bo Dong, Xin Xu and Jong hyun Lim) visited Spain during January 2012. Based on the visit, the La Gavia WWTP in Madrid was selected as a plant of interest, due to their data availability and the advanced treatment processes. A previous report summarized the team's efforts on performing tasks of detailed literature review on related issues, investigations on quantifying GHG emissions of WWTPs, application of Life Cycle Assessments on the La Gavia WWTP, and the research on potential N20
measurement. In addition to the first visit, Xin Xu paid another visit to Boadilla WWTP in Madrid in October 2012, spending a week measuring aqueous N20 concentrations in the wastewater, as the basis of estimating the site-specific N20 emission. In this thesis, the LCA on the La Gavia WWTP has been revised based on more recently available data, and a new LCA model has been built for the Boadilla WWTP.
1.3 Objectives
Previous studies have been done to quantify various emissions from WWTPs, but they are either on laboratory-scale or site specific. These studies can hardly be applied to any WWTP in Spain. Therefore, the initial goal of this project is to quantify the contribution of WWTPs to global
climate change and to estimate the amount of emissions from each individual process within selected WWTPs.
The Chapter 2 Literature Review describes in detail the GHG emissions, the concept of Life-Cycle Assessment (LCA), the background of Cadagua S.A. and the two WWTPs selected. The three of us wrote this chapter collectively. Chapter 3 provides a comprehensive Life Cycle Assessment of the two plants. A detailed interpretation of the results is presented. Bo Dong
contributed to parts of this Chapter. Chapter 4 mainly addresses the issue with regard to N20 emissions from the biological nitrogen removal processes. Different methods for N20
measurement are discussed and compared. The preparation and performance of the chosen measurement strategy are described in detail, and the results of the measurements are discussed. Finally, Chapter 5 summarizes the results and some recommendations are provided, which provide a good reference for other WWTPs in Spain that employ similar processes. In addition, as parts of the project, Jong hyun Lim did research on LCA of sludge management separately. His work is included as Appendix C in this thesis.
2 LITERATURE REVIEW
2.1 Green House Gas (GHG) 2.1.1 Emission Sources
The three major greenhouse gases are generally considered as carbon dioxide (C0 2), methane (CH4) and nitrous oxide (N20). The estimation of the amount of greenhouse gas emissions can be made by several methods. For example, Figure 2.1 shows the total greenhouse gas emissions by types of greenhouse gases, while Figure 2.2 shows emissions estimated by sectors.
HFCs, PFCs,
N20 & SF,
Figure 2.1 Greenhouse Gas Emissions by Types of GHG (USEPA, 2011)
Waste and wastewater 3% Residential and commercial buildings 8%
Figure 2.2 Global Anthropogenic Greenhouse Gas Emissions in 2004 (IPCC, 2007)
2.1.2 Global Warming Potential (GWP)
The concept of global warming potential (GWP) is defined as the ratio of the radioactive forcing of an instantaneous release of 1 kilogram (kg) of a trace substance relative to that of 1 kg of a reference gas (IPCC 2001). The reference gas used here is C02, with the unit of carbon dioxide
equivalent (C0 2-Eq). Besides, difference gases have different residence times in the atmosphere. The GWP is normally reported on a 100-year base. For example, CO2 itself has a GWP of 1
C02-Eq on a 100-year base. The GWP of CH4 is 21 times more powerful than that of CO2. Hence, the GWP of CH4 is 21 CO2-Eq. Similarly, the GWP ofN20 is 310 C0 2-Eq. Table 1 below shows the GWP of the three major greenhouse gases.
Table 1 Global Warming Potential of C0 2, CH4and N20 (USEPA, 2011)
Gas GWP (CO2-Eq)
(100 year)
CO2 1
CH4 21
N20 310
The term carbon footprint is therefore, defined as the sum of all greenhouse gas emissions and expressed as global warming potential (GWP) in the units of kg C02-Eq.
2.1.3 Direct Emissions
Under the concept of LCA, various emissions to the environment can be further grouped into two categories - direct emissions and indirect emissions. Direct emission is easy to visualize. It includes emissions within the treatment plant, such as non-biogenic carbon dioxide (CO2), nitrous oxide (N2O) and methane (CH4). These gases come from both stationary sources, like biological treatment process, and mobile combustion sources, like cars and trucks. The CO2
emission from secondary biological treatment process should not be counted as a direct emission, due to its biogenic source (i.e., the CO2that is produced is equivalent to the CO2that was
extracted from the atmosphere due to photosynthesis). The detailed discussion of CO2 is shown in Section 2.1.5.
2.1.4 Indirect Emissions
Different from direct emissions, indirect emissions refer to emissions outside plants. However, these emissions are directly caused by the product or process studied. Indirect emissions may include emissions from the electricity purchased from power plants, during transportation and from the production of chemicals. Past researches (Knosby et. al, 2010) have demonstrated that indirect emissions would contribute more than 60 percent of the total greenhouse gas emissions in WWTPs.
Biosolids, as the final product of the sludge treatment, need to be carefully studied in terms of indirect GHG emissions. The transportation of waste biosolids is an important source of
emissions due to fossil fuel combustion. Moreover, the ultimate disposal of the biosolids can also be a source of fugitive N20 and CH4 emissions, especially when waste is placed in landfills or used for composting and agriculture application.
2.1.5 Carbon Dioxide
As shown in Figure 2.1, carbon dioxide (C0 2) contributes to more than 80 percent of total greenhouse gas emissions. It is also the biggest contributor to the carbon footprints of WWTPs. Emissions from both direct sources and indirect sources add up to total CO2 emission.
Some CO2 comes from the secondary biological treatment process as a result of respiration of organic matter (BOD). However, this amount of carbon dioxide is often neglected from greenhouse gas accounting due to its biogenic origins (USEPA, 2006). Tillman el al. (1998) adopted a similar approach in the LCA case study of municipal waste water systems, meaning that the biogenic CO2is excluded from greenhouse gas emission from WWTPs.
2.1.6 Methane
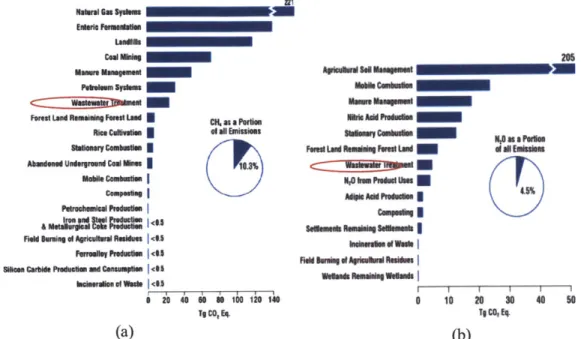
According to USEPA (2011), CH4 results in ten percent of the total greenhouse gas emissions. Figure 2.3(a) shows that WWTPs are the 7h largest sectors that contribute to methane emissions.
ENoi Fn mt
Cia Mhlug -Maur, Maaen
-Faut Lam Rmaq ruod Lu CH, a a Purln ra CdNOVsdn f ell EAisiosa
staenrycanimaen i
Abmadond Underqrend Cia Maei 1.
A M*Jl'"mtA = ial = I a<
FeM Wning el Apicanral RMms |<,
esm Cabid Pauden Ca 4.
0 4 ea 100 120 140 Ti CO, Eq. (a) 205 ApiPM inliaqmpmt
-,h C ' Pr N* Add ftsf-f8biUyn W*Af
-
Nsa~~Farg Lamd I''ing Fest Laud da Emdbil
A mkm PreSe Ub
Isema ReeA8 $Now*e
0 10 20 30 40 50
T1 C0, (b)
Figure 2.3 Methane Emission by Sectors (a) and Nitrous Oxide Emissions by Sectors (b) (USEPA, 2011)
Methane (CH4) can be released throughout the systems where anaerobic conditions exist. Most of the CH4 emissions come from open anaerobic reactors, lagoons and the sludge handling processes. Limited amounts of CH4 can also be emitted from aerobic processes when it is poorly managed. In real practice, CH4 can be neutralized if burned (flared or employing other forms of combustion). Energy, as a byproduct from this neutralization process, can be in turn used to heat the anaerobic digester. Inefficiencies in the CH4 gas collection systems combined with the incomplete combustion of the digester gases can still result in CH4emissions.
2.1.7 Nitrous Oxide
As Figure 2.3(b) shows, nitrous oxide results in 4.5 percent of the total greenhouse gas emissions, which are often overlooked due to its relatively small amount in the atmosphere. It is still a fact that WWTP is ranked the 7th place in nitrous oxide emissions by sectors.
Nitrous oxide (N20) can be generated from a WWTP with a biological nutrient removal process, which is designed to reduce the concentration of total nitrogen in the treated wastewater. N20 is normally considered as a byproduct of the nitrification process and an intermediate product of the denitrification process. The amount of N20 released depends on the operational conditions of the biological nutrient removal processes. In addition, N20 emission can be found in the
receiving water, where treated effluent is discharged.
Although there is a lack of reference for a good estimation of nitrous oxide emissions from WWTPs, the fact is that the N20 emission is bound to increase significantly as stringent effluent nitrogen controls come into force. However, if the biological nutrient removal process is not adopted and excess ammonia continues to pollute the waterways, there would be less N20 emission to the atmosphere and thus lower global warming potential. But another environment impact to receiving water would inevitably arise, i.e. eutrophication, which would result in excessive plant growth and depletion of oxygen in the water. This impact is of greater concern for wastewater treatment plants whose effluents are discharged directly into small rivers or lakes than those into the oceans. This trade-off between the global warming potential and the
eutrophication potential produces a challenge: how to reduce greenhouse gas emissions and at the same time minimize the ecological effects caused by eutrophication.
2.2 Life Cycle Assessment (LCA) 2.2.1 Concept of LCA
Life Cycle Assessment (LCA) is a tool that is used to evaluate the potential environmental impacts of a product, a process or a service. LCA is also the acronym for 'Life Cycle Analysis' or 'Cradle-to-grave Analysis' (Crawford, 2011). As the name 'cradle-to-grave' suggests, LCA involves the assessment of the entire life cycle of the product, from the preparation of raw
materials, the manufacture of the product, and the disposal of waste. LCA provides both a holistic picture of a product's environment impacts, and comparisons between stages of product life.
LCA application on WWTP
As a technical approach, LCA has been applied to WWTP since the late 90s. The links between the environmental impacts and treatment process are the relevant inputs and outputs of the product system (Crawford, 2011). The inputs normally include raw materials and energy. However, outputs may vary in a broad range, including products, emissions to air, emissions to water, solid wastes and other byproducts. As for the case of wastewater treatment plants, the major inputs would be wastewater from sewage collection systems, electricity used for pumping and mixing, and other chemicals added. In contrast, outputs include treated effluent to receiving water, sludge and various gas emissions.
There are several different ways to assess the environmental impact of wastewater treatment plants (WWTPs) under the concept of LCA. According to Emmerson et al. (1995), the life cycle of WWTPs generally involves the construction of phase of WWTPs, production of wastewater phase (or use phase) and the final demolition phase. They also pointed out that both the
construction phase and the demolition phase have only trivial impacts on the environment within the life cycle of the plant. Later researches have placed more focus on the operational phase. Tillman et al. (1998) have studied alternatives for WWTPs in Sweden using LCA approach. And Lassaux et al. (2007) conducted case studies on the anthropogenic water cycle ('from the
pumping station to the wastewater treatment plant'). Other analysis on this increasingly popular topic also includes the comparison of environmental impacts between different WWTPs
(Hispido et al., 2008), the comparison between different LCA methods for WWTPs, and the assessment of WWTPs with seasonal variations (Hospido, 2004).
As mentioned in Section 2.1, both direct emissions and indirect emissions are counted as anthropogenic greenhouse gas emissions. Therefore, in the LCA application to WWTPs, these two emission sources should be both considered.
2.2.2 The LCA Framework
A life cycle assessment is a complex process that involves several different stages. The International Organization for Standardization (ISO) has standardized a framework for LCA. According to the most updated ISO 14040:2006, LCA contains the following phases:
e goal and Scope definition e inventory analysis
e impact assessment e interpretation
The relationship between the different phases is shown in Figure 2.4. Goal and scope definition, inventory analysis and impact assessment are performed in sequence, while interpretation occurs through processes.
Goal and Scope Definition]
I I
Inventory Analysis
I I
Interpretation
Impact Assessment
Figure 2.4 Four Phases of LCA (IS014040:2006)
2.2.3 Goal and Scope Definition
Goal and Scope are stated in the first stage of LCA. The goal statement of an LCA application defines the purpose of the study. It includes parts or all of the following elements: reasons for the
study, type of approach, targeted audience and use of final results. The scope definition normally explains which stage of the product life cycle and what boundaries are considered. ISO
14040:2006 have listed twelve items for scope definition. Some of them include:
e the product system to be studied " the functions of the product/system e functional unit
e impact category selected and methodology of impact assessment and interpretation to be used
e initial data requirement and quality " assumptions
e limitations
* types of critical review, if any
Scope definition is an important step that defines the breadth, depth and details of the study.
Functional Unit
The definition of functional unit is the first key step in goal definition. A product system
normally has several functions that represent different fates of raw materials. The functional unit defines both the type and quantification of the selected product function. It is used as a reference unit and enables the quantitative analyses between inputs and outputs. The concept of functional unit becomes particularly critical when the performances of different product systems are studied. The same functional units allow meaningful comparisons on a common basis. For example, a functional unit could be a ton of concrete or a vehicle seating five passengers.
In wastewater treatment literature, functional units are chosen based on different purposes of study. According to Suh and Roisseacux (2001), it is better to adopt flow rate (volume of wastewater treated within a certain period of time) as a functional unit, because it is clear and easy to establish inventory. Hospido et al. (2008) chose person equivalent as a functional unit for the comparison between different plants. Lassaux el al. (2007) used one cubic meter of water at
consumer tap. However, under certain circumstances, some functional units are interchangeable through a scaling factor. For example, a WWTP has a capacity of treating 1 0,000m3/d. We can set functional units either as 10 ,000m3/d or 1 m3. And the final results will have a
ten-thousand-time difference.
Although a functional unit could be a very small volume or a flow rate in a short time period, it should represent the long-term averaged performance of a WWTP. Details of data collection and quality are discussed in Section 4.1 .1.
System boundaries
In general, a product system consists of several unit processes, and each unit process could have one or more inputs and outputs. Therefore, the system boundary defines which unit processes to include and hence, which inputs and outputs to include. The system boundary may also be
affected by the access to data, relative assumptions, project budget and other constraints.
According to ISO 14040:2006, some processes, inputs and outputs only have minor effects on the final results, and hence they can be excluded from the system boundary.
By the definition from Sonnemann et al. (2004), LCA can be focused on either the life-cycle time boundaries of WWTPs (i.e. construction phase, operational phase and demolition phase) or the geographical boundaries of the anthropogenic water cycle.
Based on the discussion of time boundaries, Lundie el al. (2004) and Lassaux et al. (2006) have demonstrated that the environmental impacts of the construction phase is much smaller than that of the operational phase. The reasonable assumption for the demolition phase is that its
environmental impact is smaller than those of operational phases and construction phases.
From the geographical point of view, conventional municipal WWTPs often include primary treatment, secondary treatment and sludge treatment. These basic processes should be included
in LCA, due to their important impacts on the environment. The availability of other treatment processes, such as tertiary treatment, nutrient removal and disinfection differ from plant to plant.
However, these plant-based processes should be carefully considered, due to their different impacts on the final results.
2.2.4 Inventory Analysis
Life Cycle Inventory (LCI) Analysis, the second phase of an LCA, involves data collection and processing and allocation of resources. Sonnenmann et al. (2004) summarized a four-step methodology in inventory analysis. These steps are:
e data collection " normalization e allocation e data evaluation
However, different literature may have slightly different methodologies. For example, the ISO14040 standard prefers doing normalization in the life cycle impact assessment phase. And the data evaluation step is not unique in LCIA. Instead, data should be evaluated throughout the entire LCA.
Data collection
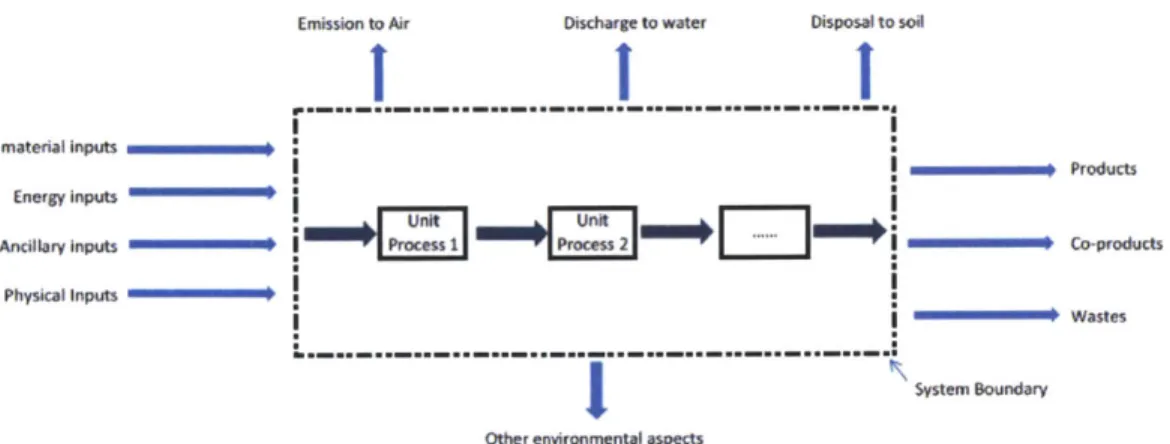
Once the system boundary is well defined, data can be collected according to the inputs and outputs of each unit process. Figure 2.5 describes a generic overview of data collection regarding system boundary. Similar approaches also apply to the individual unit process data collection. In some analyses, data collection could involve intensive labor, time and money.
Emission to Air Discharge to water Disposal to soil
Raw material inputs
Im aIm Products
Energy inputs
-Ancillary inputs Process I IIIIIIII===s " Co-products
Physical Inputs
I I m- Wastes
System Boundary
Other environmental aspects
Figure 2.5 Generic Data Collection
Raw data needs to be further processed before the final life cycle inventory. Besides, the initial data quality must be checked with the following requirements (Sonnemann, 2004):
* time-related coverage e geographical coverage " technology coverage
These requirements guarantee that the final LCA results are valid through a relative long time scale, a wide range of geological locations and a variety of technology mixes.
For the LCA of WWTP, data is mainly gathered from the daily plant operation. The flow rate varies between seasons and even years. An adequate time frame (e.g. 5years) is necessary to eliminate seasonal and meteorological variances. Geographical coverage depends on the goal and scope of study. For a single plant analysis, only local information should be used. Technology coverage reflects the types of technology used, whether a single operation or a technology mix. The wastewater treatment processes could have various treatment technologies for a single stage. For example, sludge digested gas can be ignited, recycled or a mix of both.
Normalization
As discussed in the previous data collection section, raw data needs to be further processed before allocation. This step is called normalization in some literatures. Based on the functional
unit defined in the goal and scope phase, raw data needs to be normalized according to the functional unit. For example, in WWTP, if flow rate is used as the functional unit, all other raw data collected should be recalculated based on this flow rate.
Allocation
Allocation means the distribution of resources, wastes and emission for each single unit process to relative environmental impacts. The functional unit is the key that connects inputs and outputs and connects unit processes.
2.2.5 Impact Assessment
The main purpose of Impact Assessment (LCIA) is to translate the results from inventory analysis to a more understandable and precise interpretation of the environmental impacts of a product system. Despite the requirements for LCI, the three mandatory elements for impact
analysis are:
e selection and definition of impact categories e classification
* characterization
Selection and Definition of Impact Categories
The selection and definition of impact categories are closely related to the goal of the LCA study. Different impact categories may include global warming, eutrophication, human toxicity, and ozone depletion. The results from inventory analysis can then be assigned to the respective impact categories.
Classification
Continued from the impact categories selection step, this step is to assign the LCI results into different environmental impacts. However, it becomes confusing when two or more flows have the same impacts. A characterization factor is defined for each impact category. For example, carbon dioxide (C0 2), methane (CH4) and nitrous oxide (N20) all have impacts on global
warming, but their relative contributions to global warming are different. Therefore, global warming potential (GWP) is used as the characterization factor, with the unit of CO2 equivalent
(C0 2-Eq). From the IPCC report, the GWP for CH4 is 21 C02-Eq. And similarly, the GWP for N20 is 310 C02-Eq.
Characterization
Characterization refers to the calculation of category indicator results. The results from LCI are calculated using the common factors defined in classification. This step can be achieved in various ways, like using matrices. Computer software can also be used to assist calculation.
2.3 Cadagua and its WWTPs 2.3.1 Company Profile
Cadagua, S.A., the sponsor of this project and one of Ferrovial's subsidiaries, is a Spanish company well recognized as a leading force in the field of engineering and construction of water purification and treatment plants.
Founded in 1971 and with 40 years' experience, Cadagua has been very active in the
development of water treatment and desalination. It has successfully designed and built more than 200 water treatment plants all over the world (drinking, wastewater plants, desalination installations as well as industrial facilities), achieving a total treatment capacity of over
14,500,000 m3/d. Over 17,000,000 inhabitants benefit from the company's operation and maintenance services. Figure 2.6 is a chart showing Cadagua's main service areas and installed treatment capacity (Cadagua, 2011)
Million of m3/day 6 5 4 3 2 0 numberof
WWTP DWTP IDAM IWWTP implemented plants
100 73 27 140
Figure 2.6 Treatment Capacity of Cadagua (Cadagua company brochure 2011)
Research, Development and Innovation (R&D&i) Department in Cadagua aims at providing better measure-made solutions for each of the installations, in order to improve global efficiency and lower operation and maintenance costs. Recent projects include process study to minimize
sludge production, nutrients recovery and optimization of power consumption in treatment plants. The project Assessment of the Carbon Footprint in Wastewater Treatment Plants and
Sustainability Analysis for Process Selection is also one of the ongoing projects, with
collaboration with our consulting group LDX Environmental at MIT.
Four WWTPs were visited by our team in January 2012: La Gavia and Boadilla near Madrid, and Ribadesella and Villaperez near Oviedo, Spain. While all four WWTPs were visited data was only collected, and potential measurements are only considered for the La Gavia and Boadilla WWTPs.
Since all four WWTPs employed similar treatment processes, a comprehensive life cycle assessment is carried out on both La Gavia and Boadilla WWTPs based on the data acquired from Cadagua. The GaBi 6 software is used to assist the LCA.
2.3.2 La Gavia Wastewater Treatment Plant
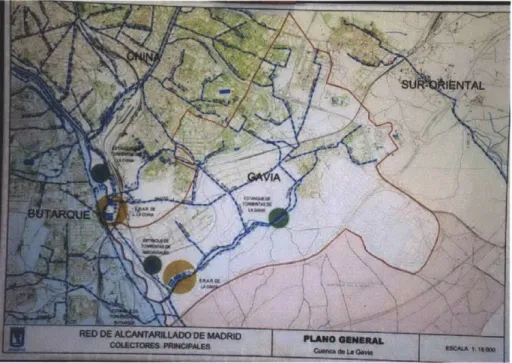
Inaugurated in June of 2005, La Gavia WWTP is located in the district of Villa de Vallecas, in southeastern Madrid. The plant resides on the left bank of the Manzanares River and it treats sewage from the La Gavia I and II sewer mains as well as the surplus that the La China plant cannot handle. Figure 2.7 is a plane view of La Gavia Wastewater Treatment Plant, and Figure 2.8 depicts the treatment plant's service areas (encompassed by red line).
Figure 2.7 La Gavia Wastewater Treatment Plant Plan View
(http://www.acciona.com.au/press/photoGallery/index.php/Water/Waste%20Water%2OTreatnent%20Plants/)
Figure 2.8 La Gavia WWTP Service Areas
La Gavia WWTP treats waste water from about a million people (residential and industrial) and has a designed capacity of 2m3/sec average flow. Using advanced biological treatment processes incorporated with nutrient removal, La Gavia WWTP is able to eliminate 97% of organic matter and suspended solids and about 85% of nitrogen and phosphorous from the water (Table 2.1), thus meeting the strictest sewage treatment standards. The plant is also in line with the National
Sewerage and Wastewater Treatment Plan (1995-2005), which was enforced by the Ministry of the Environment in Spain to improve the quality of water in the Manzanares River.
Table 2.1 Average Removal Efficiency at the La Gavia WWTP (provided by plant operator)
Influent Effluent Removal Rate
mg/ mg/l %
BOD 350 12 97
SS 340 12 96
TN 62 10 84
In addition, the plant is designed to allocate approximately 10% of the treated water to watering green areas using a tertiary treatment process. This is part of the Madrid Water Re-Use Plan, a large-scale strategy to use recycled water for park irrigation and street cleaning services, to the benefit of around three million inhabitants.
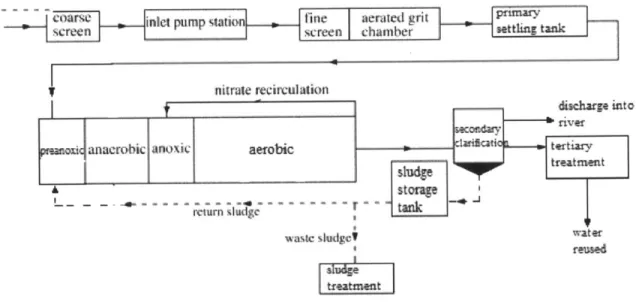
Treatment Processes
inlet pump stao tne aertd gri_
... e.. .... screen ch m e sttling tank
nitrate recirculation
fdischarge into
reanoxi anacerobic anoxic aembic Processes+at ---- Gavia tertiary
Fftreatment tea
Storae
waste sladgeV te
reused treatment
Figure 2.9 Schematic Diagram of Treatment Processes at the La Gavia WWTP
Figure 2.9 shows the simplified schematic of each treatment process employed in the La Gavia WWTP. Basically, the plant consists of two lines, treating wastewater and residual sludge
separately (the figure above shows mostly the water line). There are typically four stages associated with wastewater treatment processes: pretreatment, primary, secondary and tertiary treatment respectively. In case of high flow rate, certain amounts of wastewater are bypassed
after the primary treatment. Some of the functions and design parameters of each stage will be discussed in details as follows.
1) Pretreatment
At the entrance of the plant, wastewater is loaded with a large volume of solids that must be removed so that they won't obstruct the pumps and machinery used in further treatment. This stage is called pretreatment, which can be divided into several parts:
Coarse/wide screens (see Figure 2.10 left) separate large solids and consist of a deep tank, located at the inlet to the treatment plant, where the walls are angled to facilitate the descent of the solids and the sands decanted to a specific area. This treatment typically removes material larger than about 10 or 15 cm.
Fine screens (see Figure 2.10 right) are placed after wide screens. Water passes through a gate that prevents materials (normally of a size greater than 6 cm) from passing by. The bars must be purged continuously, or they will become blocked. This is achieved by means of automatic movable elements that are driven by chains or curved grids with rotating combs.
Figure 2.10 Coarse screen (left) and Fine screen (right) (Photos credit to Bo Dong)
Aerated grit chamber (Figure 2.11) is where grit is removed by aerating and stirring the water with a blower which causes the grit to settle down to the bottom of the chamber while keeping
lighter organic matters in suspension to be processed further downstream. The lightest grease on the water surface is then skimmed out with combs.
Figure 2.11 Aerated Grit Chamber (Photo credit to Bo Dong)
Most waste generated in the pretreatment (sand, grease, large solids) are compacted and
collected in containers. Finally, they are sent to sludge treatment or directly go to landfills where they can be reutilized as fertilizer.
2) Primary Treatment
Primary treatment, usually referred to as primary settling tanks or primary clarifiers, is designed to remove organic and inorganic solids (which could not be removed in the previous treatment due to their small size) by the physical process of sedimentation. There are 6 circular primary tanks in La Gavia WWTP, which allow water to stand for 1.43 hours. Approximately 40 to 60 percent of the suspended solids are removed from the wastewater. The solids that remain in
suspension as well as dissolved solids will usually be biologically treated in subsequent processes. And the debris will settle to the bottom of the tank to form primary sludge.
3) Secondary Treatment
Secondary treatment in the La Gavia WWTP is an advanced biological nutrient removal reactor (BNR), which contains four zones connected in series (preanoxic-anaerobic-anoxic-aerobic). Each zone plays a different role in the removal of nutrient. There are totally 6 parallel reactors, with a total volume of 100,800 m3, and the total retention time is 14 hours.
The preanoxic zone is designed for denitrification and enhanced growth of phosphorus-accumulating microorganisms. Some of the activated sludge from the secondary clarifier is pumped back to this zone (external recycle). In the absence of dissolved oxygen, bacteria utilize BOD in the influent, reducing the nitrates to gaseous nitrogen, thus alleviating the nitrate loading from the return sludge in the subsequent anaerobic zone.
Wastewater treated by the preanoxic zone is then introduced into the anaerobic tank (shown in Figure 2.12 left) in which a phosphorous release reaction by microorganisms occurs under anaerobic conditions.
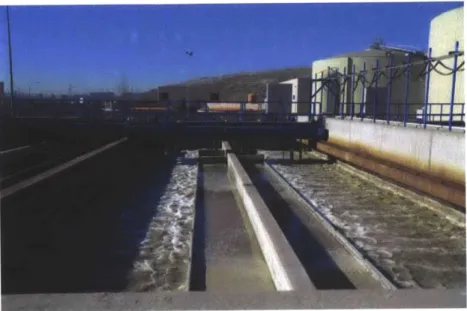
In the anoxic zone, wastewater is mixed with the nitrified mixed liquor recycled from the aerobic zone at an internal recycling rate of 300% of the influent flow. This is the zone where the bulk of denitrification occurs, and where N20 is most likely to be produced. (Sedlak, 1991)
In the aerobic zone (Figure 2.12 right), nitrification takes place where ammonia is reduced to nitrate and nitrite, and luxury uptake of phosphorous also occurs. The aerobic zone is also responsible for aiding the growth of bacteria that feeds on organic matter. In order to assimilate organic matter, these microorganisms require a significant amount of oxygen, which is added through 12,420 submerged membrane diffusers at the bottom of the aerobic tanks. The air added to the water has been conpressed to improve the efficiency.
Figure 2.12 Secondary Biological Treatment process: Anaerobic Zone (left) and Aerobic Zone (right) (Photos credit to Bo Dong)
4) Tertiary Treatment
The design of the La Gavia WWTP initially contemplated the incorporation of a water reuse system in response to the objectives set by the Madrid Water Re-Use Plan. So new tertiary treatment was built which employed a system of filtration and ultraviolet (UV) disinfection
(shown in Figure 2.13). Designed for a flow of 21,600m3/day, to be doubled in a future
enlargement, this will ultimately make it possible to reutilize 25% of the purified water from the WWTP currently in operation. At this time, about 10% of the purified water is treated for reuse.
(Hernanz, 2007)
Figure 2.13 Tertiary Treatment: Filtration Tanks and UV Disinfection (Photo credit to Bo Dong)
5) Sludge treatment
Both primary and secondary processes generate sludge, which consists of mostly water
(approximately 97%) and solids. Therefore, before being treated biologically, sludge is thickened to reduce mass and volume by the partial removal of water. In the La Gavia WWTP, two types of thickening are employed: gravitational thickener for primary sludge and centrifugal thickeners for secondary sludge.
After passing through the thickener, the sludge is taken to separate anaerobic digesters. Anaerobic digestion is a biological process that allows a significant degradation of organic
matter through fermentation carried out by microorganism in the absence of air. Greenhouse gases, particularly methane and carbon dioxide, are produced during this process.
The sludge must be contained within the digesters at a suitable temperature (about 35 C).
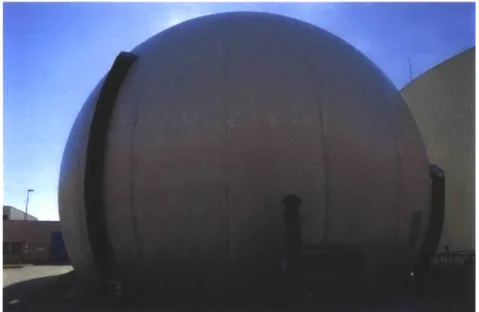
External sources of heat are required in cold seasons. In La Gavia, part of the digester gas is used as feed for cogeneration, providing heat for digestion. The excess biogas is then stored in a storage tank called a gasholder (Figure 2.14) and superfluous gas is burned and released into the atmosphere.
Figure 2.14 Gasholder for Biogas Produced from Sludge Digesters (Photo credit to Bo Dong)
Up to this point in the treatment of sludge, the reduction of water is minimal, which means the sludge still has a large volume. Dehydration is responsible for eliminating, in large part, the water in the sludge. There are four centrifuges serving for this purpose in the La Gavia plant. After this process, the outgoing sludge contains about 75% water, and is transported to another thermal drying plant for further treatment.
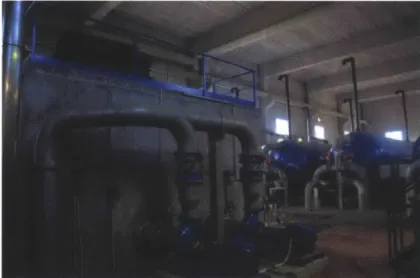
One thing that should be mentioned about the sludge treatment at La Gavia plant is cogeneration, which is the simultaneous production and utilization of electricity and heat. The plant is able to produce electricity at a lower cost to supply other facilities in the plant, and at the same time generate enough heat for sludge digestion at zero cost. There are 3 motor generators (Figure 2.15 shows two of them) in the plant, producing more than 7,000,000 kWh of electricity every year.
Figure 2.15 Motor Generators (Photo credit to Bo Dong)
2.3.3 Boadilla Wastewater Treatment Plant
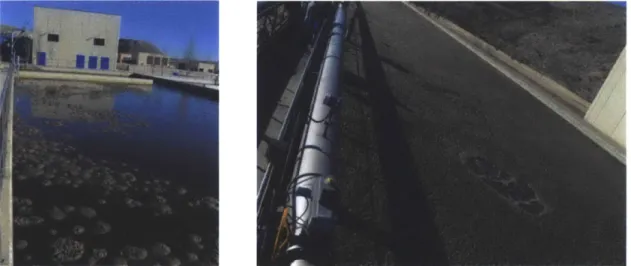
Figure 2.16 Boadilla WWTP - A20 process (Photo credit to Bo Dong)
Boadilla del Monte is a suburb of Madrid, Spain located to the west of Madrid. The wastewater treatment plant at Boadilla was commissioned in 2002, with an average flow rate of 20,000 m3/day serving an equivalent population of about 70,000.
Boadilla WWTP employs a similar treatment process as the La Gavia WWTP described in 2.3.2,
i.e. primary treatment followed by an advance secondary biological treatment with A20 process, except that the A20 process at Boadilla WWTP only includes 3 stages: anaerobic, anoxic and aerobic; there is no preanoxic tanks to begin with. In addition, the plant also has a tertiary treatment for water reuse, which includes an initial stage by sand and anthracite filters followed by ultrafiltration and subsequent treatment by UV disinfection. The treatment is completed with a post-chlorination for distribution. For the sludge treatment process, Boadilla WWTP doesn't employ a cogeneration approach to make use of the digester gas. The gas is well collected, stored and burnt in the end.
Compared with conventional treatment process, the Boadilla WWTP produces treated effluents with average BOD (biological oxygen demand) values typically less than 10 mg/l from domestic sewage and removes at least 98% of the BOD from concentrated domestic wastewaters. The total nitrogen is reduced to below 15 mg/l with a removal rate of about 75% and total phosphorus in the effluent is less than 2 mg/l.
3 LIFE CYCLE ASSESSMENT OF THE LA GAVIA AND BOADILLA WWTPS
3.1 Methodology 3.1.1 Goal
In response to the request for carbon footprint analysis by Cadagua S.A., the purpose of the life cycle assessment (LCA) is to study the potential environmental impacts of the wastewater treatment plant (WWTP) in Spain, based on the data provided by Cadagua. Particularly, the global warming potential (GWP) is the key impact of interest.
The target audiences of this study are Cadagua S.A., MIT department of Civil and
Environmental Engineering, LCA practitioners and scientists, and the general public. The experts from Cadagua S.A. could use the results from this study to improve the treatment processes of the WWTPs in their service area, regarding carbon footprints. Other experts can also apply the model proposed in this study to other treatment plants with similar processes.
3.1.2 Scope
The scope definition normally explains which stage of the product life cycle and what boundaries are to be considered.
3.1.3 La Gavia and Boadilla Wastewater Treatment Systems
The La Gavia and Boadilla WWTPs have collectively four major treatment processes: primary treatment, secondary treatment, tertiary treatment and sludge treatment. The functions of each treatment have been carefully discussed in Section 2.3.2.
3.1.4 Functional Unit
Flow rate is used as the functional unit for this study. It is defined as the volume of wastewater per day (m3/d) at the inlet point of the WWTP. 74249 m3/d is the daily averaged flow rate of the La Gavia WWTP, while 9346 m3/d is the daily averaged flow rate of the Boadilla WWTP. The functional unit can also be converted to 1 cubic meter of wastewater treated by a scaling factor of
1/74249 or 1/9346.
3.1.5 System Boundaries Time boundary
The three phases of a WWTP have been defined as the construction phase, the operational (use) phase and the demolition (end-of-life) phase. During the life cycle of a WWTP, the operational phase has the dominant impact of all phases. In addition, access to the data for the construction and demolition phases is limited. Therefore, within the scope of this project, only the operational (use) phase will be included.
Spatial Boundary
Within the operational phase of a WWTP, all treatment processes should be included. ISO 14040:2006 also suggests that resources need not be expended on the quantification of processes that will not cause significant change in the final outcome. Based on the operational data given by Cadagua S.A., the operation of tertiary treatment is season-dependent. On a yearly average, it handles only about 0.5 percent of the total wastewater inflow (400m3/day out of 75300m3/day). However, tertiary treatment was still included in this study. By contrast, we are omitting analysis of the bypass flow after the primary treatment process, which happened only twice in the year 2011 (Oct 20thand Oct 23d) in La Gavia WWTP. The bypassed flow rate is less than 0.1 percent (71m 3/day out of 75000m3/day).
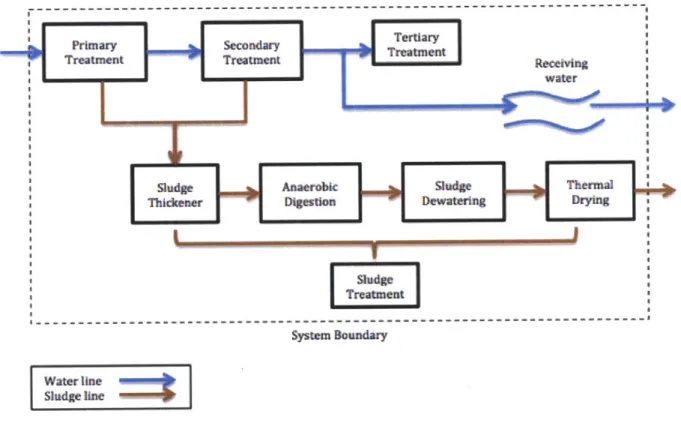
Figure 3.1 shows the system boundary of the LCA study of the La Gavia WWTP. The four processes are primary treatment, secondary treatment, tertiary treatment and sludge treatment (incluing sludge thickener, anaerobic digestion, dewatering and thermal drying). For simplicity, the pumping, pretreatment and primary treatment processes have been combined into one single process-primary treatment. The blue arrows represent the water line, while the brown arrows stand for the sludge line. The dash-line box is the system boundary. Figure 3.1 does not represent all the environmental flows that go in or out of the system. Other inputs and outputs include electricity, chemicals and gas emissions.
As shown in Figure 3.1, wastewater is introduced from the sewer system to primary treatment. It is further treated in the biological secondary treatment process with nutrient (N and P) removal. Finally, the secondary effluent is discharged into the receiving water, with portions being treated
in tertiary treatment for irrigation purpose. The impact of the WWTP on the river has been included.
For the sludge line, the primary and secondary sludge are combined after sludge thickener. The sludge is further treated in the anaerobic digestion and dewatering following the thermal drying process. The dried sludge, either sent to landfills or used as fertilizer, is not discussed in this LCA report.
Primary Secondary Tder
Treatment TreatmentTramnReevg
Swater
Sludge Anaerobie Sludge Thermal
Thicktener Digestion Dewatering Drying
Sludge Treatment
System Boundary
Water line Sludge line
Figure 3.1 System Boundary of the La Gavia WWTP
3.1.6 GaBi 6 Software
The GaBi 6 is the most updated version of the GaBi software, developed by PE International. The GaBi 6 software system offers access to comprehensive and user-friendly functionality to analyze product life cycles or process technologies. The software is able to deal with life cycle assessment (LCA), product carbon footprints, life cycle costs and other social and environmental applications. The software also allows access to the GaBi database, which contains thousands of processes and hundreds of processes. (PE America, 2012)
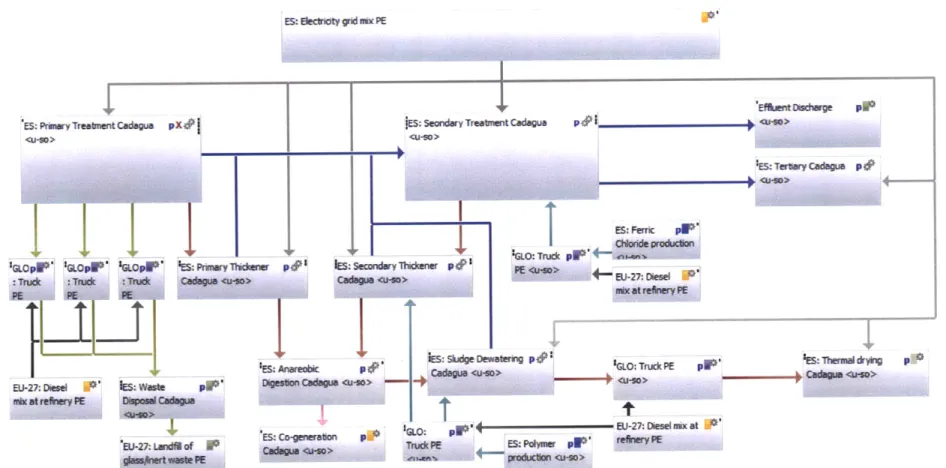
Within the GaBi 6 software, the treatment plant can be viewed as a huge 'plan', which includes several processes. In addition, the inputs and outputs for each process are modeled as 'flows'. Figure 3.2 is from GaBi 6. It shows the La Gavia WWTP model in the software interface. Each rectanglar box represents a process. Besides the wastewater treatment processes mentioned above, there are the electricity generation process, sludge transportation and the effluent discharging process. In the figure, each arrow-head line represents a flow. The blue lines
represent water line. The brown line represent the sludge line. And the grey lines stand for either electricity or disel.
La Gavia WWTP Compete
GAO Mccee PIMtfww"c quvtm
The namma C( the beec P&SM es atshwr
SdedMMM a GMvi
ES: Electrictygid mocPE
ES: Privwy'Tenn Cadea pX6* i
'GLOpPl GLOpP' 16LOPW', ES: Prirwythiw
'ES EUJ-27: Diesel P ixat reftwy PI IES. Waste aJ-Th Ladil I __ f
I
1ES. Seondry Trew enCadagua
P *
IES Tetiay Cague
w#1
I I
Anareabit pip,Pp.' Dge~stonCade s ~o>
-ES:Co-geneuabon pP I
PE
Ijw
ES. Ferrc p9r*
BJE-27: INeeeII
ix atrehwyPE
iES: Skidg DewateiM~ p# 1GLO: Truck PE
Cadaga <u-G _____ PIP, h6,rem&*
c aow 4&w>
IL
TL
10: Pp@ 4 ' E-27-Dieselivixat
rnuc P ESPadww P re**IVPE
Figure 3.2 The La Gavia WWTP in GaBi 6
P * ks: Seandary V d
3.2 Results
3.2.1 Life Cycle Inventory
The life cycle inventory analysis includes data collection, normalization, allocation and data evaluation. In this analysis, the normalization and allocation will be done by the GaBi 6 software.
3.2.2 Data Quality
With coordination from Cadagua S.A., the raw data are obtained from daily operation of the La Gavia and Boadilla WWTPs in year 2011. The daily operational data are reported in the
following categories: water flow, sludge, gas, energy, incidents and hours of operation. The detailed explanations for each category are shown Table 3.1 below:
Table 3.1 Reported Data Categories
Category Explanation
Flow rate for each treatment process (primary, secondary, tertiary...) is recorded Water Flow in volume (103
M3
)
Sludge is reported in volume (M3). It includes volumes for every sludge production and treatment process
Gas is generated from the anaerobic digestion process. For La Gavia, gas is collected and used in boilers, cogenerators and torch. For Boadilla, gas is burnt in torch. The amount of gas is reported for every source and sink. The reported unit is normal cubic meter (Nm3)
Electricity consumptions for La Gavia come from two part, self-production and Energy purchase, while all the electricity consumed in Boadilla is purchased from
power plant. The reported unit is kWh.
Incidents This category includes weather and operational incidents, such as rainfall and foaming
Hours of The WWTP operates continuously in a year. The hours of operation records operational hours of each engine (pump, boiler and etc.). This data is only Operation available for La Gavia WWTP.
The raw data is further treated by taking a daily average. It represents the daily average quantity for treating 74249 m3/d (La Gavia) and 9346 m3/d (Boadilla) of wastewater.
3.2.3 Mass Balance
In order to gain comprehensive understanding of the plants' operational conditions, mass
balances have been done on flow rate, total nitrogen and total phosphorus, for both La Gavia and Boadilla WWTPs. The mass balance of carbon is not necessary and somehow complicated. Hence, the mass balance of carbon is not performed. In this section, La Gavia WWTP is taken as an example to demonstrate the mass balance calculations.
Flow rate
Figure 3.3 shows the overall mass balance of flow rate for La Gavia WWTP. For example, the primary treatment process receives 74249m3/day of wastewater from the sewer system. After the treatment, 3191 m3/day of sludge and a total of 3634 kg waste (including screenings, grit and grease) are generated, leaving 71058m3/day of wastewater in the primary effluent.
These flow rates are the daily average for 2011. The original flow information is recorded on a daily basis (weekdays) from the end of December 2010 to the start of January of 2012. The arithmetic average is taken to offset seasonal variances. The numbers are all in m3/day, except for the dried sludge after dewatering, which is expressed as kg/day.
The average flow rate cannot be balanced perfectly, due to the discrepancies from measurements and other unknown sources and sinks (rainfall, leakage and overflow). However, the errors are less than two percent of total flow. In practice, the flow rates have been adjusted accordingly to ensure arithmetic consistency.
13'63kg
Sludge
Water line
Treatment
Sludge Mie .IW
Figure 3.3 Mass Balance of Flow Rate
Nitrogen
Nitrogen is reported by the total nitrogen concentration and its relative content, namely, nitrate (N03~), nitrite (NO2~), ammonia (NH4*), and total Kjedahl nitrogen (TKN). Figure 3.4 shows the mass balance of total nitrogen. The unit is 'ton/day'. In general, total nitrogen can be calculated by the following formula:
Mass flow rate (mass/d) = Flow rate (volume/d) x Concentration (mass/volume) For example, the total influent nitrogen, 4.6 ton/d, is the product of 74249 m3/d and 62 mg/L.
The only exceptions are nitrous oxide (N20) and nitrogen gas (N2). Since there is no direct way to calculate N20, the EPA formula (USEPA, 2011) is used:
N20 = Population x EF x FIND-COM
where,
N20: N20 emissions from centralized wastewater treatment plants with nitrification /denitrification (g/year)
Emission factor (3.2 g N20/person-year)
FIND-COM: Factor for industrial and commercial co-discharged protein into the sewer system (1.25)
The total population in La Gavia service area is estimated as 950,000. Therefore, the N20 direct emission is roughly 0.0104 ton/d. We can also express it as N20-N, which is 0.0066 ton/d.
During secondary treatment, the nitrogen sources are from the primary effluent and the recycled sludge. The sinks, on the other hand, include secondary effluent, secondary sludge, nitrous oxide and the nitrogen gas (N2). Nitrogen gas can be then calculated by mass balance.
NZ0 N2
0.0066 3.41
4.6 4.22 0.77 0.77 Triart
Treatment Treatment Receivng
0.38 0.03 0.77
OA A
Sludge OI Aarbc A Sludge Therma
Tidkener Dlgesion Dewatering I Drying
water line
ETreatmentI
Sludge line
Figure 3.4 Mass Balance of Nitrogen
Phosphorus
Compared with nitrogen, phosphorus is easier to analyze. Figure 3.5 shows the mass balance of total phosphorus. Phosphorus is removed by the addition of ferric chloride (FeCl3). The total phosphorus is reported by the amount of inorganic phosphorus (P04~) and organic phosphorus.
45