Development of Biomimetic Microfluidic Adhesive Substrates
for Cell Separation
by
Chia-Hua Lee
C
MASSACHUSETTS INSTt1UTE OF TECHNOLOGY B.S., National Taiwan University, Taiwan (2003) OF.TECNOLOG
M.S., National Taiwan University, Taiwan (2005)
MAY 14211
M.S., Massachusetts Institute of Technology, USA (2008)
LiBRARES
Submitted to the Department of Materials Science and Engineeringin Partial Fulfillment of the Requirements for the Degree of Doctor of Philosophy
at the
MASSACHUSETTS INSTITUTE OF TECHNOLOGY
February 2014
© 2014 Massachusetts Institute of Technology. All rights reserved
Signature of Author
Department of Materials Science and Engineering January 10 th014
Certified by
Rohit Karnik Associate Professor of Mechanical Engineering Thesis Co-advisor
V Krystyn J. Van Vliet
Associat Pr fessor of Materials Science and Engineering Thesis Co-advisor
Accepted by
Development of Biomimetic Microfluidic Adhesive Substrates
for Cell Separation
by
Chia-Hua Lee
Submitted to the Department of Materials Science and Engineering on January 10th 2014
in partial fulfillment of the requirements for the Degree of Doctor of Philosophy in Materials Science and Engineering
ABSTRACT
Cell separation is important in medical, biological research, clinical therapy, diagnostics and many other areas. The conventional methods of cell sorting have limited applications due to sophisticated equipment settings, high costs, or time-intensive and labor-intensive processing steps. Inspired from natural cell sorting system-cell rolling, a novel microfluidic device design was proposed for point-of-care and point-of-use applications. It relies on interaction of cells with biomimetic adhesive substrates comprising multiple inclined, asymmetric bands of weak adhesive molecules. Such device design allows continuous sorting of cells without irreversible capture of cells. To realize such device, comprehensive studies of how cells settle onto the substrate, how cells capture by the substrate, the effect of substrate parameters on separation potential, and selection of adhesion molecules are needed to optimize device performance.
In this thesis, first, how the cells settle and how they are captured by the receptors were studied using HL60 cells as a model leukocyte cell line and P-selectin as a model receptor. Settling distance of HL60 cells under different shear stresses inside microfluidic channels was identified from the study of convection velocity of cells at different position along the channel. The results show that settling distance increases with increasing shear stress. Cell capture was then quantified by characterizing how far settled HL60 cells travelled before they were captured by P-selectin molecules, defined as the attachment distance. Cumulative probabilities of attachment distance of cells at different shear stresses revealed that increasing shear stress results in exponential increase of the attachment distance of cells by receptor molecules. An empirical model was developed to predict capture probability by an inclined receptor band and the prediction value was verified by experimental data from a device.
Second, a patterning method involving microcontact printing was developed to create biomimetic adhesive substrates comprising multiple inclined receptor bands of P-selectin molecules. The patterned substrates were then used to study how transport of HL60 cells can be controlled by the substrate parameters including pattern inclination angle with respect to shear flow direction, shear stress magnitude, and P-selectin incubation concentration. The effects of substrate parameters were quantified in terms of the edge tracking length, lateral displacement, and the rolling velocity. The edge inclination angle was identified as the strongest modulator of edge tracking length on a single band for captured cells. To study optimization of the device design, experimental data of cell settling, cell attachment, and edge tracking length were integrated into a model to predict device performance including device capture efficiency and total lateral displacement. General guidelines for microfluidic device design were established based on the results from the model: smaller band width, edge angle of 15-20', and lower shear stress.
Finally, to develop new specific receptor-ligand systems, M13 pVIII and pIll phage libraries were used for selecting peptides with affinity to CD4 proteins. Screened phage from pVIII library was immobilized on the gold surface and capture efficiency of CD4+ cells were characterized. The interaction between selectin phage and CD4+ cells were demonstrated to be CD4-dependent. Moreover, the selected phage from pIII library and the corresponding synthetic peptides were demonstrated to exhibit specificity to CD4 proteins.
In summary, this thesis focuses on development of biomimetic adhesive substrates for microfluidic devices involving transient interactions between the cells and the receptor-patterned substrates. How cells flow and get captured by receptor-patterned biomimetic substrates inside the microfluidic channels, how substrates parameters affect cell rolling trajectories and device performance, and how to identify new receptor-ligand systems were discussed in this thesis. This study has led to realization of a microfluidic device for separating neutrophils from blood. This microfluidic system provides continuous sorting without irreversible capture of cells, and is believed to be an effective method that can potentially be used in many point-of-care applications.
Keywords: microfluidics, cell separation, cell rolling, selectin, biopanning, M13 Thesis Committee:
Prof. Rohit Karnik, Associate Professor of Mechanical Engineering, MIT. (Thesis Co-advisor) Prof. Krystyn J. Van Vliet, Associate Professor of Materials Science and Engineering, MIT. (Thesis Co-advisor)
Professor Angela M. Belcher, Professor of Materials Science and Engineering, MIT. Professor Darrell J. Irvine, Professor of Materials Science and Engineering, MIT.
Prof. Jeffrey M. Karp, Associate Professor of Medicine, Harvard Medical School, Brigham and Women's Hospital.
Acknowledgements
My time at MIT has been an incredible journey. I owe thanks to many people for their guidance, support, encouragement, patience, and friendship.
I would like to express my gratitude to my PhD thesis advisors (Prof. Rohit Karnik and Prof. Krystyn Van Vliet) and my committee members (Prof. Angela Belcher, Prof. Jeffrey Karp and Professor Darrell Irvine) for all their support and guidance, which without, this thesis could not have been achieved. Prof. Kamik, especially, has been an exceptional role model and mentor to me. He has been always there to listen and give advice with his patience. His unflinching encouragement and support have helped me overcome many crisis situations and finish this dissertation. I am also deeply grateful to Prof. Van Vliet for the discussions that have helped me sort out a lot of technical details of my work in the past few years. She has left her mark on me with her professionalism and encouragement of my work. Moreover, my thesis work would not have been possible without the support from Prof. Belcher. It has been an extraordinary experience for me to work in her lab, too. Her insightful comments and constructive criticisms have helped me in all the time of my research work. Prof. Karp has offered fresh perspectives on this work, which have motivated its completion. Prof. Irvine has offered many advices over the course of the thesis and for that I am grateful as well.
I am lucky to have interactions with three amazing groups of people (the Kamik group, the VV group and the Belcher group) that I have ever had the opportunity to work with. In particular, Suman in the Kamik group trained me in nearly every critical area and offered much help and guidance to me. Chong also provided invaluable assistance for my research, too. Jongho, Marco, Jong-Min, Sean, Tarun, Mike, Sunandin, Sung-Yong, Hui-Ying, Minsoung, Mohamed, who joined the Kamik group well after me, have been valuable friends and colleagues throughout. I also greatly appreciate that the VV group members always give me their full support. From Belcher group, I especially owe much to Nimrod, Rana, and Gaelen, who have all actively contributed to my work with suggestions and feedback. I also thank other Belcher members who have offered much help to me.
There have been innumerable others at MIT who have affected my life here and I would like to express my gratitude to them as well: Prof. Karen Gleason, Prof. Sang-Gook Kim, and Prof. Samuel Allen, Richa, Yin, Jane, Yvonne, Liang-Yi, Yi-Chun, Po-Yen, Alina, Ting-Yen, Chia-Hou, Alice, Sabrina, Hao-Wei, David, Yu-Chung, Wei-Shan, Lei, Xiaoting, Hyeongho, Benita, Geetha, and Meri. Moreover, I would like to thank Hisn-Ying, Ivy, Kevin, Ying-Chieh, Jiun-Tai, and Min-Chen for their friendship for years. Last, but not the least, I would like to specially thank my family: my grandparents, my parents, Chung-Yi, Wan-Yu, and Yueh-Hsun for their love and support.
1 Introduction...19
1.1 Background and M otivation... 19
1.1.1 Surface Marker-Based Cell Separation ... 20
1.1.2 Low Affinity Based Separation ... 23
1.1.2.1 C ell R olling ... 24
1.1.2.2 Cell Rolling-Based Separation...28
1.2 Scope of the Thesis W ork ... 31
1.3 C hapter R eference ... 32
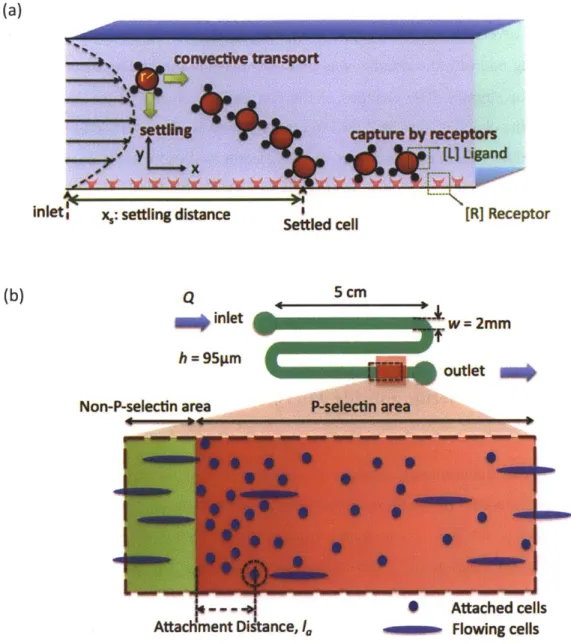
2 Free-Flow Travel and Capture of HL60 Cells inside Microfluidic Channels...37
2.1 Introduction ... 37
2.2 Part A. Cell Settling inside Microfluidic Channels... 40
2.2.1 Fabrication of Substrate and Microfluidic Channel ... 40
2.2.1.1 M aterials... 40
2.2.1.2 Fabrication of Substrate Incorporated PDMS channel...41
2.2.2 Convection Velocity Experiment ... 41
2.2.2.1 C ell C ulture ... 41
2.2.2.2 Experim ent Setup ... 41
2.2.2.3 Results and Data Analysis...42
2.3 Part B. Attachment Distance of the Cells in the Microfluidic Channel...46
2.3.1 Fabrication of Substrate and Microfluidic Channel ... 46
2.3.1.1 M aterials... 46
2.3.1.2 Fabrication of Substrate Incorporated PDMS channel...47
2.3.1.3 Substrate Characterization ... 47
2.3.2 Cell Capture Experiment ... 48
2.3.2.1 Cell Culture and Experiment Setup...48
2.3.2.2 D ata A nalysis ... 48
2.3.3 Flow Cytometry Analysis...54
2.4 C onclusion ... 55
3 Lateral Displacement of HL60 Cells Rolling on Inclined P-Selectin
Adhesive Bands...59
3.1 Introduction ... 59
3.2 Fabrication of P-selectin-Patterned Substrates... 61
3.2.1 M aterials... 6 1 3.2.2 Fabrication of PDMS Stamp ... 61
3.2.3 Fabrication of Patterned Substrates ... 62
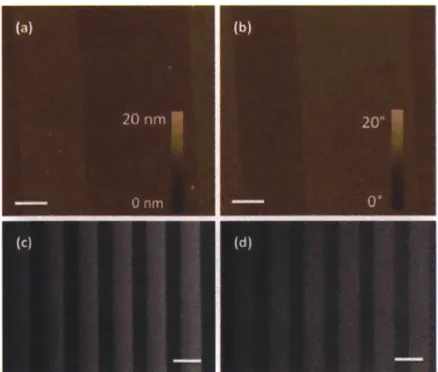
3.2.4 Substrate Characterization... 63
3.3 Cell Rolling on Asymmetric Patterns in a Flow Chamber...64
3.3.1 C ell C ulture... 64
3.3.2 Experim ent Setup ... 64
3.3.3 Results and Data Analysis ... 65
3.3.3.1 Effect of Edge Angle on the Rolling Behavior of HL60 Cells 68 3.3.3.2 Effect of Shear Stress on Rolling Behavior of HL60 Cells ... 70
3.3.3.3 Effect of P-selectin Incubation Concentration on Rolling Behavior of HL60 Cells ... 72
3.3.3.4 Detachment of Cells Rolling Along an Edge Can be Described by a Poisson Process. ... 73
3.4 Optimization of Device Design ... 80
3.4.1 Effect of Band Width (w) on Device Performance...84
3.4.2 Effect of Edge Inclination Angle on Device Performance ... 86
3.4.3 Effect of Shear Stress on Device Performance...87
3.5 C onclusion ... 9 1 3.6 C hapter ... 92
4 Identification of Adhesion Molecules with Weak Affinity via Phage
Display from M13 pVIII Library ...
97
4.1 Introduction ... 97
4.2 Biopanning of pVIII Library ... 99
4.2.1 Phage display library of random peptides ... 99
4.2.3 Phage Titering...102
4.2.3.1 Lysogeny Broth (LB) Medium Preparation...102
4.2.3.2 Tetracyline (Tet) Stock Solution Preparation ... 102
4.2.3.3 IPTG/Xgal Stock Solution Preparation...102
4.2.3.4 LB/IPTG/Xgal Plates Preparation...102
4.2.3.5 Agarose Top...102
4.2.3.6 Titration Procedure...103
4.2.4 Amplification of M13 bactriophage ... 104
4.2.4.1 PEG/NaCl Stock Solution Preparation...104
4.2.4.2 Amplification between Rounds of Panning ... 104
4.2.5 DNA extraction for sequence identification...105
4.2.6 Biopanning Results...107
4.3 Immobilization of phage on Au-coated glass slide ... 109
4.4 Substrate Characterization...110
4.5 Cell Capture Experiments ... 112
4 .5.1 C ell C ulture...112
4.5.2 Cell Staining ... 112
4.5.3 Cell Capture Experiment in Flow Chamber ... 113
4.6 Cell Capture Efficiency...114
4.6.1 Phage-engineered Surface ... 114
4.6.2 CD4-blocked Phage-engineered Surface...116
4.7 Peptide Sequences Characterization of pVIII Library ... 117
4 .8 C onclu sion ... 120
4.9 Chapter Reference ... 120
5 Identification of Adhesion Molecules with Weak Affinity via Phage
Display from M 13 pII Library ...
123
5.1 Introduction ... 123
5.2 Biopanning of pIll Library...125
5.2.1 Biopanning Procedure ... 125
5.2.2 Biopanning Results...127
5.3.1 Surface Density of CD4 on Well Plate as the Target of Biopanning .130
5.3.1.1 M aterials...130
5.3.1.2 M ethod ... 131
5.3.1.3 ELISA Analysis ... 131
5.3.2 Specificity of the Selected Phage to CD4 Protein ... 132
5.3.2.1 M aterials...132
5.3.2.2 M ethods...132
5.3.2.3 ELISA Analysis ... 134
5.4 Specificity of the Synthetic Peptide to CD4 protein ... 137
5.4.1 Synthetic peptide ... 137
5.4.2 Conjugation of Peptide to the Alexa Fluor 488 Dye ... 137
5.4.3 Purification of Dye-conjugated Peptides...138
5.4.4 Staining the CD4-functionalized Beads with the Dye-conjugated P eptid es ... 13 9 5.4.5 Characterization of Binding Specificity between Peptide and the Functionalized Beads ... 140
5.5 Conclusion...143
5.6 Reference...143
List of Figures
Figure 1-1 Multistep leukocyte adhesion cascade in response to inflammation. Selectins initiate capture and rolling of the leukocytes. Integrins are involved in adhesion and cause the cells to arrest and transmigrate into the underlying tissues ... 24 Figure 1-2 Selectins and their major ligands. Three selectin family members (P-, E-, and L-selectin) and their corresponding ligands are shown in this figure. These three .... 25 Figure 1-3 Force-dependent lifetimes of single bonds of PSGL-1/ P-selectin (blue) and PSGL-1/ L-selectin (purple) under different shear stress. The catch-to-slip bond transition under increasing forces has been observed: the lifetime increases (catch bond) first until it reaches a maximal value and then decreases (slip bond)...26 Figure 1-4 Scanning electron microscope (SEM) images of neutrophils. (a) Localization of PSGL-1 on microvilli. A human neutrophil was incubated with a mixture of the anti-PSGL-1 antibodies, followed by a rabbit anti-mouse antibody, and then with protein A-gold of 5 nm diameter. The arrow shows the gold nanoparticles (b) low magnification of tethered neutrophils. The neutrophil cell has multiple projections named microvilli on its surface. (c) high magnification of tethered neutrophils. The neutrophil was rolling on P-selectin under shear stress 2 dyn/cm2. The arrow shows a tether. Scare bars are all referred to 1 m. ... 28
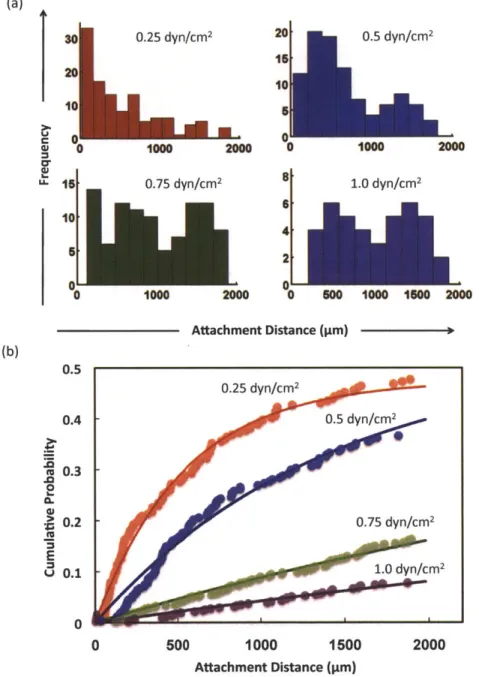
Figure 1-5 Effect of a receptor pattern on the motion of a rolling cell. Tracks of HL60 cells rolling on patterned P-selectin edge show that patterning can direct the trajectories of rolling cells along the edges (only long tracks are shown on the right)...29 Figure 1-6 Schematic diagram of a device for separation of cells. Cells rolling along band edges are laterally displaced into the adjacent buffer stream, resulting in separation. Pink lines indicate adhesion molecule-functionalized regions. Red and blue circles are interacting cells and non-interacting cells, respectively...30 Figure 2-1 Schematic diagrams of cells travelling in a microfluidic channel. (a) The illustration of a cell entering the microfluidic channel and travelling in both x and y directions. The settling distance, xs, is defined as how far a cell will travel before it settles close enough to the bottom surface. (b) Illustration of cells passing the P-selectin-coated area. A cell may be captured from the flowing stream at an attachment distance, /a, after it enters the P-selectin-coated area. ... 39 Figure 2-2(a) Convection velocity (u,,) of the cells at the different horizontal position. Convection velocity divided by shear stress decreases and reaches a minimum value as the cells travel along the channel. Data are presented as the mean and the standard deviation of the convection velocity obtained from 20 cells under each experiment condition. Different markers and colors represent different shear stresses. (b)
of the cells at different horizontal positions (c) Variation of the convection velocity of the settled cells with the shear stress. Inset summaries the mean and the standard deviation of the convection velocity of the cells at position x = 13 cm. The relationship between u, and T is well described by a linear fit (dashed line). ... 46 Figure 2-3 Fluorescent images of the substrate. The bright area corresponds to FITC-B SA -coated area...47
Figure 2-4 HL60 cells being captured onto the P-selectin-coated area at the shear
2
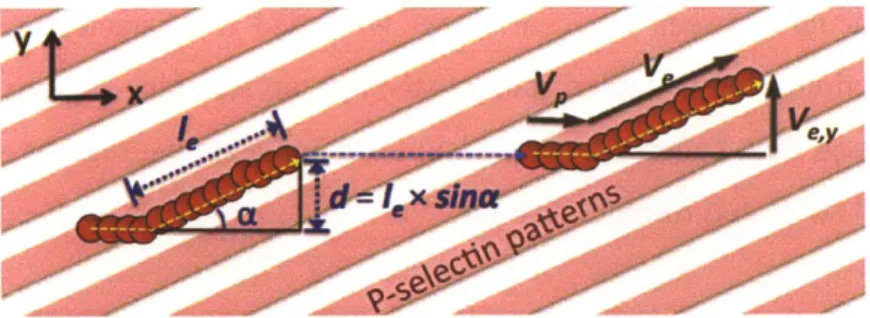
stress of 0.25 dyn/cm .Some cells were observed to flow out of the field of view...49 Figure 2-5 The attachment distances of HL60 cells at the shear stress of 0.25 dyn/cm2. P-selectin edge is located at 0 gin. The data obtained by analyzing 65 images acquired at 1 fps using a customized Matlab code...49 Figure 2-6 Attachment distance of HL60 cells at different shear stresses of 0.25-1.0 dyn/cm2. Representative results are shown for only one experiment for each shear stress. (a) Distribution of attachment distance at different shear stresses (0.25-1.0 dyn/cm2). (b) Cumulative probability (CP) of attachment distance at different shear stresses (0.25-1.0 dyn/cm 2) ... 51 Figure 3-1 Illustration of a typical cell rolling trajectory along the receptor pattern inclined an angle (a) to the fluid flow direction. The cell binds within the receptor line, and rolls in the direction of shear flow toward the pattern edge. The cell then tracks the edge to define an edge tracking length
4,
resulting in a net lateral displacement d, before detaching to continue along the direction of fluid flow before possible reattachment and rolling along a new receptor line. Cell rolling velocity v, along within the receptor-functionalized line in the x-direction of fluid flow can be distinguished from the velocityVe along the line edge, where ve,yis lateral velocity (the vertical component perpendicular to the streamlines and parallel to the lateral displacement, d)...61 Figure 3-2 Schematic diagram for patterning of P-selectin on a gold substrate involving microcontact printing. Step 1: Selective deposition of PEG molecules on the gold surface. Step 2: Filling in of the uncoated surface with P-selectin. ... 62 Figure 3-3 Characterization of P-selectin patterned substrates. AFM images of 10 pm wide P-selectin lines separated by 15 gm wide PEG bands (after step 2), displaying63 Figure 3-4 Rectangular flow chamber for cell rolling on multiple asymmetric pattern study. The flow chamber was attached to the P-selectin-patterned substrate via a vacuum manifold to assemble the device. The thickness of the gasket determines the height of the chamber, here, height = 0.005 inch)...65 Figure 3-5 The interaction of HL60 cells with P-selectin/PEG patterned substrate in the flow chamber. The substrate was prepared using large line-patterned stamp (LS). The edge inclination angle was 100 and the shear stress was 0.5 dyn/cm2. The HL60 cells
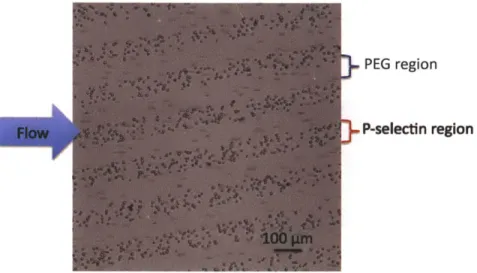
only interact with the P-selectin patterned region, not PEG patterned region, which confirms the anti-fouling property of PEG...66
Figure 3-6 Tracks of HL60 cells rolling on P-selectin patterns. The tracks (blue lines) on P-selectin lines (pink) were obtained by analyzing 300 images acquired at 1 fps using a customized Matlab code. The edge inclination angle was 100 and the shear stress was
0.5 dyn/cm2. Inset shows a track corresponding to a cell that first rolled inside the P-selectin line (green) in the direction of fluid flow and then tracked along the edge (black). ... ... ... ... 68 Figure 3-7 Effect of edge inclination angle a on rolling behavior of HL60 cells at a fluid shear stress magnitude of 0.5 dyn/cm2. Variation of (a) edge tracking length, 1e; (b) lateral displacement, d; (c) rolling velocities v, and ve within the P-selectin lines and on the edge, respectively; and (d) lateral velocity, ve,,y (component of the edge rolling velocity in the direction of lateral displacement). Error bars represent one standard
deviation, with n = 3 replicate experiments for each condition...70 Figure 3-8 Effect of shear stress T on rolling behavior of HL60 cells at an edge inclination angle of 50. Variation of (a) edge tracking length, le; (b) lateral displacement,
d; (c) rolling velocities v, and ve within the P-selectin lines and on the edge, respectively;
and (d) lateral velocity, ve,,y. The effect of shear stress on rolling behavior of HL60 cells is not statistically significant as observed in (a), (b), (c) and (d). Error bars represent one standard deviation, where n = 3 replicate experiments for each condition...71 Figure 3-9 Effect of P-selectin incubation concentration on rolling behavior of HL60 cells. Variation of (a) edge tracking length, le; (b) lateral displacement, d; (c) rolling velocities v, and ve within the P-selectin lines and on the edge, respectively; and (d) lateral velocity, vey at edge inclination angles a = 100 and 20' and shear stress of 0.5 dyn/cm2 .Error bars represent one standard deviation, where n = 3 replicate experiments for each condition... ... ... 73 Figure 3-10 Detachment of cells rolling along an edge is well described by a Poisson distribution. (a) Cumulative distribution function of edge tracking lengths le (filled triangles) was fitted to a Poisson distribution described by Eq. 3-1 (solid lines). Insets show the frequency distribution of the experimentally measured edge tracking lengths, along with that predicted by the Poisson distribution fit to the CDF (solid lines). Colors indicate different inclination angles a of the receptor pattern. Representative results are shown for only one experiment for each a. (b) Variation of the average value of k with edge inclination angle is well described by a linear fit on a semi-log plot (solid line). (c) Variation with the edge inclination angle of the average value of the lateral displacement (solid line) obtained from the empirical fit shown in (b) along with the experimental results (open circles). Error bars in (b) and (c) represent one standard deviation. Shear stress is 0.5 dyn/cm2. . . .... . . 76
Figure 3-11 Prediction of cell trajectories on a receptor-patterned substrate (a) Probability distribution of net lateral displacement of HL-60 cells after rolling on three consecutive bands of P-selectin patterns as obtained from Monte Carlo simulations (shaded area) and experimental observations. a = 200 (shear stress 0.5 dyn/cm2). (b) Prediction of the downstream distribution of HL60 cells rolling on patterned P-selectin in a separation device. ... 79
Figure 3-12 Optimization device design. (a) Schematic diagram of cell settling, capture, rolling on the patterns. (b) Schematic diagram of a device. Device capture efficiency, total lateral displacement, and required chamber length can be modeled based on different device design parameters... 81 Figure 3-13 (a) Schematic diagram showing cell hopping onto downstream band. (b) Variation of effective chamber length on total lateral displacement when hopping events were (p, = 1.0) and were not (p, = pf = 0.03) considered for the pattern design of a = 150, w = 10 tm, g = 10 pIm, and r= 0.25 dyn/cm2 . . . . . . 84 Figure 3-14 The relationship between device capture efficiency (Pd) and effective chamber length (xe) and the relationship between total lateral displacement (d,) and effective chamber length (xe) when w varies from 10 ptm to 50 pIm with a = 15*, g =
10
stm,
and r = 0.25 dyn/cm2 ... . .. ... ... ... ... .. ... .... . . . .85 Figure 3-15 The relationship between device capture efficiency (Pd) and effective chamber length (xe) and the relationship between total lateral displacement (d) and effective chamber length (xe) when a varies from 5 0 to 250 with w = g =10 pim, and r= 0.25 dyn/cm2. . . . . . . . .. . . . . . . . . . 87 Figure 3-16 The relationship between device capture efficiency (Pd) and effective chamber length (xe) and the relationship between total lateral displacement (d) and effective chamber length (xe) when i-varies from 0.25 dyn/cm2 to 1.0 dyn/cm2 with a
= 150 and w = g =10 pm...89
Figure 3-17 Device optimization parameters including edge inclination angle a, band width w, gap width g, and shear stress T, for a miniaturized device of a chamber length of L, with device capture efficiency Pd, and total lateral displacement d,. x, is settling distance and xe is effective chamber length. ... 91 Figure 4-1 Schematic diagram of M13 bacteriophage and the summary of coat protein... ... ... ... ... 98 Figure 4-2 Schematic diagram for identifying peptide motifs of affinity to CD4 protein by biopanning using pVIII library. The pVIII library was exposed to the CD4-coated well plate. Unbound phage was then washed off from the target and the bound phage was eluted from the surface by acid solution. The eluted phage was amplified to serve as the sub-library for the next round of the panning process. The peptide sequences of the eluted and amplified phage was identified by titering and DNA sequencing. The panning process was repeated until the consensus peptides were found. ... 101 Figure 4-3 Titration of phage on LB/IPTG/Xgal plates (dilution range is from 101 to
104). The phage was titered on LB/IPTF/Xgal plates and the blue plaque was then randomly selected for sequencing... ... 104 Figure 4-4 Schematic diagram of DNA extraction for sequence identification. DNAs of the phage was extracted from the bacteria. The bacteria were lysed and the DNAs were isolated from the lysed bacteria and then eluted using QlAprep Spin Miniprep Kit....106
Figure 4-5 Schematic diagram for immobilizing phage on a gold substrate. Step 1: Functionalization of DSP onto the gold surface. Step 2: Immobilization of phage on the reactive gold surface...110 Figure 4-6 Surface characterization of phage-engineered substrates. AFM height
images of phage immobilized on the gold-coated substrate. All the images are 1 Om X 1Opm...---...112
Figure 4-7 Fluorescent microscope images of the cells on the RK1-engineered gold substrate (A) before the flow was started (B) after the flow was started for 60 s. The white dots are stained K562 cells and black dots are non-stained SUPTI cells...114 Figure 4-8 Capture efficiencies of RK1-RK12-immobilized substrates at shear stress of 0.1 dyn/cm2. Error bars represent one standard deviation, where n = 4 replicate experiments for each condition...115 Figure 4-9 Capture efficiencies of RK1-immobilized substrates. The effect of different shear stress on the capture efficiencies of the cells on the RK1-immobilized
substrates. Error bars represent one standard deviation, where n = 4 replicate experiments for each condition...116
Figure 4-10 Microscope images of the SUPT1 cells captured on the CD4-blocked RK1-engineered gold substrate (a) before the flow was started (b) after the flow was started for 60 sec...117
Figure 5-1 (a) CD4 protein physically adsorbed on regular polystyrene surface. (b) His-tagged CD4 protein immobilized on Ni (II)-NTA-coated surface with specific orientation...---..124
Figure 5-2 Schematic diagram for identifying peptide motifs of affinity to CD4 by biopanning using pIII library. The pIII library was exposed to the CD4-coated well plate. Unbound phage was then washed off from the target and the bound phage was.. 126 Figure 5-3 Schematic diagram of ELISA procedure. CD4-His protein was
immobilized on Ni (II) coated well plate. The phage was then exposed to the CD4-coated well plate. HRP-conjugated anti-M13 antibody binds specifically to the target (pVIII
protein of the phage). Several washing steps were repeated between each ELISA step to remove unbound materials. Substrate (TMB) was added and the colored end product from enzyme-substrate reaction is produced. The color signal correlates to the amount of the phage present in the well plate. ... ... 134 Figure 5-4 ELISA assay output. (a) Qualitative results. Representative results are shown for only one experiment at each condition. Wells in column 1, 3, and 5 were coated with CD4 and then BSA. Wells in column 2, 4, and 6 were coated with only BSA as control. Phage with different input concentration were added. Phage AMB1 were incubated in column 1 and 2. Phage AMB2 were incubated in column 3 and 4. WT phage was incubated in column 5 and 6; (b) Quantitative results. The relationship between the absorbance of the colored end product and the input concentration of the phage. Error
bars represent one standard deviation, with n = 3 replicate experiments for each condition...- --...-- - - - -. ---... 136 Figure 5-5 Reaction of the Alexa Fluor@ 488 C5 Maleimide with a thiol-peptide. .137 Figure 5-6 Collected drained samples. The first five fractions were collected before the dye-conjugated peptide solution drained through and thus contained mostly buffer (colorless). The orange color came from dye-conjugated peptide. The non-conjugated dye shows yellow color ... - . .... ... -... ... 138 Figure 5-7 Schematic diagram for staining the CD4-coated beads with dye-conjugated peptide. The Ni(II) beads were incubated with CD4-His and AF 647
-conjugated BSA, separately. The beads were then mixed and incubated with BSA to block non-specific interaction. The mixed CD4 and AF 647-B SA-coated beads were then incubated with AF 488-conjugated peptide. Several washing steps were repeated between each step to remove unbound materials before the samples were imaged...140 Figure 5-8 Fluorescence microscope analysis. (a-b) CD4-immobilized beads. Images of (a) bright field and (b) FITC channel. CD4-immobilized beads do not show autofluorescence. (c-d) BSA-coated beads that were incubated with AF 488 conjugated peptides. Images of (c) bright field and (d) FITC channel. AF 488 dye-conjugated peptides do not show non-specific binding to BSA-coated beads. (e-f) The mixture of the CD4-immobilized beads and the AF 647 dye-BSA-coated beads stained with AF 488 dye-conjugated peptides. Images of (e) bright field; (f) Cy5 channel; and (g) FITC channel; (h) is the Cy5/FITC channel merged image. AF 488 dye shows bright, green fluorescence and AF 647 shows bright, red fluorescence. Beads number 1, 2, 6, and 11 were coated with BSA and beads number 3, 4, 5, 7, 8, 9, and 10
... ...---... ... 142 Figure 6-1 Experimental design for characterizing hopping behavior of cells. Cells flow over parallel receptor bands with different gap widths aligned perpendicular to flow direction. The minimum gap width without making cell cross over the patterns can be identified... ... .. ... ... .... ... .. 147
List of Tables
Table 1-1 Kinetics and affinity of selectin-ligand and antibody-antigen interactions ... ... 23 Table 2-1 Comparison of the average values and standard deviation of A and <Ia> obtained from curve fitting at different shear stresses of 0.25-1.0 dyn/cm2. n = 3 replicate experiments. Data were obtained by fitting to two empirical equations with experimentally measured attachment distance ... 51 Table 3-1 Comparison of the experimental average of 1e, Poisson average value of k, and the Poisson mean value ' from the empirical fit. n = 3 replicate experiments.... 76
Table 3-2 Prediction of required effective chamber lengths (xe). The range of xe
which target at Pd - 90%, dt : 850 ptm and both criteria (Pd > 90% and d, ? 850 Pim)
2
when w varies from 10 pm to 50 pin with a = 150, g = 10 ptm, and T = 0.25 dyn/cm . ... ... ...--- 86 Table 3-3 Prediction of required effective chamber lengths (xe). The range of xe
which target at Pd ! 90%, d, ? 850 ptm and both criteria (Pd > 90% and d, f 850 pim) when a varies from 5 0 to 254 with w = g =10 pim, and r =0.25 dyn/cm2... ..... . ....... 87 Table 3-4 Prediction of required effective chamber lengths (xe). The range of xe
which target at Pd ! 90%, dt ? 850 gim and both criteria (Pd > 90% and d, ? 850
stm)
when r varies from 0.25 dyn/cm2 to 1.0 dyn/cm2 with a = 151 and w = g =10 pm...89 Table 4-1 Input and output concentration of phage and the recovery of each round of screening. The concentration is defined as the number of the phage per well. For each round of screening, four wells coated with CD4 were used...107 Table 4-2 CD4 protein binding sequences from biopanning of pVIII library...107
Table 4-3 Selected peptide sequences and their properties. (negatively charged amino acids in red; positively charged amino acids in blue; polar amino acid without charged in yellow; hydrophobic amino acid in gray; aromatic amino acids in green; Tyrosine in orange)... ... ...---... 109 Table 4-4 Peptide sequences from biopanning of pVIII library. (96 samples were selected)... ... ---o...117 Table 5-1 Binding affinity (dissociation constant (KD) of oligo-histidine peptides to Ni(II)...--- -- - -- -.... 125
Table 5-2 Input and output concentration of phage and the recovery of each round of screening. The concentration is defined as the number of the phage per well. For each round of screening, four wells coated with CD4 were used...127
Table 5-3 CD4 protein binding sequences from biopanning of pIII library...128 Table 5-4 Selected peptide sequences and their properties. (negatively charged amino acids in red; positively charged amino acids in blue; polar amino acid without charged in yellow; hydrophobic amino acid in gray; aromatic amino acid in green; Histidine in orange)...130
1
Introduction
1.1 Background and Motivation
Separation and analysis of heterogeneous cell populations are important for diagnostic and therapeutic applications, and for elucidating the biology of rare cell types. Numerous cell-sorting techniques have been developed, with sorting characteristics based on physical properties of the cells, such as size, density, and deformability [1-4]. However, these physical separation methods may not be sufficiently specific enough to distinguish similar cell types. Surface maker-based cell separation/analysis techniques allow cells to be distinguished via biochemical differences (protein expression), and can confer higher specificity. Some standard techniques include fluorescence-activated cell sorting (FACS), magnetic-activated cell sorting (MACS), and cell affinity chromatography (CAC). Among these, FACS or flow cytometry has been the gold standard of cell separation for years. However, sophisticated equipment, and time-intensive and labor-intensive sample preparation processes limit the use of most methods. For example, white blood cell counts and leukocyte differential are routinely used in clinical diagnostics [5]. Blood counts are usually performed using automated counters to identify major blood cell types and separation of subgroups of immune cells are done through FACS [5]; however, flow cytometry is typically not available in the situation with resource-limited settings. Also, transportation of clinical samples from patients to labs and multiple sample processing steps are time-consuming and labor-intensive. Microfluidic devices offer a promising platform for cell separation in which all of the processes can be compacted in one single step. Small amount of samples required and portability of microfluidic devices facilitate the application in point-of-care testing. However, most of surface-marker-based microfluidic devices use antibodies to capture cells with specific antigens and therefore separate cells. The antibodies with high affinity to their antigen limit the usability of these microfluidic devices since retrieval of the captured cells is difficult. Therefore, there exists a need for developing techniques of rapid cell separation based on specific surface markers but weak adhesion which will allow cells to be retrieved and will be useful for many applications. A number of molecules in nature exhibit weak, but relatively specific adhesive interactions. For example, selectins mediate leukocyte rolling
which is a process in inflammatory or immune responses [6-9]. Selectin molecules-based separation has been studied before; however, it was limited to a batch process [10]. Karnik et al have demonstrated that patterning of selectin molecules inside the microfluidic device create the possibility of continuous sorting of cells by transient, weak interaction between cell and patterned selectin molecules [11]. Comprehensive studies of cell settling, cell attachment, pattern geometry, flow condition, and selection of adhesion molecules are needed in order to design and realize these devices.
1.1.1 Surface Marker-Based Cell Separation
Surface markers are typical proteins expressed on the surface of cells. Cluster of differentiation (CD) molecules are a group of surface markers mostly expressed on leukocytes and associated with immune function or properties. The cells can be defined based on which CD molecules expressed on their surface. Using multiple CD markers allows the cells to be defined more specifically. For most of existing surface marker-based cell sorting techniques, the surface cluster of differentiation proteins (antigens) are identified via binding of conjugate proteins (antibodies). An important advantage of surface marker-based cell separation is that it can be used for sorting the cell populations of the same size or density. For example, CD4 and CD8 proteins are well known surface markers for helper T lymphocytes (T cells) and suppressor/cytotoxic T cells, respectively[12]. The diagnosis of HIV disease relies on the efficient separation of human CD4+ T lymphocytes (T cells) from whole blood. The most general way to distinguish CD4+ T cells and CD8+ T cells is to identify them by antibodies that can specifically bind to CD4 or CD8 proteins expressed on the T cells. The antibodies can be conjugated to fluorescent molecules or magnetic beads, or can be immobilized onto columns or microchips. The methodologies or operation procedures will differ, depending on the materials to which the antibodies are conjugated or immobilized. The most common surface marker-based technologies are: fluorescence-activated cell sorting (FACS), magnetic-activated cell sorting (MACS), cell affinity chromatography (CAC), and antibody-based microfluidic devices (ABM) [1-3, 13], which are outlined below.
Fluorescence-Activated Cell Sorting (FACS). FACS is the gold standard cell subpopulation separation technique [14, 15]: Typically, specific cell surface markers of the cells labeled by antibodies. Those antibodies are labeled with fluorescent molecules and the cells are then identified by fluorescent intensity corresponding to the number of antigens on each cell. By collecting the information such as fluorescent intensity of each cell, the machine can identify and then separate cells of different antigen surface density. FACS has several technical advantages, such as single-cell-level sensitivity, high throughput (~10,000 cells/sec) of separation/counting, and ability to track four to five different cell surface markers at the same time [15]. However, the capital investment and maintenance of equipment, and the multiple sample preparation steps, hinder the applications in point-of-care tests or in resource-limited settings environment. Furthermore, cell viability after ejection from the machine, as well as the potential need to remove antibody labels before human use of such sorted cells, remain major issues, that limit the use of FACS in clinical or translational applications [14, 15].
Magnetic-Activated Cell Sorting (MACS). Similar to FACS, in MACS, the surface markers of the cells are recognized by the antibodies. These antibodies are coated onto the surface of magnetic nanoparticles [16]. The cells can be sorted by applying a strong magnetic field that collects bead-bound cells of higher antigen density or affinity. Compared with FACS, by which the cells are sorted one by one, MACS can separate the cells in serial (continuous mode) or in parallel (batch mode), resulting in higher throughput (more than 1011 cells per hour [2, 13]). Another advantage is that cells can be sorted positively or negatively depending on whether targeted or nontargeted cells are labeled. However, there are several drawbacks for this method, such as the time-consuming, sensitive process of labeling cells onto the antibodies-coated magnetic beads, complications of removing magnetic labels, and difficulty of sorting more than two cell populations at the same time.
Cellular Affinity Chromatography (CAC). Affinity chromatography has been widely used for separating biological molecules, such as peptides, proteins and enzymes [17-22]. Affinity chromatography can also be applied in cell separation by using different column
design [23-26]. Cells can be sorted by being passed via fluid flow through a column packed with antibody-coated beads or other solid supports. Cells with affinity to the immobilized antibody will be to be selectively retained; other cells will be passed through unretarded. One advantage of CAC is that the sample preparation is simple. For example, there are no complicated processes of labeling cells with fluorescent dye or magnetic beads [1]. However, it is often difficult to release the bound cells from the beads; elution is typically achieved by applying high shear flow or adding competitive agents [27].
Adhesion-based Microfluidics Devices for Cell Sorting (ABM). Similar to CAC, sorting of the cells by adhesion-based microfluidics devices is achieved by binding cells of interest onto the devices where the specific molecules are immobilized. The adhesive molecules (usually antibodies) can recognize the surface markers present on the surface of the cells. The separation can be completed in a single processing step. The untargeted cells are allowed to flow through without interacting with the adhesive molecules, while the targeted cells are captured inside the chip. The sensitivity of this method is enhanced because of the larger surface area to volume ratio in a microscale chip than in macroscale setup. Moreover, the residence time inside the microchips is shorter than that of CAC. The low-cost microchips provide advantages of flexibility for point-of-care diagnostics. However, the difficulty in retrieving the captured cells makes analysis and enumeration sorted cells difficult.
Most major surface marker-based cell separation techniques involve using antibodies that target corresponding antigens expressed on the cell surfaces. However, removal of the labels without changing cellular functions and phenotypes is one of the major issues that hinder the use of these methods. Additionally, these methods are then limited to isolation of cells with distinct antigens and for which purified antibodies are readily available. There exists a growing need for technologies that do not require modification or labeling of the sorted cells. Receptors with high specificity but weak affinity resulting in transient interaction with conjugate molecules on the cells may be used to fulfill the requirement.
1.1.2 Low Affinity Based Separation
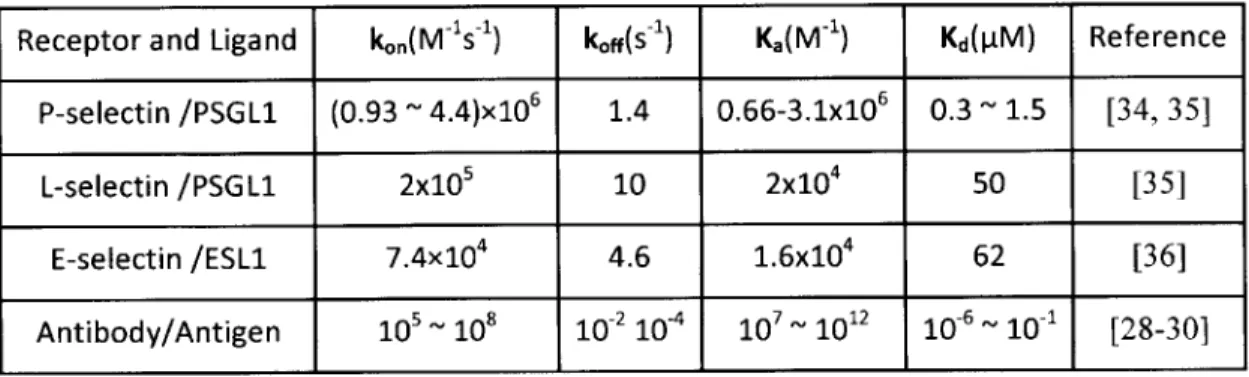
It has been widely studied that typical antibody-antigen interactions show high affinity where on-rate (k,,) is in the rage of 10'~108 M-'s-1, off-rate (korr) is in the rage of
10-2
_10-4 s-1 and dissociation constant (Kd) is in the range of 0.3~1.5 pM [28-30]. The high
affinity property results in firm adhesion between antibody and antigen, which limits the usability of these microfluidic devices since retrieval of the captured cells is difficult. In order to develop microfluidic devices that allow cells to be retrieved, adhesion molecules with weak but specific interaction is needed. In nature, a number of molecules exhibit unique kinetics and affinity that allows the cells to be specifically identified, but weakly captured. For example, selectins and their ligands mediate inflammatory or immune responses [6-9] and allow leukocytes to be captured from the blood stream and roll on the vascular endothelium. There are three types of selectins: (1) P-selectin (CD62P), (2) E-selectin (CD62E), and (3) L-E-selectin (CD62L) [6, 31-33]. Table 1-1 lists kinetics and affinities of selectin-ligand and antibody-antigen interactions [34-36]. Compared with typical antibody-antigen interaction, the moderate ko. and high koff of the selectin-ligand interactions suggest that the adhesive bond can be formed and be broken quickly and therefore the cells of ligand molecules can roll on the receptor molecules. Using this weak but specific adhesion opens possibility of separating cells without labeling and allowing cells to be retrieved.
Table 1-1 Kinetics and affinity of selectin-ligand and antibody-antigen interactions
Receptor and Ligand kon(M 1s1) koff(s-) Ka(M 1) Kd(PM) Reference
P-selectin /PSGL1 (0.93 - 4.4)x106 1.4 0.66-3.1x10⁶ 0.3 1.5 [34, 35]
L-selectin /PSGL1 2x10⁵ 10 2x10⁴ 50
[35]
E-selectin /ESL1 7.4x10⁴ 4.6 1.6x10⁴ 62 [36]
1.1.2.1 Cell Rolling
Cell rolling is mainly observed as one of the steps in recruiting leukocytes from circulating blood into the sites of inflammation, as shown in Figure 1-1 [37]. Rolling is initiated first, followed by integrin-dependent adhesion and transmigration to the site of inflammation. Cell rolling involves transient interactions between the leukocyte and the vascular endothelium (blood vessel lining) under fluid shear in a physiological process. The interaction is mediated by glycoprotein receptors known as selectins and their ligands. Rolling mechanism also plays an important role in homing of hematopoietic stem cells and metastasis of tumor cells [6-9].
Capture
Rolng
salyl Lewis X
Integrins ITuimin
Selectins ICAM-1 PECAM
VCAM-
VAP-Figure 1-1 Multistep leukocyte adhesion cascade in response to inflammation. Selectins initiate capture and rolling of the leukocytes. Integrins are involved in adhesion and cause the cells to arrest and transmigrate into the underlying tissues [37].
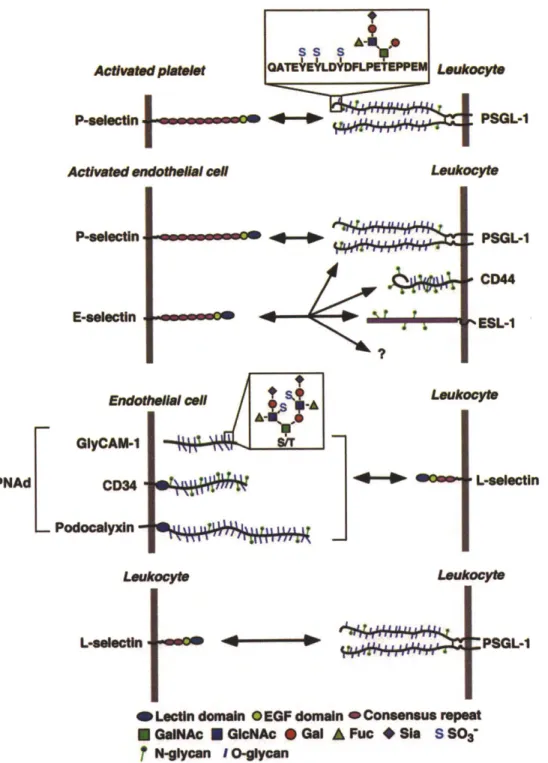
Selectin Family. Selectins including P-selectin, E-selectin and L-selectin and their ligands mediate leukocyte rolling interaction [6, 31-33]. P-selectin molecules are expressed by endothelial cells and platelets [38]. E-selectin molecules are expressed on endothelial cells and L-selectin molecules are expressed on leukocytes. Figure 1-2 lists selectins and their major ligands [6]. The major motifs of selectin molecules are: Ca+2_ dependent lectin domain, epidermal growth factor (EGF) like domain, short consensus repeat domain (SCR), transmembrane motif, and a short intracellular cytoplasmic tail as shown in Figure 1-2. Each selectin molecule mediates adhesion of rolling cells through the interaction of its lectin domain with sialyl Lewis x (sLex) ligand in the presence of extracellular Ca . Several posttranslational modifications (glycosylation and sulfation)
of the sLex motif have been identified for being able to preferentially bind to specific type of selectin [31]. For example, attachment of sLeX to the O-linked glycan of the P-selectin glycoprotein ligand-1 (PSGL-1) and the sulfation of N-terminal tyrosine in PSGL-1 are required for P-selectin binding [39].
Aeftated Plaftiet L TELOkct P-selecin -- ewPSGL-1
Actb*a&W ondotheftl eN LeuM"cye
P-selectin Eselactin -Un~ PNAd
F
L.
GIyCAM-1 CD34 Podocalyxin --4m4
At WicllLu .1aiWI
PSGL-1 CD4 %ESL-1 MoYte L-eelectln L-eFeadnLectin domain OEGF domain COnSMnSuS rmpt E GNAc M GNAC @ Gal A Fuc * SIS SSO
fNr-9ycan
I O-ycanFigure 1-2 Selectins and their major ligands. Three selectin family members (P-, E-, and L-selectin) and their corresponding ligands are shown in this figure. These three
Laeukocy"
selectin molecules share similar structure: N-terminal Ca+2-dependent lectin domain,
epidermal growth factor like domain, short consensus repeat domain (SCR), transmembrane domain, and a short intracellular cytoplasmic tail (last two parts are not highlighted here). CD, cluster designation; EGF, epidermal growth factor; ESL-1, E-selectin ligand-1; GlyCAM-1, glycosylated cell adhesion molecule-1; GalNAc, N-acetylglucosamine; Gal, galactose; Fuc, fucose; Sia, sialic acid. [61
The force exerted from the flow on the cells may affect the lifetimes of selectin-ligand bonds by changing their off-rates. Bond lifetime of a receptor-ligand bond may increase
(catch bonds) or decrease (slip bonds) [6, 40-45]. Lifetime is equal to the reciprocal of
off-rate, l1/kff. The catch-to-slip bond transition under increasing forces has been observed experimentally for PSGL-l/ P-selectin and PSGL-l/ L-selectin as shown in Figure 1-3 [6, 40, 41, 46]. The external force has a biphasic effect on selectin-ligand interactions: the lifetime increases (catch bond) first until it reaches a maximal value and then decreases (slip bond). The catch bond behavior was observed over wider range of external force for L-selectin (up to 50 pN per bond) compared with PSGL-l/ P-selectin (up to 20 pN per bond) [40, 41]. In contrast, only slip bonds were observed for selectin/antibody interaction under external force [40, 41].
05 0.4-0.4 - P-selectln/PSGL-1 *# E 03-0.2 L-selectin/PSGL-1 0.05 -0 0.4 0.8 1.2 1. 2
Wall shear stress (dyn cm-2)
Figure 1-3 Force-dependent lifetimes of single bonds of PSGL-1/ P-selectin (blue) and PSGL-1/ L-selectin (purple) under different shear stress. The catch-to-slip bond transition under increasing forces has been observed: the lifetime increases (catch bond) first until it reaches a maximal value and then decreases (slip bond). [61
Contributions to Rolling Motion. Cell rolling is a complex phenomenon involving multiple mechanical forces ranging from nanoscale to microscale [46]. For example, kinetics of receptor and ligand interaction [47], clustering of receptors [48, 49], elongation of microvilli [47, 48, 50-52], deformation of the cells [53], and the fluid forces acting on the cells [54, 55] can all perturb cell adhesion durations.
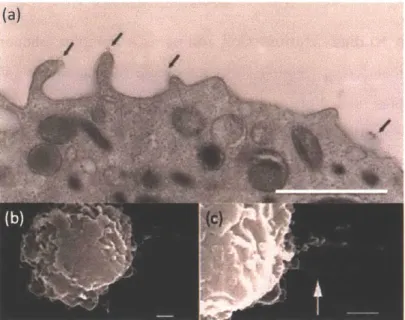
Cellular properties that modulate cell rolling. It has been demonstrated that selectin-(or selectin ligand-) coated microspheres can roll on the substrate immobilized with selectin ligand (or selectin). As those microspheres do not exhibit other biological features of cell rolling (microvilli extension, cell deformability and ligand cluster which will be discussed later), this suggests that molecular properties of selectin and its ligand are sufficient enough for supporting rolling [56-58]. We note that, compared to such beads, cells are deformable. Deformability of the cells enlarges the contact area between the bottom of the rolling cells and the endothelial cells, which results in a higher number of selectin-ligand bonds [59]. Additionally, the surfaces of cells are highly irregular. As compared to polymeric beads, for example, neutrophils (the most abundant leukocytes in the peripheral blood of human) have multiple microvilli and it has been observed that PSGL-1 and L-selectin are localized on the tip of microvilli on neutrophils as shown in (Figure 1-4(a)) [60, 61]. The bond cluster on the microvilli enhances tethering by increasing the contact with the receptors on the endothelial cells [62]. Tethers extend under shear flow by stretching microvilli (Figure 1-4(b) and (c)) [48] and the force on selectin-ligand bonds can be reduced by stretching tethered mivrovilli [63]. Most of the tethers retract after the selectin-ligand bond breaks [50].
Figure 1-4 Scanning electron microscope (SEM) images of neutrophils. (a) Localization of PSGL-1 on microvilli. A human neutrophil was incubated with a mixture of the anti-PSGL-1 antibodies, followed by a rabbit anti-mouse antibody, and then with protein A-gold of 5 nm diameter. The arrow shows the gold nanoparticles (b) low magnification of tethered neutrophils. The neutrophil cell has multiple projections named microvilli on its surface. (c) high magnification of tethered neutrophils. The neutrophil was rolling on P-selectin under shear stress 2 dyn/cm2. The arrow shows a tether. Scare bars are all referred to 1 pim. (Images are adapted from [48], and [60].)
1.1.2.2 Cell Rolling-Based Separation
Several groups have attempted to mimic physiological process of leukocyte rolling to develop cell separation techniques [64-70]. In contrast to conventional high affinity-antibody-based methods, separation based on immobilized receptors involved in cell rolling obviates labeling and label removal steps, enabling facile elution with minimized alteration of viability or function post-sorting [64-66]. For example, Chang et al. have demonstrated E-selectin-coated micropillar arrays for partially fractionating two cell types (HL60 and U937) based on the difference in transient interactions with the receptors [64]. Choi at al. also demonstrated that HL60 cells can be separation from K562 cells by using three dimensional P-selectin-coated inclined microstructure which promotes rolling of HL60 cells in the lateral direction [68]. Karnik et al. have demonstrated the transient interaction of HL60 cells and an inclined P-selectin band as shown in Figure 1-5 [11]. The P-selectin molecules were coated on the substate where the
edge of P-selectin area was inclined. The rolling cells can be displaced orthogonally to the direction of the flow, which opens new possibilities for separation of cells by
diverting the rolling direction of cells.
(a) (b)j
Figure 1-5 Effect of a receptor pattern on the motion of a rolling cell. Tracks of HL60 cells rolling on patterned P-selectin edge show that patterning can direct the trajectories of rolling cells along the edges (only long tracks are shown on the right). [11]
Figure 1-6 shows the concept of a device that adapts this observation, based on controlling the trajectories of the rolling cells along the edges of multiple receptor bands [70]. On the bottom of the device, multiple inclined, asymmetric adhesive bands are coated. The interacting cells from the continuously flowing sample can be captured on the adhesive bands and then roll on them. The asymmetry of the band orientation with respect to the flow direction alters the trajectory of the interacting cells, such that they track along the edge of the band, get displaced into the buffer stream and get sorted out. The non-interacting continue with the flow trajectory and stay in the sample stream. Such devices design with biomimetic adhesive substrates enables cell separation in a simple, continuous-flow, label-free manner. To realize the devices, a comprehensive study of interaction of cell and substrate is required. Cell settling and attachment onto substrates, the effect of substrate parameters on separation potential, and selection of adhesion molecules for the substrates will be discussed in this thesis later in order to maximize separation potential of cell rolling microfluidic devices.
Buffer eeel #Sorted Cells (interacting cells) Aoo
%
ee
**:Other Cells
Adhesive substrate (non interacting cells)
Cells
Figure 1-6 Schematic diagram of a device for separation of cells. Cells rolling along band edges are laterally displaced into the adjacent buffer stream, resulting in separation. Pink lines indicate adhesion molecule-functionalized regions. Red and blue circles are interacting cells and non-interacting cells, respectively.
Since cell rolling phenomenon is exhibited in vivo or in vitro by several types of cells including leukocytes, hematopoietic stem cells, and some cancer cells [6-9], those types of cells have potential to be separated by steering them on biomimetic adhesive bands using the device as described in Figure 1-6. Such devices can be suitable for point-of care applications, especially in non-industrialized settings, which require device simplicity and minimized cell processing steps. Furthermore, continuous flow sorting can promote separation efficiency and selectivity. Another advantage is that observation of cell-surface interactions on immobilized receptors offers the opportunity for label-free enumeration of cells [71]. Separation methods for therapeutics or subsequent analysis of cells need to preserve the cell phenotype and such devices allow invasive separation that can promise for these applications. Cell rolling separation devices with multiple adhesive bands also offer potential for direct analysis of the cell phenotype or receptor expression. In addition, co-immobilization of other cell type-specific molecules along with selectins can significantly influence cell rolling [72, 73], which opens the possibility of further tuning the specificity of separation and analysis based on the expression of a pertinent receptor on the cell. On the other hand, although directing rolling trajectories of cells by patterning of weak adhesion molecules onto the microfluidic device is promising for label-free cell sorting, this technology is limited to the molecules known for enabling cell rolling. To apply this technique to general surface markers, new receptors other than the existing molecules need to be identified. Biopanning is an affinity selection technique
used for identifying peptides that bind to a target of affinity within micromolar range [74], which potentially can be used to identify new receptor with weak adhesion to the cells. The possibility of using biopanning to select receptors for cell separation will be
studied in this thesis.
1.2 Scope of the Thesis Work
To successfully develop rolling adhesion microfluidic devices that can deflect cells by inclined receptor bands as shown in Figure 1-6, a biomimetic adhesive substrate is the key. Therefore, the goal to this thesis work is to develop biomimetic adhesive substrates for cell separation in microfluidic devices. My three main aims are:
- Aim 1: To understand transport and attachment of cells to biomimetic adhesive
substrates in microfluidic channels.
Chapter II discusses how the cells settle and how they are captured by receptor functionalized surface under fluid shear flow. In Part A, to quantify cell settling, settling distance under different shear stresses is characterized from the study of convection velocity of cells at different position along the channel. In part B, to quantify cell capture, cumulative probabilities of cell attachment distance and average attachment distance of cells at different shear stresses is analyzed. An empirical model is developed to predict capture probability by an inclined receptor band.
- Aim 2: To investigate effects of biomimetic adhesive substrate parameters on cell
separation potential
In Chapter III, a patterning method involving microcontact printing is developed to study how cell transport can be controlled on inclined receptor bands. The effects of edge inclination angle with respect to shear flow direction (a = 50, 100, 150 and 20'), shear stress magnitude (r = 0.5, 1, 1.5 and 2.0 dyn/cm2), and P-selectin incubation concentration (15, 20, and 25 ptg/mL) are quantified in terms of the edge tracking length, lateral displacement, and rolling velocity. A methodology is developed to predict device performance to enabled successful design of separation device.