HAL Id: insu-00798021
https://hal-insu.archives-ouvertes.fr/insu-00798021
Submitted on 7 Mar 2013HAL is a multi-disciplinary open access archive for the deposit and dissemination of sci-entific research documents, whether they are pub-lished or not. The documents may come from teaching and research institutions in France or abroad, or from public or private research centers.
L’archive ouverte pluridisciplinaire HAL, est destinée au dépôt et à la diffusion de documents scientifiques de niveau recherche, publiés ou non, émanant des établissements d’enseignement et de recherche français ou étrangers, des laboratoires publics ou privés.
processes between La Hève and Antifer capes,
Normandy (NW France)
Jérôme Le Cossec, Anne Duperret, Bruno Vendeville, Said Taibi
To cite this version:
Jérôme Le Cossec, Anne Duperret, Bruno Vendeville, Said Taibi. Numerical and physical modelling of coastal cliff retreat processes between La Hève and Antifer capes, Normandy (NW France). Tectono-physics, Elsevier, 2012, 510, pp.104-123. �10.1016/j.tecto.2011.06.021�. �insu-00798021�
Numerical and physical modelling of coastal cliff retreat processes between La
Hève and Antifer capes, Normandy (NW France)
Jérôme LE COSSEC 1, Anne DUPERRET 1*, Bruno C. VENDEVILLE 2, Said TAIBI 1
1. FRE CNRS 3102 Laboratoire Ondes et Milieux Complexes, Université du Havre, 53 rue de Prony, BP 540 – 76058 Le Havre Cedex, France
2. FRE CNRS 3298 Géosystèmes, Université des Sciences et Technologies de Lille 1, Cité scientifique – bâtiment SN5 – 59655 Villeneuve d’Ascq cedex, France
Abstract
The study area is located along the French eastern Channel coastline, in Upper Normandy, between the La Hève and Antifer capes. The sedimentary series dip North-Eastward by 0.7° and comprise clay layers (Kimmeridgian and Albian clays) located at varying vertical elevation along the cliff (about 90m high). This coastal cliff section is undergoing slow gravitational deformation, assumed to take place along the clay layers. Using numerical and experimental models, we investigated the role of clay layers, acting as potential detachment layers, on the development of gravitational instabilities. In order to properly design our models, we characterized the rock mechanical parameters using triaxial shear tests on in-situ samples dated from Kimmeridgian to Cenomanian. We ran a series of numerical simulations using a finite-element code applied to 2-D cliff cross section having varying lithological and mechanical layering. Under the sole effect of gravity forces, the plastic strains are mainly localised along the two clay layers, and the predicted displacements evidence a seaward sliding of the cliff. We further investigated gravitational deformation in the cliff using experimental models subjected to high pore-fluid pressure using by injecting compressed air at the base of the model. The presence of fluid overpressure can trigger spontaneous dismemberment of a cliff that would otherwise remain stable. The region of the model located near the initial cliff spread seaward, which generated a set of normal
* corresponding author :
faults that propagated landward and create a frontal toe bulge. We modelled a more complex initial geometry closer that observed in the field by simulating the northward progressive deepening of a potential décollement (the Gault clay). In the segment of the model where the potential décollement layer lay above or at the cliff’s base, the absence of frontal buttress allowed for a large part of the cliff to slide seaward. The compressional toe of the deformed wedge progressively grew, thus acting as a buttress preventing further sliding. Removal of this toe by erosion lead to renewed gliding. Going northward, the vertical position of the potential décollement layer deepened, below the base of the cliff. There, the chalky shore platform acts as a buttress and the cliff deformation and seaward translation stops. Results lead us to hypothesize that cliff retreat would be faster where the potential décollement layer is located higher in the cliff along the southern segment. Therefore, the overall cliff trend would progressively rotate counterclockwise with ongoing deformation and erosion. This modelling works illustrates why the coastline trend changes drastically between the north (N60E) and the south segment (N25E). This progressive coastline re-orientation through time is confirmed by the fan-shape morphology of the bathymetry offshore the southern segment whereas the northern one presents a slight and regular slope.
Keywords: coastal chalk cliff, numerical modelling, experimental modelling, gravitational sliding, differential erosion
1. Introduction
Along each side of the Eastern English Channel, the sedimentary coastal cliffs cut the geological strata of the Anglo-Paris basin and are prone to gravitational instabilities. Coastal chalk cliffs instabilities have already been described along the Channel, in Upper Normandy and Picardy (France), or in East Sussex and Kent (United Kingdom), where cliffs instabilities occur by unpredictable and sudden collapses of the vertical coastal cliffs made entirely of chalk (Hutchinson, 2002; Mortimore et al., 2004; Duperret et al., 2004). Some other coastal areas of the Channel are made of sedimentary layers of marls, sands and overlying chalk. Along these coastal segments, slope movements are slow and regularly reactivated, as observed at Villerville (Lower Normandy, France) (Flageollet and Helluin, 1987; Maquaire, 1990), in Upper Normandy at Sainte-Adresse (Sinelle, 1989)
and in northern Boulonnais (Pas-de-Calais, France) (Pierre, 2006; Pierre and Lahousse, 2006). In the United Kingdom, slow slope movements have also been reported along coastal cliffs having similar lithologies in South Kent at Hythe (Bromhead et al., 1998), at Folkestone Warren (Hutchinson, 1969; Bromhead and Ibsen, 2007), and along the South coast of the Isle of Wight at Ventnor and Bonchurch (Hutchinson, 1991; Hutchinson et al., 1991; Palmer et al., 2007a; Moore et al., 2007). Studies conducted on these coastal cliffs have focused mainly on the morphological evolution of the slopes and on in situ geotechnical measurements. All studies have pointed out the role of the water table and rainfall as the main triggering factors governing slope movements.
The Upper-Normandy coast (NW France) may offer an interesting example of how changes in gravitational processes can affect the coastline orientation. Overall, the Upper Normandy coastline trends NE-SW, parallel to the English Channel regional trend. However, a short (20-km long) segment of the coastline, located between the city of Le Havre and the cape of Antifer, shows a markedly different trend, about N25E (Fig.1). In this work, we aimed at understanding whether this abrupt change in coastline trend may be related to changes in the nature of gravitational processes and associated rates of cliff retreat.
We follow a dual approach that combines 2-D numerical simulations (Finite-Element Method) and 3-D physical modelling in order to test the impact of cliff lithology and water pressure on gravitational processes.
2. Geomorphological setting
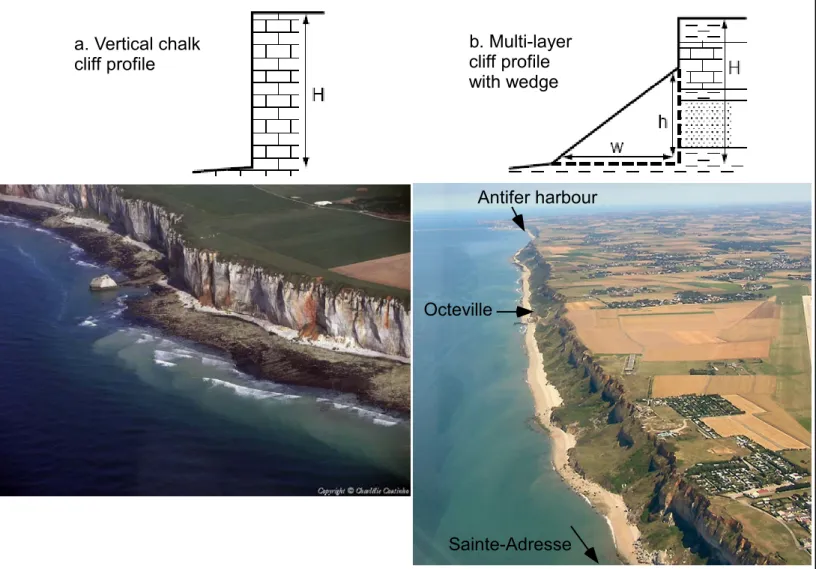
In Upper Normandy, northeast of the Antifer cape, chalk cliff erosion rates were measured by comparing geo-referenced air photograph acquired between 1966 and 1995. The chalky coastline has been eroding at mean rates of 0.23m/year during the last 30 years (Costa et al., 2004). Along this coastal segment trending about ENE-WSW (N60E and N80E) (Fig.1b), the cliff is only made entirely of chalk or chalk-with-flints (from Turonian to Campanian) (Megnien and Megnien, 1980). This type of chalk cliff retreats by sudden local collapse that depends on fracture pattern, Chalk lithology and changes in water table (Duperret et al., 2002; Duperret et al., 2004). The process of cliff erosion is mainly guided by large-scale cliff collapse, chopping away the cliff face by chunks as much as 10-20m wide during a single event (Duperret et al., 2002). After collapsing, the chalk-with-flints debris remain
at the base of the cliff. On one hand, most of the chalk debris disappear within a very few years under the influence of sea-water action (fragmentation, dissolution…). On the other hand, high-density eroded flints remain in place and form shingle beaches. Recurrent chalk cliff collapses build a coastal morphology made of vertical chalk cliffs, with a gently-dipping shore platform, immersed under sea water during high tides and progressively emerging during low tides (Fig.2a).Southeast of the Antifer cape, the coastline section of our study area is a particular 20-km-long cliff segment located North of the Seine River’s estuary, between Sainte-Adresse (South) and the Antifer cape (North) (Fig.1c). This section differs from the pure vertical chalk cliffs in three ways. First, the coastline there trends N25°E, whereas the rest of the coastline further east trends between N50° and N80° (Genter et al., 2004). Second, the lithological column of the area includes Kimmeridgian clays, Aptian sands and Albian clay layers that crop out below, at, or near the base of the cliff (Evrard and Sinelle, 1980) (Fig. 3). These strata are overlain by Cretaceous chalk usually positioned at higher elevation in the cliff (Juignet, 1974). Third, the cliff morphology is also specific, with a continuous and permanent wedge of collapsed material that hides the lower part of the cliff (Fig. 2b). The height of the cliff varies between 90 and 100 m. In the South, at Octeville, the wedge is about 60-m high and 100-m wide (Fig. 2b). In the North, between the town of Cauville and the Antifer cape, the wedge is 50-m high and 50-m-to-75-m wide.
Along this coastal segment, the permanent wedge does not allow to precisely observe the base of the cliff. During high tide, the mean sea level reaches the widest wedge’s toes, favouring basal erosion of the slided material. In some places, the wedge’s toe may be bounded by an abrupt scarp, several meters high, resulting from marine abrasion.
There has been no precise measurement of historical coastal retreat using aerial photographs comparisons along this coastal segment. Thus gravitational processes leading to slope deformation and cliff retreat are poorly documented. Nevertheless, historical and recent gravity-driven mass-wasting processes and blocks falls on the cliff face have been reported. Very slow displacements (in the order of a few mm/year) are also measured continuously using inclinometers on the wedge at Sainte-Adresse (an urban area).
2.1. Objectives and methodology
The aim of the study is to better understand the type and intensity of the deformation of a 100m high cliff made of different lithological layers having varying mechanical properties. The basic idea is to study the stability of a cliff that comprises one or more sedimentary layers within which the friction is reduced. Gravitational sliding can occur under the effect of high pore-fluid pressure, which reduces the effective stress, hence the rock’s actual strength (Hubbert and Rubbey, 1959 ; Mourgues and Cobbold, 2003, 2006). Le Calvez and Vendeville (2004) have also demonstrated that gravitational sliding can occur without fluid overpressure but above mechanically weak layers, such as evaporites, for example in the vicinity of the Colorado Valley in Canyonlands National Park, Utah. Through these two examples, the layers having weak mechanical strength may allow the overlaying strata to slide gravitationally. The methodology developed in this paper is to combine different experimental techniques (numerical and analogue models) to better understand how a cliff made of various layers having different mechanical strengths can deform under the sole effect of gravity forces (numerical approach) and how the vertical position of overpressured layers can affect the deformation style in both 2-D and 3-D (analogue models).
3. Mechanical parameters
3.1. Cliff litho-stratigraphy
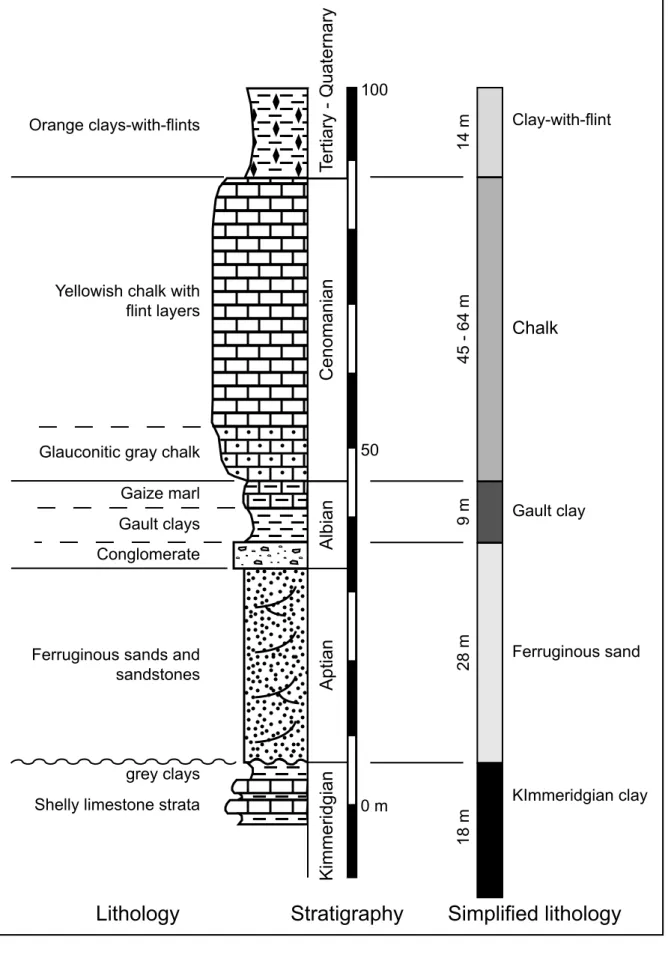
Figure 3 is a stratigraphic column from the La Hève cape, also showing the lithological characteristics. There, the lower Kimmeridgian (6 m thick) is made of alternating layers of grey clays and decimetric shelly limestone strata (Guyader, 1968; Samson et al., 1996). During the Cretaceous transgression, the Aptian sands were deposited directly on top of Lower Kimmeridgian units, with a slight angular unconformity (Juignet, 1974). The Aptian deposits are made of 30 m of ferruginous sands that comprise thin layers of oxidized iron underlining the cross bedding (Cayeux, 1957). The lower Albian sequence starts with a 3-m-thick conglomerate made of pebbles and gravels in a clay-sand matrix. The upper Albian is made of two units: 3 m of black glauconitic clay with some phosphate, and pyrite nodules at the top, known as the Gault clay, and 5 m of fine grey silty marl called Gaize. Albian deposits are overlain by Cenomanian chalk, starting with a 10-m-thick dark grey glauconitic chalk that contains a few hardgrounds and flints (Juignet, 1974, Lasseur, 2007). The glauconitic chalk is overlain
by a yellowish chalk with flints, called “Craie de Rouen” (Juignet, 1974). The Cenomanian chalk-with-flint is more than 30 m thick, with regularly alternating beds of chalk and chalk-with-flints bands. The topmost lithological unit is the clay-with-flint, made of orange-red clays with fragments of small flints. The Clay-with-Flints formed during Plio-Quaternary times by in-situ aerial weathering of the Cenomanian chalk and Cenozoic deposits, and has a thickness ranging between 10 and 20 m (Quesnel, 1997; Laignel et al., 1998).
The Jurassic and Cretaceous series that crop out along the cliff have a gentle regional dip of 0.7° towards the northeast, which results in an apparent dip of 0.1° along the N25E trending coastline (Fig. 4). Therefore the oldest stratigraphic units, such as the Kimmeridgian clay, crop out above the cliff’s base in the southern part of the coastline near Sainte-Adresse town, whereas their vertical position deepens progressively northward until they eventually become located well below the cliff’s base (Fig. 5). The Kimmeridgian clays are exposed at the base of the cliff from La Hève cape to Octeville and the Albian Gault clays reach the cliff base between Cauville and the Antifer cape (Fig. 4 and 5).
3.2. Material sampling
The values of the mechanical parameters we used in our modelling approach were derived from rock-mechanics tests conducted on natural, undisturbed samples collected in the field between the La Hève and Antifer capes. The following five main lithologies of the cliff were sampled (Fig. 4): (1) the Kimmeridgian clay and (2) Aptian sands at the La Hève cape, (3) the Albian Gault clay at the base of the Cauville cliff, (4) the Cenomanian chalk at the Antifer harbour, and (5) the Clay-with-flints at the top of the cliff, south of Cauville. Only the Gault clay and the clay-with-flint were directly cored in the field using hand-held drills, whereas the Kimmeridgian clay, sand and chalk were sampled as blocks, then cored in the laboratory later. All samples were cored perpendicularly to bedding. For each lithological unit, at least three cylindrical samples were acquired. All samples were sealed in bags in the field in order to preserve their natural water content. The final core samples were cylindrical, having a diameter close to 35 mm (34.4 - 34.8 mm) for the clays and sands, and close to 50 mm (50.7 - 53.8 mm) for the chalk. The ratio between length and diameter was set to 2 (1.96 - 2.01) for all samples, leading to a core length close to 70 mm (68.46 - 70 mm) for the clays and sands, and 100 mm (100.8 -
107.4 mm) for the Chalk. Core sizes, shape and geometries are in accordance with classic standards used in soil mechanics (for sands and clays) and rock mechanics (for the Chalk).
3.3. Approaches and results
For each lithological unit, we performed two different tests, (1) the immersion method aimed at determining the density and water content, and (2) triaxial tests measuring the values of rheological parameters (e.g., cohesion, angle of internal friction, elastic modulus).
The immersion method (Fleureau et al., 1993) consists of weighing each sample under the three following conditions: Natural condition (i.e., close to sampling conditions), dry condition (after drying in an oven at 100°C for 24 h), and under saturated conditions (pores are fully filled with kerdane oil). Table 1 lists the results for all five lithological units.
Triaxial tests were conducted for at least three samples of each lithological unit and under Consolidated-Drained (CD) conditions. The tests were conducted under condition of controlled pore-fluid pressure and confining pressure. Each sample was first saturated with water, then a specific confining pressure was applied (sometimes leading to some compaction of the sample). The values for effective consolidation pressures (
σ
3'=
σ
3−
u
) ranged between 200 and 1000 kPa for sands and clays, and between 400 and 1200 kPa for the chalk. Subsequently, the sample was allowed to drain during shortening in order to maintain a constant pore-fluid pressure. Shortening was applied by a loading press at a constant displacement rate of 0.01 mm.min-1 for the clays, 0.1 mm.min-1 for the sand and 0.5 mm.min-1 for the chalk. We chose different rates for clays and sands CD in order to allowfor dissipation of the excess pore-fluid pressure, using lower displacement rates for low-permeability samples and higher rates for more permeable samples. During the test, the axial strain ε1 and the axial
strength σ1 were recorded every 10 seconds.
For each sample, failure occurred when the deviatoric stress reached a maximum value
(
σ
1−
σ
3)
max, corresponding to a specific value of the axial strain: about 10 % for the Kimmeridgian clays, 10 % for the clay-with-flint, 15 % for the albian clays, 12 % for the Aptian sands, 1 % for the Cenomanian Chalk. For each sample, the corresponding Mohr-Coulomb circle was determined at the stage of failure. For each lithology, deformation of three samples under three different values of confiningpressures provides values for three Mohr circles having different diameters. This allows to calculate the effective parameters of the Mohr-Coulomb failure criterion: the effective cohesion (c’) and the effective internal friction angle (φ’). In order to estimate the elastic modulus, we chose to measure the tangent modulus at half the value of the maximum deviatoric stress (Et50), on the deviatoric
stress-strain plot.
As underlined by previous work (Monjoie et al., 1985 ; Matthews and Clayton, 1993; Lord et al., 2002), mechanical properties of the chalk present very large variations as a function of the effective confining pressure the silica content, and the chalk porosity (with intact Young’s modulus of 30GPa for low porosity chalks and of the order of 1 GPa for high-porosity chalks). We thus chose to test in-situ chalk samples to better determine the local mechanical characteristics of the Cenomanian Chalk. We only tested three chalk samples, cored in the chalky layers of the Cenomanian Chalk. Two samples contained some flints included within the chalk matrix and they gave minimal and maximal values of Et50. The chalk sample without flints gave the mid value of Et50. Even if these data need to be
considered as a first approximation, they may be considered as roughly representative of the Cenomanian Chalk in Normandy. Results are summarized in Table 2.
4. Numerical simulation
4.1. Mechanical law and code type
We ran 2-D numerical simulations using a finite-element method for space discretisation, combined with a dynamic relaxation method for time discretisation. We used the ADELI code, developed by Hassani (1994) and described in Hassani et al (1997).
A finite-element approach also allows discretizing complex geometries using only a limited number of mesh elements. Stresses and strains resulting from externally imposed boundary conditions are computed for each node of the mesh. The following nonlinear system of equation is established, following the dynamic fundamental law:
)
,
,
(
)
,
(
)
,
,
(
intu
u
t
F
u
t
F
u
u
t
F
u
M
&&
=
&
+
ext+
c&
(1)where
F
int,F
extandF
c are, respectively, the internal force, the external nodal force, and the contactfictitious mass, chosen in a diagonal form by nodal concentration as described by Hassani et al. (1997). This method is coupled with an explicit finite-difference scheme for the time discretisation of Eq. 1. The maximum length of the time step Δt is limited by the stability condition of the explicit scheme, which depends on the values of the mass matrix. As we are only interested by a quasi-static solution of Eq. 1, the mass matrix is adjusted in such a way (see Cundall and Board, 1988) that the stability condition is ensured for a given time step. In other words, a fictive density
ρ
~
for each mesh is computed from the chosen time step Δt, the element size and the elastic parameters in such a way that the travel time of for a P wave to cross a mesh is greater than the user time step Δt:2
)
3
4
(
~
⎟
⎠
⎞
⎜
⎝
⎛ Δ
+
=
h
t
r
G
K
ρ
(2)where h is the smallest dimension of the mesh, K and G the bulk and shear modulus and r a safety factor chosen to be greater than 1 (Hassani et al., 1997).
A quasi-static solution can be reached progressively when
M
u
&&
, a parameter that measures the inertial forces, may or may not converge toward a value that is negligible compared with the external forces. Applied to gravitational instability, model convergence (quasi-static deformation) means that the model is slowly strained or remains static. The convergence of the numerical solution is used in this work as a criterion for model stability. In other simulations, no quasi-static solution, hence no convergence, can be reached (Divergence;M
u
&&
≠
0
). In practice, divergence means that one or more mesh element starts to be strained to infinite values. The computation is then aborted. However, although a diverging solution indicates that one mesh is instable, this does not mean that the entire cliff has been destabilized.The mechanical behaviour of each layer is modelled using a perfect elastoplastic law. The elastic part is modelled using the elastic linear isotropic Hook’s law, whereas we use the Drucker-Pragger failure criterion for the transition between elastic and plastic states. A full description of the rheological characteristics of each lithological unit requires only five parameters. These are the Poisson coefficient (ν) and the Young’s modulus (E) for Hook’s law, and the effective cohesion (c’) and the effective internal friction angle (ϕ’) for the criterion of failure, and, finally, the bulk density (for computing lithostatic stress).
One limitation of the finite-element approach is that no true discrete discontinuities, such as slip planes, can be generated within the mesh. Therefore the approach cannot model the formation and evolution of fault planes. A mesh element can only be stretched, shortened and sheared, but cannot split into multiple elements during the simulation. As a consequence, a fault plane in nature is modelled with FEM as a narrow band of high plastic strain, analogous to shear bands or shear zones in nature. For practical reasons, in all our numerical models, we map the total plastic-strain amplitude using a colour scale restricted between 0 and 5 % strain.
4.2. Model geometry
The geometric design for all models was inspired from that of the four coast-perpendicular cross sections illustrated in Figure 5, ranging from Antifer Cape (Section a), Antifer Harbour (Section b), Cauville (Section c), to Octeville (Section d).
The models comprised five sub-horizontal layers, each representing a simplified version of the lithological units described in Figure 3. At Antifer Cape, the Gault clay was located below the base of the cliff. At Antifer Harbour, the Gault clay was located at the base of the cliff. At Cauville, the Gault clay was positioned at mid cliff, at the top of the wedge. At Octeville, the Gault clay was located also at mid height of the cliff, whereas the Kimmeridgian clay was located at the base of the cliff.
We used two different topographic profiles, depending on the morphology observed in nature. In the first simulation of Antifer Cape, the cliff is entirely made of chalk and is vertical. For the other three simulations, the initial geometry comprised a vertical chalk cliff in the upper part, and a wedge of collapsed material in the lower part, as observed in the field between Antifer Harbour and Octeville. In these three simulations, we assumed that in nature, the lithological layering in the cliff did not prolong seaward into the wedge. Instead we assumed that the wedge material was a mixture of sand/clay matrix containing a few disrupted chalk blocks. Therefore, we chose physical properties closer to those of either sand or clay.
4.3. Numerical characteristics
The geometric dimensions were based on data from the 1:25000 IGN (Institut Géographique National) topographic maps. As shown in Figure 6, the total length for each numerical model was 2100 m, comprising three segments: a 1365-m-long onshore segment (L in Figure 6) having a constant elevation of 100 m, a seaward-sloping wedge, and a shore segment 630-m long (S in Figure 6). Note that the wedge’s length and height varied between the southernmost section and northernmost one in order to account for the above topographic data from the field area. The total thickness of all models was 200 m (d on Figure 6).
The free surfaces of the model (land, cliff face and shore platform) were topographic surfaces having no restriction on displacements. No normal displacements were allowed along the left, right and bottom boundaries. By contrast, free slip was allowed along the right and left vertical boundaries, whereas no slip was allowed along the horizontal base. The entire model was subjected to a natural gravity field having a value of g=10 m.s-2 and oriented vertically. In all models, gravity was applied instantaneously, rather than progressively.
For any given geometry, we tested each model using varying time steps and numbers of mesh elements to ensure that the computed strains were not artefacts related to specific numerical parameters. Because the rheological laws involved in of our simulations are all independent of time and strain rates (unlike, for example, a viscous behaviour), there were no physical relations between the computed time in a simulation and real time in nature. For that reason, we express durations during our simulations using an arbitrary unit to which we refer as Numerical Time Unit (NTU), and velocities in m/NTU. The total number of tested mesh sizes ranged between 20 000 and 140 000 elements, whereas the time-step number ranged between 15 000 and 1.5 million steps,with the same maximum duration of 100 numerical time units (NTU). The time-step length was calculated as the maximum duration divided by the number of steps; it ranged between 2 000 s (6.34 10-5 NTU) and 200 000 s (6.34 10-3 NTU). The number of elements has an impact on the spatial resolution (mesh size), whereas the number of time steps has an impact on the time resolution (length of time step) and computating time. A compromise was found between reaching a good spatial and temporal resolution and a manageable computing duration. The model was sampled using 80 000 mesh elements with a spatial resolution between 1 and 2 m, depending on the entire thickness of the model (d in Fig. 6). The time was sampled with 1.5 105 steps with a temporal resolution of 6.34 10-4 NTU. The notion of time is
only a numerical reference, and all indication of time is relative to these simulations, especially for the time-step length. Although displacement values are real, speed and acceleration values have real meaning in terms of computing time and speed, rather than actual values in nature.
The mechanical properties used for each lithological unit are summarized in Table 3. The Poisson coefficient was fixed to a value of 0.3 for all units.. For the chalk layer, the values used for Et50, c’ and
ϕ’ were those measured on samples of chalk-with -lint and chalk without flints, whereas the values of the bulk density came from data from the chalk matrix without flints.
4.4. Results
The main results are illustrated in Figures 7 to 9. In all figures, we illustrate (1) the total plastic strain using a colour scale (blue to red), (2) the final geometry of the topographic surface and of the boundaries of each lithological unit, and (3) the instantaneous displacement vectors at the end of the experiment. In addition, for each model, we calculated the average rate of seaward horizontal displacement of selected nodes on the section, a parameter that allows us to estimate displacement rates throughout the entire evolution of the system. In all simulations, only a small part of the model showed significant displacements and strains. Figure 7 illustrates the entire section of the deformed model. In all other figures (8 and 9), we only illustrate the part of the model that has undergone significant strain and displacement (about 400-m long, out of a total model length of 2100 m; see insets in Fig 8 and 9).
The model illustrated in figure 8 corresponds to a section located at the Antifer Cape, where the Gault clay is located below the cliff’s base, and the cliff is vertical and entirely made of chalk. The total duration of the simulation was 100 NTU. For this set-up, a quasi-static solution was found progressively, and the results converged. Values for the instantaneous displacements are extremely low. The strain of the vertical cliff was negligible, as is the value of the average rate of horizontal displacement (0.04 m/NTU, calculated at the point P). Therefore, the cliff was stable and did not deform.
The next three sections (Figures 9 a, b, c) are progressively located southward. In all three models, the field of instantaneous displacement vectors indicates a global seaward translation of the wedge and the adjacent onshore plateau. Displacement vectors are oblique with respect to the horizontal in
the upper part of the plateau, and become horizontal near the base of the system. In all simulations, the cliff base (point P) moves seaward faster than the top cliff (point P’). Plastic strains are localized in two main zones: the first one is 150 to 200-m-wide and 10-m-thick and is located onshore, near the top of the Gault Clay. The second zone is narrower (less than 50 m wide) but much thicker (50 m or more), is located at the contact between the wedge and the plateau, and affects strata comprised between base and the top.
The two models in Figures 9 a and b simulated two sections located at Antifer harbour and Cauville, respectively, where the Gault clay layer is located above sea level, either near the wedge’s base (Antifer Harbour, Fig. 9a) or near the wedge’s top (Cauville, Fig. b). Both models ran for a total duration of 10 NTU and eventually converged toward a quasi-static solution, indicating that the wedge-cliff system had reached a steady-state deformation. The maximum displacements reached about 0.04 mm. There was a displacement differential between the base (Point P) and the top (point P’) of the cliff. At Antifer harbour (Fig. 9a), the average displacement rate at the base of the cliff (0.3 m/NTU) is five times higher than that at the top cliff (0.06 m/NTU). At Cauville (Fig. 9b), the base displacement (0.5 m/NTU) is more than six times higher (625 %) than that at the top cliff (0.08 m/NTU).
The third model (Figures 9c) simulated a section located farther South, at Octeville, where the Gault clay layer is located at the top of the wedge, and the Kimmeridgian clay is positioned at sea level. The model ran for a total duration of 0.16 NTU before it became unstable and started diverging. Strictly speaking, one should not directly compare converging and diverging simulations, especially in terms of instantaneous displacements. The converging and diverging simulations do not correspond to models having the same total number of iterations. The diverging simulation stopped at an earlier stage than the converging one. As a consequence, the role of inertial forces in the diverging model was greater, hence displacements were larger, than in converging models. This explains why instantaneous displacements were much greater than in the two previous models (up to 20 mm at point P). However, this pitfall can be overcome using average displacement rates during the entire simulation, rather than instantaneous rates, thus allowing a direct comparison between converging and diverging models. The average displacement rate was calculated by geometrically comparing the initial (at t0) and final (at t) positions of selected nodes divided by the elapsed time between t0 and t. .
The calculated average displacement rate for the base of the wedge (point P in Fig. 9c) was 42.15 m/NTU, almost two orders of magnitude greater than that in the two previous models. The top cliff
average displacement rate was 1.75 m/NTU (point P’ in Fig. 9c). In addition, this model (Fig. 9c) comprised a third zone of high plastic strain located in the compressional domain at the toe of the wedge. The differential in displacement rate between the top (point P’) and the base cliff (point P) was highest with a basal displacement 24 times more important than the top cliff.
Comparison between these four models reveals a progressive trend from North to South: increase in instantaneous displacements, average displacement rates, and differential velocity increase between the top and the base of the cliff.
The differences in cohesion values between each lithological unit may explain the differences in displacement along the cliff’s face. The cliff’s top is modelled by chalk having a high cohesion value (1890 kPa) and always exhibits small seaward displacements, as shown in Figure 8. An increase in the thickness of the Aptian sand cropping out along the cliff face favoured seaward extrusion of sand,, which has a low cohesion (80 kPa, i.e. 24 times lower than the chalk cohesion). Whereas the overlying chalk layers, having a high cohesion, deformed much less. The Gault clay layer had a cohesion of 54 kPa. Simulations predict a mechanically -decoupling level located between the base of the Chalk and the top of the Gault clays, decoupling that resulted from the low-cohesion clays and the highly cohesive chalk. The northern simulations reached a quasi-static equilibrium, whereas the southernmost section became instable after a short period of computing time. Finally, the volume of material affected by high plastic strain increased southward, with only the southernmost model showing compressional strains at the toe of the wedge. All these observations suggest that going southward, as the potential décollement layers (Gault and Kimmeridgian clays) become shallower, the cliff is potentially less stable and deforms faster and earlier.
Because of the lack of true temporal scaling between the numerical simulations and nature, the models provide trends, rather than actual time predictions, on the evolution of the cliffs. The average displacement rates quoted in the above sections cannot be translated directly into displacement rates in nature. However, this computing time allow comparing the deformation rates between different numerical models. Quantitative data do exist in nature: At Sainte-Adresse, real displacements were measured on the surface of the wedge, where small-scale cracks have formed during the last twenty years. Data from boreholes equipped with inclinometers, have recorded seaward horizontal movements that occur mainly at the contact between the Kimmeridgian clay and the Aptian sands. Ongoing continuous monitoring using inclinometers indicates that the average displacement rate
varies with the water table elevation, from 0.1 to 0.6 cm/year during dry years up to 1-2 cm/year during rainy years (1985 and 1987).
5. Experimental modelling
The numerical code we used in the above examples could not simulate large strains and displacements, particularly once slip or fault planes have formed. Neither could it simulate the mechanical effect of pore-fluid pressure. Finally, it was designed strictly for 2-D models. Because of these reasons, we decided to supplement our numerical approach with an experimental (analogue) one. An experimental approach has advantages and limitations. For example, any physical model is, by nature, a 3-D object. Also, physical models can deform up to large amounts of finite strain, including strain accommodated by slip along fault planes or narrow shear zones. On the other hand, experimental modelling is constrained by the limited availability of materials and techniques. For that reason, the rheology of the materials we used in our experiment could not be tailored to that of the lithologic column in the natural example as precisely as in numerical model. However, it is sufficient to provide insights on how a cliff made of various layers having different mechanical strength can deform under the sole effect of gravity forces, and how the vertical position of these overpressured layers can affect the deformation style in both 2-D and 3-D.
5.1. Bases
In the natural example, all the cliff layers of brittle rocks, obeyed a frictional-plastic criterion, albeit having different effective strength, in part related to the presence of fluids. Hubbert and Rubbey (1959) demonstrated that overthrust faulting can be explained by the mechanical influence of interstitial pore pressure on the effective stress in rocks. The role of fluid overpressure as a triggering parameter for gravitational sliding has been successfully tested experimentally by Mourgues and Cobbold (2003, 2006) by injecting compressed air at the base of physical models made of porous materials having varying permeability. Their experiments indicate that, when fluids are injected from the base up, and those fluids concentrate near the base of a low-permeability layer, this interface acts as detachment level. Mourgues and Cobbold (2003, 2006) designed their experiments on examples where the pore fluid was thermogenic gas produced by hydrocarbon cracking at depth. Even if the pore fluid is meteoric water, the mechanical effect remains similar, i.e., a reduction in effective strength of the
overpressured layer. In the case of the multi-layer coastal cliff, the two clays layers (Kimmeridgian and Albian) are able to act as potential sliding surfaces because of their mechanical properties and their low permeabilities localising the base of the water table and potential fluid overpressure.
The following physical experiments thus illustrate the deformation of a cliff system that includes one or more layers subjected to fluid overpressure, using compressed air injected at the base of the model. But the compressed air does not, in any case, simulate physically the interstitial meteoric water responsible for overpressure in nature. Instead, it is the mechanical weakening of the affected layer that we modelled.
In this article, we tested the effect of the upper Albian clays using experimental models with pore pressure generation. The model simulated the upper part of the cliff: we modelled only the chalk, the Gault clays and the ferruginous sands. The model focused on the transition from a cliff with outcropping clays to a pure chalky cliff beneath which the clays layer progressively buried below sea level (Fig. 5). Concentrating the overpressure localisation was achieved by using a multilayer made of slightly damp, dry and wet sand as well as low-permeability glass microbeads. In the experiment, the fluid pressure was progressively raised, thus decreasing the effective strength of the model until sliding occurred. Several episodes of fluid pressure increase, combined with erosion of the toe of the wedge, were performed to obtain a succession of sliding events.
5.2. Materials and scaling
We used coarse natural quartz sand as an analogue for the Cenomanian and Aptian layers, and glass microbeads for the Albian clays. These two materials have different particle size distribution of 200-400 10-6 m and 53-106 10-6 m, respectively, with intrinsic permeability values of 9.2 10-11 m2/s (100 millidarcy) for the sand and 9.2 10-12 m2/s (10 millidarcy) for the microbeads.
Using the equation of dynamics written in dimensionless form, we can calculate a ratio between surface and body stresses (σ/ρgL). Keeping this ratio equal between nature and model ensures that dynamic similarity is maintained. This imposed a scaling ratio for stresses expressed as a function of density, length and gravitational acceleration ratios (Hubbert, 1937; Vendeville et al., 1987; Eisensteadt et al., 1997):
*
*
*
*
ρ
g
L
σ
=
(3) where n mσ
σ
σ
*
=
, n mρ
ρ
ρ
*
=
, n mg
g
g
*
=
and n mL
L
L
*
=
(4)are the model (m) to nature (n) ratios for stress, density, gravitational acceleration and length, respectively. All experiment were conducted under a natural gravity field, hence
g
*
=
1
. The length ratio was set to 4 10-4. A 150 long sand model represented a 3.75 km long coastline. Using these values, Equation (3) becomes:4
10
.
4
*
*
≈ L
≈
−σ
(5)For both analogue and natural materials obeying a brittle behaviour, the Mohr-Coulomb criterion is also subjected to scaling rules as follows:
' ' ' n
c
μ
σ
τ
=
+
(6)Equation (6) expresses the shear stress τ as a function of the effective cohesion, the effective coefficient of internal friction, ' '
tan
ϕ
μ
=
and the effective normal stress, σ’n. This requires that μ’ isidentical in model and nature, and that the ratio for cohesion be equal to the stress ratio.
The application of the scaling procedure to cohesion values measured on rock samples provides a range of theorical cohesions that must be used for the analogue material during modelling (Table 4). Dry granular materials, such as glass microbeads or quartz sand, have appropriate values for modelling brittle rocks at laboratory scale (Davy and Cobbold, 1991; Schellart, 2000). Dry well-sorted, natural quartz sand presents a maximal cohesion of about 30 Pa (Mourgues and Cobbold, 2003). This represents a good analogue material for the Aptian sand. We used damp natural sand as an analogue of the Cenomanian chalk (with a cohesion value estimated to vary between 230 and 1100 Pa) and glass microbeads as analogue of the Kimmeridgian and Albian clays. However the cohesion of the analogue material used in the model was not measured precisely, but values were calculated using the model-to-nature ratio (Table 4).
We used a technique of air injection at the base of the model, a technique developed by Mourgues and Cobbold (2003), in order to generate differences in effective strength within the sedimentary
column. The high pore-fluid pressure concentrates at the base of the low-permeability layers (such as the glass microbeads), making them much weaker than the coarse high-permeability sand layer above and below.
It is important to emphasize here that in the process, we tried to properly scale the decrease in effective strength (which depends on the pressure coefficient, λ, the ratio between fluid pressure and lithostatic pressure), rather than scaling the air flow in the models with the water flow in nature. In all experiments, we tested the models by progressively increasing the fluid pressure until its value approached that of lithostatic pressure.
5.3. Geometry
We ran two sets of models. First we conducted experiments on cylindrical (linear) structures whose geometry did not vary significantly along strike. These experiments tested how a cliff system, having one or more low-permeability layer and low effective strength at its base could spontaneously deform under gravity forces only, somewhat analogous to the 2-D numerical simulations described above. Second, we tested a model in which the vertical position of the potential layer varied along strike, and how it impacted the intensity and aerial extend of deformation, as well as the trend of the deformed front
The basic concept is simple (Fig. 10; Ramberg, 1981; Vendeville, 2005): The presence of a local or regional surface slope, such as the bathymetric slope along a passive margin, or, at a smaller scale, a cliff, can generate driving forces great enough for sliding to occur. In most cases, these forces are successfully resisted by the frictional stresses between the beds forming the cliff. However, if one or more of these interfaces is affected by fluid overpressure, the effective resistance to shear decreases, and sliding may occur because of the reduced basal friction and the lack of lateral buttressing resistance. Ideally, if such sliding occurs, a compressional toe forms at the base of the cliff, acting as a buttress that resists further forward advance of the collapsing cliff (Fig. 10-a2). However, as is observed along the Normandy coast, if this toe is then removed by sea erosion during high sea level, the deformation process can continue (Fig. 10-a3). In the field (Fig. 10b), where the slope wedges are expanding seaward onto the beach, erosion of the toe occurs naturally under the effect of the sea. At high tide, the mean sea level reaches the distal part of the wedge’s toes and is favouring the basal
erosion of the sliding material. In some places, the wedge’s toe may be bound by an abrupt scarp several meters high. During the experiments, we raised the air pressure until deformation occurred, until it became blocked by the compressional toe. We then stopped the air flow, and eroded the compressional toe. Finally, we raised the air pressure again in order to trigger another episode of sliding.
5.3.1. Model I: one horizontal décollement layer located at the base of the cliff
In this experiment (Fig. 11), all the layers were initially horizontal and tabular. This model was a simplified version that does not reproduces exactly every parameter in the of the natural example, but aimed at testing the effect specific boundary conditions (a free boundary representing the cliff and the wedge) on the equilibrium of the system. The model comprised (1) a 30-mm-thick basal layer of coarse, high-permeability (100 millidarcy) dry sand, representing the pre-Kimmeridgian sequence in nature, (2) a 5-mm-thick layer of low-permeability (10 millidarcy) glass microbeads (bright red in Figure 11), representing the Kimmeridgian clays, and (3) a 40-mm-thick cover of coarse, high-permeability (100 millidarcy) dry sand, representing the Aptian sands (Fig. 11). The model was layered using sands having different colours but similar mechanical properties. The potential décollement layer (microbeads) was positioned right at the base of the cliff. The model was constructed on the air-injection table and had initial planform dimensions of 80 cm x 60 cm. We created a initial linear cliff by removing the décollement layer and its cover using a scraper. Because the analogue materials had a low cohesion, the initial cliff was not vertical, but its slope was that of dry sand’s typical angle of repose, about 30°. We then started to gradually raise the air pressure applied to the model’s base until spontaneous gravity-driven deformation occurred. We used a 1-D simple calculation of air flow to estimate the vertical pressure distribution across the model, which indicated that the zone of maximum values for the coefficient of fluid pressure (λ), hence of lowest effective strength, was at or near the base of the layer of microbeads. In addition, the effective strength of the overlying coarse-sand cover was also lowered by about one third.
The increase in air pressure reduced the frictional resistance at the base of the cliff, thereby allowing it to spread seaward by overall translation of the cover and thinning by normal faults that rooted at depth into the microbead layer (Fig. 11). The first faults formed near the initial cliff, whereas younger faults
propagated inland. As the cover spread seaward, a small compressional bulge formed at its toe. We increased the air pressure until spreading became totally blocked by the resisting toe bulge, which acted as a buttress. We then stopped the air flow and eroded the toe bulge, then repeated the process several times. Figure 11 is a cross section cut at the end of the experiment. It illustrates a set of normal faults, most of them dipping seaward, that root into the microbeads layer (red in Figure 11) and affect an area about 3 to 4 times the thickness of the cover.
Clearly, this simple experiment demonstrates that the presence of fluid overpressure, combined with the absence of a frontal buttress, can trigger spontaneous dismemberment of a cliff that otherwise would remain stable. Seaward spreading creates a frontal toe bulge similar to what is observed in nature (Fig. 10b), and whose continuous erosion facilitates further spreading.
5.3.2. Model II: two horizontal décollement layers
This model (Fig. 12) was constructed and deformed following the same procedure as Model I, but it comprised two potential décollement layers (Fig. 12). The model included (1) a 30-mm-thick basal layer of coarse, high-permeability (100 millidarcy) dry sand, representing the pre-Kimmeridgian section in nature, (2) a 3-mm-thick layer of low-permeability (10 millidarcy) glass microbeads, representing the Kimmeridgian clays, (3) a 15-mm-thick layer of coarse, high-permeability (100 millidarcy) dry sand, representing the Aptian sands, (4) a 7-mm-thick layer of low-permeability (10 millidarcy) glass microbeads, representing the Gault clay, and (5) a 20-mm-thick layer of coarse, high-permeability (100 millidarcy) damp sand, representing the Chalk. One potential décollement layer (microbeads) was positioned right at the base of the cliff, a geometry analogous to that of the Kimmeridgian clays at La Hève cape and Sainte-Adresse. The model had planar dimensions of 80 cm x 60 cm.
We followed the same deformation procedure as that of in Model I and, overall, the resulting deformation patterns were similar. The region of the model located near the initial cliff spread seaward, which generated a set of normal faults that propagated landward. The main difference between the two models is that there was some amount of decoupling along the mid-cliff décollement layer. Some faults soled out into the upper décollement layer, whereas others rooted into the basal one. Note that in both models, most faults dipped seaward.
5.3.3. Model III: one gently-dipping décollement layer
Models I and II tested the gravitational deformation of a cliff where all strata were horizontal and tabular. In Model III, we modelled a more complex initial geometry closer to that observed in the field by simulating the progressive deepening of a potential décollement layer (the Gault Clay) northward (Figs. 13 to 16).
The sketch in Figure 13 illustrates this set up. The model was 150-cm long and 60-cm wide. Its total thickness, hence the total height of the cliff, remained constant (6 cm), but the microbead layer dipped 1° to the NNE. In the SSW part of the model, a 5-mm-thick layer of microbeads was located at or above the cliff’s base, and was overlain by a 30-mm-thick layer of coarse sand, representing the, Aptian, Gault Clays (Albian) and Cenomanian series. The vertical position of the microbead layer deepened progressively northward, while its cover thickened. In the NNE the microbead layer was overlain by a 55-mm-thick layer of coarse sand.
As in the other experiments, we first created a linear initial cliff, then progressively raised the air pressure. There were 14 successive episodes, in between which we continuously removed the compressional toe. The last sliding episode was accommodated inland by a large graben. In order to avoid explosion and the formation of fluid-escape structures (sand volcanoes in the experiments), as is the case when thinning of the cover by normal faults reduces the lithostatic pressure and thereby raises locally the coefficient of fluid pressure at or above 1, we filled this graben with syntectonic sediments. This did not affect the outcome of the experiment. The overall deformation pattern was similar to those in Models I and II in that the region near the cliff started sliding seaward, and that seaward-dipping normal faults propagated landward. This is illustrated by the cross sections 3 and 4 in Figure 14. However, the amount and style of deformation varied along strike. In the segment of the model where the potential décollement layer (microbeads) was above or at the cliff’s base, the absence of frontal buttress allowed a large part of the cliff to slide seaward (Sections 3 and 4 in Figure 14). Going northward, the potential décollement layer became positioned deeper, below the base of the cliff. The amount of deformation and seaward translation progressively decreased northward (Section 2, Figure 14).There, a compressional bulge formed in front of the cliff’s base. The far end of the model (Section 1, Figure 14) did not deform at all.
The reasons for this change in pattern are summarized in Figure 15. Where the potential décollement layer crops out, the cliff is not laterally buttressed and can freely be translated seaward (a in Figure 15). Where the potential décollement layer lies beneath the cliff’s base (b and c in Figure 15), the strata overlying the décollement layer on the shore act as a frontal buttress that resists seaward translation of the cliff. If these strata are thin, their resistance can be overcome by gravitational forces, and they deform by folding or thrusting (b in Figure 15). But where these strata are thicker, hence more resistant (c in Figure 15), they efficiently block any further deformation.
Interestingly, the along-strike change in the width of the deformed area is gradual, rather than abrupt. Figure 16 shows both oblique views of the model during its evolution and an overhead photograph at the end of the experiment. On the overhead photograph, the lower part corresponds to the region where the potential décollement lay at or above the cliff’s base. There, the width of the deformed area was maximum. The photograph illustrates how this deformed domain progressively narrowed down along-strike, until no deformation at all occurred in the NNW part of the model, even though this area was subjected to the same amount of fluid overpressure. Along strike, the resisting contribution of the buttress varied progressively. During the experiment, the southern part deformed more, and propagated farther and faster landward than in the North. The limit of the area affected by sliding, marked by the fault located most inland was initially parallel to the original cliff. However, as more episodes of sliding took place, and because this limit migrated landward faster in the South than in the North, the limit became more and more oblique with respect to the original cliff direction (Fig. 16d). Assuming that a cliff that is affected by sliding can be eroded faster than a non-deformed one, results from Model III lead us to hypothesize that because cliff retreat would be faster along the southern segment, the overall cliff trend would progressively rotate counter clockwise as deformation progresses.
6. Discussion
6.1. Conceptual model of coastline evolution by interacting deformation and erosion
Results from the above numerical and physical models clearly indicate that one key parameter in the structural evolution of a chalk cliff is the presence or absence of at least one potential décollement layer cropping out at or near the base of or above the cliff’s base. Where the potential décollement(s)
are buried well beneath the cliff’s base, the chalk strata located beneath the shore platform and above the décollement are thick enough (hence strong enough) to act as an efficient seaward buttress that opposes any seaward sliding of the cliff (Fig. 8, Fig. 14-1, Fig. 15c). Therefore the system is structurally stable, and the cliff can retreat only by sudden local collapse related to other physical processes, such as rain-water infiltration in pre-existing fracture networks within the chalk (e.g., Duperret et al., 2004). In such a case, only a limited volume of debris (flint shingle beach) is left at the base of the cliff, and these debris are easily removed during high sea levels (high tides).
The cliff-retreat process differs where the potential décollement layer is located just beneath, at, or above the base of the cliff (Fig. 11, Fig. 14-2-3, Fig. 15a-b). There, the absence of any seaward buttress allows for gravitational sliding of parts of the chalk layer, characterized by the formation of a wedge made of normal-faulted material along the lower half of the cliff, and a compressional toe located at the seaward tip of the wedge. The numerical and physical models also indicate that the amount of gravitational sliding increases where the décollement layer is located higher in the cliff, and even more so if additional mechanically weak layers (Aptian sands, Gault clay) are exposed along the cliff’s face, thereby reducing the overall strength of the entire lithologic column. The evolution of physical models has illustrated that, as the wedge forms, its toe thickens and starts acting as a buttress resisting further seaward sliding of the wedge, which eventually stops further gravitational deformation. In the experiments, eroding this compressional toe effectively removed the seaward buttress and allowed for renewed sliding to occur. Likewise, in the Normandy field case, there are clear examples (illustrated in Figure 10b), where the wedge toes have been recently eroded near the cliff base during high tide sea level, as it was recorded by the formation of a vertical scarp of about 10m high in the wedge (Figure 10). A new episode of sliding would create a new compressional toe, which itself would be eroded, leading to further coastline retreat. Local field observations confirm that the key parameters controlling the cliff evolution are the mean sea-level position and the height of the shore platform with beach accumulation, as demonstrated using numerical modelling (Trenhaile, 2002, 2004; de Lange and Moon, 2005). In our study, the vertical position of one or more potential décollement layer within the cliff appears to be an additional key parameter controlling the cliff evolution.
This concept can be applied to the Upper Normandy example as illustrated in Figure 17. North of Antifer harbour, where the entire cliff is made of chalk and the Gault clay lies deep below the cliff’s
base, no gravitational sliding can occur, and the coastline retreats only by local catastrophic collapse. The whole cliff remains vertical (Fig. 17a). South of Antifer harbour, the elevation of Gault clay layer increases, thus allowing for gravitational sliding to occur and the cliff to retreat faster. The new cliff comprises a wedge made of faulted and collapsed material with an overlying vertical chalk cliff at the top (Fig. 17 b). Further South, the other mechanically weak layers (Aptian sands and Kimmeridgian clay) become located above the cliff’s base, leading to even greater and faster seaward sliding and coastline retreat (Fig. 17c). The above reasoning may explain how an initially linear coastline parallel to the regional trend of the English Channel (N60) could have evolved into two segments having different trends, depending on the verticl position of the weak layer (Gault and Kimmeridgian clays and Aptian sands). According to this scheme, the rate of coastline retreat would increase southward, with the coast segment between the La Hève cape and Antifer harbour progressively rotating counter clockwise rotation under the combined effect of seaward sliding and marine erosion of the compressional toe. By contrast, the rate of coastline retreat would be constant (and lower) along the entire segment located northeast of Antifer harbour, which is subjected only to local sudden collapse.
6.2. Coastal morpho-bathymetry
On one hand, Northeast of the Antifer cape, up to Veulettes-sur-Mer, the present-day coastline trends about N60E (Figs.1 and 18), and the offshore bathymetry can reach about 30 m water depth. Along this coastal section entirely made of chalk, the erosion rates appear to have remained relatively constant through time. This is evidenced by the smooth and regular bathymetric slope, and by coast-parallel bathymetric contour lines that represent the paleo-position of the cliff’s base. Here, coastal chalk cliffs are progressively eroded by recurrent collapses (e.g., Duperret et al., 2004). On the other hand, southwest of the Antifer cape up to the La Hève cape, the present-day coastline trends N25E. Offshore bathymetric contour lines have a fan shape, with a trend changing progressively from a N60E trend (at water depths of 30-25m) to a N25E trend (at water depths of 15m water). These trends change markedly in present day coastline and bathymetry between the Antifer cape and the Antifer harbour, where the Gault clay layer begins to crop out along the cliff’s face. For example, southwest of the Antifer cape, the N60E trending, 25m isobath may be considered as one paleo-position of the coastline. The geometric reconstruction of the cliff at this paleo-position suggests greater velocities of erosion cliff retreat in the southern part of the coast (southwest of Antifer harbour) than in the northern
part (northeast of Antifer harbour). Geomorphological analysis of the bathymetry thus confirms our hypothesis that, at the scale of recent geological times (e.g., the Quaternary times), the erosion rates increased southward. We thus assume that the change in coastline orientation at the Antifer harbour correlates with the gradual southward increase in the intensity of gravitational sliding and in the progressive exposure of weak sedimentary layers along the coastline (Fig. 18). According to this conceptual model, the average sea-level position is a key parameter because only high sea levels can favour erosion of the wedge’s toe, thereby maintaining gravitational sliding of the slope hence cliff retreat. This would imply that marine erosion by wave action and tidal effect on the wedge’s base was only effective during the last interglacial period (high-stand sea level of the Holocene).During glacial periods, the wedge and the cliff, were located too far from the sea to be eroded by marine erosion. Therefore the wedge remained stable. In the eastern English Channel, during periods of low sea level, a proto-Channel river must have existed during the early Middle Pleistocene, just before the formation of the Dover strait in the Middle Pleistocene (Gibbard, 1988, Lericolais, 1997, Gibbard and Lautridou, 2003). The Eastern English Channel was a complex system of anastomosing rivers, which were seaward extensions of present-day coastal rivers, such as the Seine, Somme, Béthune, Solent and Arun (Smith, 1985). During the last two glacial periods (MOIS2 and MOIS4), the Channel coastlands, including the Upper Normandy region, were affected by a discontinuous (in time and space) permafrost (Isarin, 1997; Murton and Lautridou, 2003). Ice segregation in the coastlands probably occurred either near the top of the permafrost, in clays, sands and chalk, with periglacial solifluction (Harris et al., 1997, 2000). Glacial periods may have favoured wedge spreading, mainly by solifluction of clays and sands and also chalk, and cliff alteration by ice-segregation, whereas interglacial periods with high-stand sea level may have favoured wedge sliding activated by marine erosion at the base of the wedge.
The particular process of gravitational cliff sliding applies only to the short segment of the coastline where a clay layer lies above or near the base of the cliff, which is the case between Le Havre and Antifer. The progressive change in orientation of this segment would, however, have continued through time, during the last high-stand sea level. The rest of the coastline, which is made of pure chalk cliffs, has no reason to be affected by this process.
7. Conclusion
We investigated gravitational deformation of coastal cliffs made of sedimentary layers using numerical and experimental models. The various numerical simulations of 2-D cliff cross sections indicate that the cliff is naturally unstable under the sole effect of gravity forces. The plastic strains are mainly localised along the two clay layers, and the predicted displacement fields show an overall seaward sliding of the cliff. The main plastic deformation is localised between the Albian Gault clay and the brittle Cenomanian chalk. The Gault Clay acts as a mechanical decoupling layer separating the cliff in two parts, strong upper chalk cliff overlying the Gault clay, and a weaker lower cliff made of Aptian sand and Kimmeridgian clay. The upper chalk cliff moves slowly seaward under, whereas the lower cliff is extruded seaward faster. The intensity of displacements in the lower cliff increases with increasing elevation of the Gault layer in the cliff, leading to a differential displacement 24 times greater in the lower part where the Gault clay is crops out at mid cliff (e;g., at the town of Octeville), than in the upper part of the cliff. We also investigated gravitational sliding of the cliff using experimental models subjected to high pore-fluid pressure. The region of the model located near the initial cliff spread seaward, generating a set of normal faults that propagated landward, forming a frontal toe. Layers analogous to clay strata clearly acted as décollement layers, onto which normal faults rooted. The configuration with one and two décollement layers indicates that brittle deformation is always rooted onto the lower décollement, which, in nature, is the Gault clays in the northern part of the study area (Antifer harbour) and the Kimmeridgian clays in the southern area (Sainte-Adresse). We modelled a more complex 3-D geometry that mimics that observed in the field by simulating the progressive northward deepening of one décollement layer (the Gault clay). In the segment of the model where the potential décollement layer was above or at the cliff’s base, the absence of frontal buttress allowed a large part of the cliff to slide seaward. The compressional toe of the wedge progressively thickened, eventually becoming a buttress strong enough to prevent further sliding. The removal of this toe by erosion lead to renewed sliding. Going northward, the potential décollement layer lay deeper, beneath the base of the cliff. The amount deformation and seaward translation progressively decreased northward until no sliding could occur. Results lead us to hypothesize that cliff retreat would be faster along the southern segment. There, the overall cliff trend would progressively rotate counter clockwise with ongoing deformation and marine erosion. Our modelling results illustrate why the coastline trend presents such a drastic change between the northern
segment (N60E) and the southern segment (N25E). This progressive coastline re-orientation is confirmed by the fan-shape morphology of the bathymetric contour lines offshore the southern segment whereas the northern one presents a smooth and regular slope parallel to the present-day coastline.
References:
Bromhead, E., Hopper, A., Ibsen, M.-L., 1998. Landslides in the Lower Greensand escarpment in south Kent. Bull Eng Geol Env, 57, 131-144.
Bromhead, E., Ibsen, M.-L., 2007. Folkestone Warren landslides and the impact of the past rainfall record. In: McInnes R., Jakeways J., Fairbank H. & Mathie E. (Eds.), Landslides and Climate Change, Taylor & Francis Group, London, 17-24.
Costa S., Delahaye D., Freiré-Diaz S., Di Nocera L., Davidson R. and Plessis E., 2004, Quantification of Normandy and Picardy chalk cliff retreat by photogrammetric analysis, in : Mortimore R.N. and Duperret A. (eds), Coastal chalk Cliff Instability. Geological Society, London, Engineering Geology Special Publications, 20, 139-148.
Cundall P.A., Board, M., 1988. A microcomputer program for modelling large-strain plasticity problems. In: Swoboda, G. & Balkema, A.A. (Eds), 6th International Conference in Numerical Methods in Geomechanics, Brookfield, Vt., 2101-2108.
Davy, Ph., Cobbold, P.R., 1991. Experiments on shortening of a 4-layer model of the continental lithosphere. Tectonophysics, 188, 1-25.
De Lange W.P. and Moon V.G., 2005, Estimating long-term cliff recession rates from shore platform widths, Engineering Geology, 80, 292-301.
Duperret, A., Genter, A. Martinez, A., Mortimore, R.N., 2004. Coastal chalk cliff instability in NW France: role of lithology, fracture pattern and rainfall. In: Mortimore R.N. & Duperret A. (Eds.), Coastal Chak Cliff Instability, Geological Society, London, Engineering Geology Special Publications, 20, 33-55.
Duperret, A., Genter, A., Mortimore, R. N., Delacourt, B., De Pomerai, M.R., 2002. Coastal rock cliff erosion by collapse at Puys, France: the role of impervious marl seams within chalk of NW Europe. Journal of Coastal Research, 18 (1), 52-61.
Eisenstadt, G., Vendeville, B. C., and Withjack, M. O., 1997. Experimental Modelling of Tectonic Processes. Course notes, AAPG Student Chapter course #19, unpaginated.
Evrard H., Sinelle, C, 1980, Stabilité des falaises du pays de Caux, CETE, LRPC, Le Grand Quevilly. Flageollet, J.-C., Helluin, E. 1987. Morphological investigations of the sliding areas along the coast of
Pays d'Auge, near Villerville, Normandy, France. International Geomorphology 1986. Proc. 1st Conference. Vol. 1, pp. 477-486
Fleureau, J.; Kheirbek-Saoud, S.; Soemitro, R. ; Taibi, S., 1993. Behaviour of clayey soils on drying-wetting paths. Canadian Geotechnical Journal, 30, 287-296 .q
Genter, A., Duperret, A., Martinez, A., Mortimore, R.N., Vila, J.-L., 2004. Multiscale fracture analysis along the French chalk coastline for investigating cliff collapse erosion. In: Mortimore R.N. & Duperret A. (Eds.), Coastal Chalk Cliff Instability, Geological Society, London, Engineering Geology Special Publications, 20, 55-74.
Gibbard P.L. and Lautridou J.P., 2003, The Quaternary history of the English Channel : an introduction, Journal of Quaternary Science, 18 (3-4), 195-199.
Gibbard P.L., 1988, The history of the great northwest European rivers during the last three million years. Philosophical Transactions of the Royal Society of London, B318, 559-602.
Guyader, J., 1968. Le jurassique supérieur de la baie de Seine. Etude stratigraphique et micropaléontologique. Thèse, Faculté des Sciences de Paris, 269 p.
Harris C., Davies M.C.R., Coutard J-P., 1997, Rates and processes of periglacial solifluction : an experimental approach. Earth Surface Processes and Landforms, 22, 849-868.
Harris C., Murton J.B., Davies M.C.R., 2000, Soft-sediment deformation during thawing of ice-rich frozen soils: results of scaled centrifuge modelling experiments, Sedimentology, 47, 687-700.
Hassani, R., 1994. Modélisation numérique de la déformation des systèmes géologiques. Thèse de Doctorat, Université de Montpellier II, 137 p.