Using diffusion MRI for classification and prediction
of Alzheimer’s Disease: a reproducible study
Junhao Wen1,2, Jorge Samper-González1,2, Simona Bottani 1,2, Alexandre Routier1,3, Ninon
Burgos1,2, Thomas Jacquemont1,2, Sabrina Fontanella 1,2, Stanley Durrleman1,2, Anne
Bertrand1,4,5, Olivier Colliot1,4,6 1Inria Paris, Aramis project-team, Paris, France
2Sorbonne Université, Inserm, CNRS, Institut du Cerveau et la Moëlle (ICM), Paris, France 3Sorbonne Université, Inserm, CNRS, Institut du Cerveau et la Moëlle (ICM), FrontLab,
Paris, France
4Sorbonne Université, Inserm, CNRS, Institut du Cerveau et la Moëlle (ICM), AP-HP, Paris,
France
5AP-HP, Saint-Antoine Hospital, Department of Radiology, Paris, France
6AP-HP, Departments of Neuroradiology and Neurology, Pitié-Salpêtrière Hospital, Paris,
Background
Several studies using machine learning have recently looked at the potential of diffusion tensor imaging (DTI) for Alzheimer’s disease (AD) classification (O'Dwyer et al., 2012; Dyrba et al., 2013; Maggipinto et al., 2017). However, classification accuracies are not directly comparable across studies because of differences in subject selection, image processing, feature extraction and selection, and classification algorithms. Samper-Gonzalez et al. (2017) proposed a reproducible framework for automatic classification of AD from T1 MRI and PET data. Here, we extend this framework for DTI-based classification using data from the Alzheimer’s Disease Neuroimaging Initiative (ADNI) study. This work aims to facilitate replication of classification experiments based on ADNI and also to compare the classification performances with different DTI-based features.
Methods
The framework is composed of the following components. Tools were implemented to automatically convert original ADNI diffusion MRI into the BIDS format. Standardized artifact correction procedures were designed. The DTI model was then fitted generating FA and MD maps. These maps were nonlinearly registered to MNI space and masked using the WM, GM or GM+WM binarized maps. Classification was performed using a linear support vector machine (SVM). A repeated holdout cross-validation (250 runs) with a 10-fold inner grid search for hyperparameter optimization was performed. Additionally, optimal margin hyperplane coefficient maps were reported to characterize potential anatomical patterns (Cuingnet et al, 2013). We demonstrate the use of the framework with 46 AD patients, 46 cognitively normal (CN) subjects, 97 mild cognitive impairment (MCI) subjects, including 54 stable MCI (sMCI) and 24 progressive MCI (pMCI) at 36 months. Additionally, a random undersampling technique with 10 repetitions was used to assess the impact of imbalanced data (e.g 54 sMCI vs 24 pMCI) on the classification performance.
Results
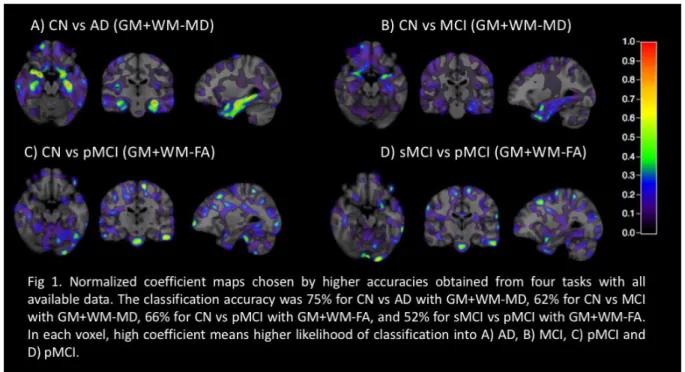
Classification results are shown in tables 1 to 4. We found high accuracies for AD vs CN classification but lower accuracies for classifications involving MCI. Balanced and imbalanced classifications gave comparable accuracies. The hippocampus and medial temporal cortex are the main discriminative regions using WM+GM-MD features (Fig 1).
Conclusions
We presented a framework that enables the comparability and reproducibility of DTI-based AD classification. Classification results are in line with the state of the art. The low accuracies obtained in discriminating pMCI from sMCI or CN are potentially caused by the small data samples, rather than by imbalanced data. The code will be made publicly available at https://github.com/aramis-lab/AD-ML.
References
Samper-Gonzalez, J., Burgos, N., Fontanella, S., Bertin, H., Habert, M.O., Durrleman, S., Evgeniou, T., Colliot, O. and Alzheimer’s Disease Neuroimaging Initiative, 2017, September. Yet Another ADNI Machine Learning Paper? Paving The Way Towards Fully-reproducible Research on Classification of Alzheimer’s Disease. In International Workshop on Machine Learning in Medical Imaging (pp. 53-60). Springer, Cham.
Cuingnet, R., Glaunès, J.A., Chupin, M., Benali, H. and Colliot, O., 2013. Spatial and anatomical regularization of SVM: a general framework for neuroimaging data. IEEE transactions on pattern analysis and machine intelligence, 35(3), pp.682-696.
Fig 1. Normalized coefficient maps chosen by higher accuracies obtained from four tasks with all available data. The classification accuracy was 75% for CN vs AD with GM+WM-MD, 62% for CN vs MCI with GM+WM-MD, 66% for CN vs pMCI with GM+WM-FA, and 52% for sMCI vs pMCI with GM+WM-FA. In each voxel, high coefficient means higher likelihood of classification into A) AD, B) MCI, C) pMCI and D) pMCI.