Publisher’s version / Version de l'éditeur:
New Journal of Physics, 15, 8, pp. 1-23, 2013-08-01
READ THESE TERMS AND CONDITIONS CAREFULLY BEFORE USING THIS WEBSITE. https://nrc-publications.canada.ca/eng/copyright
Vous avez des questions? Nous pouvons vous aider. Pour communiquer directement avec un auteur, consultez la
première page de la revue dans laquelle son article a été publié afin de trouver ses coordonnées. Si vous n’arrivez pas à les repérer, communiquez avec nous à PublicationsArchive-ArchivesPublications@nrc-cnrc.gc.ca.
Questions? Contact the NRC Publications Archive team at
PublicationsArchive-ArchivesPublications@nrc-cnrc.gc.ca. If you wish to email the authors directly, please see the first page of the publication for their contact information.
Archives des publications du CNRC
This publication could be one of several versions: author’s original, accepted manuscript or the publisher’s version. / La version de cette publication peut être l’une des suivantes : la version prépublication de l’auteur, la version acceptée du manuscrit ou la version de l’éditeur.
For the publisher’s version, please access the DOI link below./ Pour consulter la version de l’éditeur, utilisez le lien DOI ci-dessous.
https://doi.org/10.1088/1367-2630/15/8/083003
Access and use of this website and the material on it are subject to the Terms and Conditions set forth at
Not so loosely bound rare gas atoms : finite-temperature vibrational
fingerprints of neutral gold-cluster complexes
Ghiringhelli, Luca M.; Gruene, Philipp; Lyon, Jonathan T.; Rayner, David M.;
Meijer, Gerard; Fielicke, André; Scheffler, Matthias
https://publications-cnrc.canada.ca/fra/droits
L’accès à ce site Web et l’utilisation de son contenu sont assujettis aux conditions présentées dans le site LISEZ CES CONDITIONS ATTENTIVEMENT AVANT D’UTILISER CE SITE WEB.
NRC Publications Record / Notice d'Archives des publications de CNRC:
https://nrc-publications.canada.ca/eng/view/object/?id=6af4f89c-71d2-4f85-8161-d1384b4d1dca https://publications-cnrc.canada.ca/fra/voir/objet/?id=6af4f89c-71d2-4f85-8161-d1384b4d1dca
This content has been downloaded from IOPscience. Please scroll down to see the full text.
Download details:
IP Address: 132.246.86.134
This content was downloaded on 06/10/2015 at 19:27
Please note that terms and conditions apply.
gold-cluster complexes
finite-temperature vibrational fingerprints of neutral
gold-cluster complexes
Luca M Ghiringhelli1,5, Philipp Gruene1, Jonathan T Lyon1,2, David M Rayner3, Gerard Meijer1, Andr ´e Fielicke1,4,5 and Matthias Scheffler1
1Fritz-Haber-Institut der Max-Planck-Gesellschaft, Faradayweg 4-6, D-14195 Berlin, Germany
2Department of Natural Sciences, Clayton State University, 2000 Clayton State Boulevard, Morrow, GA 30260, USA
3National Research Council of Canada, 100 Sussex Drive, Ottawa, Ontario K1A-0R6, Canada
4Institut f¨ur Optik und Atomare Physik, Technische Universit¨at Berlin, Hardenbergstrasse 36, D-10623 Berlin, Germany
E-mail:ghiringhelli@fhi-berlin.mpgandfielicke@physik.tu-berlin.de
New Journal of Physics 15 (2013) 083003 (22pp)
Received 30 April 2013 Published 1 August 2013 Online athttp://www.njp.org/ doi:10.1088/1367-2630/15/8/083003
Abstract. We present an experimental and theoretical study of the structure of small, neutral gold clusters—Au3, Au4and Au7—‘tagged’ by krypton atoms. Infrared (IR) spectra of AuN· KrM complexes formed at 100 K are obtained via far-IR multiple photon dissociation in a molecular beam. The theoretical study is based on a statistical (canonical) sampling of the AuN· KrM complexes through
ab initiomolecular dynamics using density-functional theory in the generalized gradient approximation, explicitly corrected for long-range van-der-Waals (vdW) interactions. The choice of the functional is validated against higher-level first-principle methods. Thereby finite-temperature theoretical vibrational spectra are obtained that are compared with the experimental spectra. This enables us to identify which structures are present in the experimental molecular 5Authors to whom any correspondence should be addressed.
Content from this work may be used under the terms of theCreative Commons Attribution 3.0 licence. Any further distribution of this work must maintain attribution to the author(s) and the title of the work, journal citation and DOI.
beam for a given cluster size. For Au2, Au3 and Au4, the predicted vibrational spectra of the Kr-complexed and pristine species differ. For Au7, the presence of Kr influences the vibrational spectra only marginally. This behavior is explained in terms of the formation of a weak chemical bond between Kr and small gold clusters that localizes the Kr atom at a defined adsorption site, whereas for bigger clusters the vdW interactions prevail and the Kr adatom is delocalized and orbits the gold cluster. In all cases, at temperatures as low as T = 100 K, vibrational spectra already display a notable anharmonicity and show, in comparison with harmonic spectra, different position of the peaks, different intensities and broadenings, and even the appearance of new peaks.
Contents
1. Introduction 2
2. Methods 4
2.1. Experimental approach . . . 4 2.2. Theoretical methods. . . 4 2.3. Definition of temperature: classical versus quantum statistics for nuclei. . . 7
3. Localized bonding of Kr: Au2· Kr and Au2· Kr2 7
4. Au3· Kr and Au3· Kr2 12
5. Au4· Kr2 14
6. Orbiting Kr: the case of Au7· Kr 15
7. Conclusions 18
Acknowledgments 19
Appendix. Spectra as a function of grid, basis set, timestep, temperature 19
References 21
1. Introduction
As a bulk elemental metal, gold is a classic example of inertness [1]. However, at the nanoscale gold exhibits surprising chemical activity [2,3]. In fact, this property of nano-gold has already been used for commercial applications in offensive odor removal and gas sensors [4]. While most of the previous research efforts have been spent on deposited clusters, the experimental study of gas-phase clusters has the advantage of the reliable knowledge of the clusters’ size (number of atoms) and charge. Such well-defined species represent an ideal situation for modeling and analyzing their properties by means of experiments and ab initio calculations. In the past years, the structure of small gold clusters has been studied in a series of works at various levels of theory [5–10]. Combined theoretical and experimental works on anions [11–15] and cations [14, 16] yielded a consistent picture of the charged-cluster structures at all small sizes and, in particular, were able to identify the size at which three-dimensional (3D) structures become more stable than two-dimensional (2D) isomers. While theory has been equally applied to neutral gold clusters, their experimental characterization is more scarce and limited to the determination of ionization potentials (IPs) via electron impact (N = 1–22) [17] and optical absorption spectra [18].
Only the structures of neutral Au7, Au19 and Au20 have been recently derived from far-infrared (IR) multiple photon dissociation (FIR-MPD) spectra of their complexes with krypton atoms and comparison to theoretical predictions [19]. However, this study posed the question of the influence of the Kr messenger on the spectra and the type of the interaction between Kr and the neutral Au clusters. It has been recognized before that even ‘inert’ rare gas (RG) atoms may influence the IR spectra of metal clusters and their explicit consideration can improve the agreement between experimental and predicted spectra [20, 21]. Whereas this was somehow unexpected for neutral clusters, where RG atoms are considered to only physisorb, binding of RG atoms to cationic clusters, especially of late transition metals, is considerably stronger. For instance, it has been previously shown for cationic cobalt clusters [22] how the presence of Ar ligands significantly modifies the vibrational spectrum of the cluster. Similar effects of RG binding, leading even to changes in the energetic ordering of isomers, have been seen, e.g. for cationic vanadium or cerium oxide clusters [23,24].
So far, in most cases the experimental FIR spectra of metal clusters are interpreted only by comparison to calculated harmonic spectra (at T = 0 K). However, experiments are performed at finite temperature and even at lowest temperatures anharmonic effects can have a noticeable influence on the vibrational spectra. Nevertheless, a theoretical investigation of Au7 and Au7· Kr motivated by our previous study [19] applying a vibrational configuration-interaction approach did not identify significant anharmonicities for this particular cluster [25] and instead supported the initial conclusion that the Kr binding does not significantly change the vibrational frequencies, ‘but has an effect on the IR intensities, which become very similar to those in the experimental spectrum’ [19].
In this paper, we thoroughly investigate if this indeed holds, by studying how RG atoms bind to small, neutral gold clusters, and how this binding influences the vibrational spectra at
T =0 K as well as at finite temperatures. We report FIR-MPD spectra of very small neutral gold clusters (Au3, Au4, Au7) complexed with Kr atoms and we analyze the data by density-functional theory (DFT) calculations of structures, dynamics and finite-temperature vibrational spectra. The comparison between experimental FIR spectra and theoretical spectra calculated at ‘realistic conditions’ (i.e. accurate and validated level of our ab initio electronic structure theory, including van-der-Waals (vdW) interactions, and finite-temperature statistical sampling in the canonical ensemble), let us not only identify the (meta)stable structures at all considered sizes, but also reveal details on the dynamics of the gold clusters and the cluster-plus-RG complexes. These finite-temperature ab initio molecular dynamics (MD) studies also provide vibrational spectra that fully include anharmonic effects related to the canonical sampling of the potential energy surface6.
This paper is organized as follows. After an outline of the experimental approach, we describe the theoretical methods. In the theoretical method session, we stress the need for a canonical (rather than microcanonical) sampling for systems with few degrees of freedom (DoF). Furthermore, we validate the adopted level of theory for the description of the interactions, by comparison with higher level methods such as the recently introduced MP27+1vdW scheme [26], which has been shown to reach a CCSD(T)8-like level of accuracy.
In section 3, we describe Au2· Kr, as the simplest example for the unexpected reactivity of 6 Anharmonic effects due to the coupling of nuclear and electronic DoF are not included in our Born–Oppenheimer molecular dynamics with classical nuclei.
7 Second-order Møller–Plesset perturbation theory.
Au clusters toward Kr. In section 4, we analyze Au3· Kr, Au3· Kr2 and Au4· Kr2, where the unusually strong interaction between the clusters and Kr atom(s) is further detailed. In section5, we finally re-examine the spectrum of Au7· Kr and show how the theoretical finite-temperature vibrational spectrum can explain finer details than the harmonic analysis previously performed in [19].
2. Methods
2.1. Experimental approach
The FIR-MPD experimental setup has been described elsewhere [19,27]; here we summarize the key aspects. Gold clusters are obtained by laser vaporization from a gold rod and then thermalized in a flow of He and Kr kept at T = 100 K. Thereby Kr atoms (one or two, rarely more) may adsorb on the pristine gold clusters. These AuN· KrM complexes are subsequently investigated in a molecular beam, that is irradiated by a pulsed FIR beam from the Free Electron Laser for IR eXperiments (FELIX) [28]. The laser is tunable throughout the mid and far-IR (40–2300 cm−1). Subsequently, the neutral complexes are ionized by means of an F2-laser with an energy of 7.9 eV per photon and the ionized species are mass-analyzed in a time-of-flight mass spectrometer. When the FIR radiation is in resonance with an IR-active mode of a neutral complex, photons can be absorbed, the complex is heated and evaporation of the Kr ligand may follow. In this way, a depletion of the mass spectrometric signal of the gold–krypton complex results. Analyzing the frequency dependence of the depletion signal leads to the cluster-size specific IR spectra. Experimental IR intensities reported here are normalized for photon fluence rather than the laser intensity used in our previous studies. We have recently found that this gives better agreement with theoretical IR intensities if a wide spectral range is covered [29]. The observed vibrational bands of gold clusters are entirely in the FIR, namely at frequencies below 200 cm−1. This is due to the large mass of the nuclei as well as the softness of the bonds.
2.2. Theoretical methods
2.2.1. Ab initio potential energies and forces, and their validation. The theoretical results presented in this work were obtained using the FHI-aims [30] program package for an accurate all-electron description based on numeric atom-centered basis functions. Where not differently specified, for our analysis we employed (collinear) spin polarized DFT at the PBE [31] generalized gradient approximation (GGA) level, corrected for long range vdW interactions via the Tkatchenko–Scheffler (TS) scheme, i.e. a sum over C6[n]/R6 tails, and
C6 coefficients derived from the self-consistent electron density n and reference values for the free atoms [32]. This functional will be referred throughout the paper as PBE + vdW. We used ‘tight’ integration grid settings and accurate ‘tier 2’ basis sets [30]. The scaled zeroth-order regular approximation to the Dirac equation (ZORA) (scalar) relativistic correction [33] was employed for the static calculations. However, the computational cost of evaluating forces with the latter method is prohibitive; for the MD runs, where forces need to be evaluate at each timestep, the ‘atomic ZORA’ scalar relativistic correction [30] was used. This scheme has been shown to provide remarkably good binding energy and bond distance for Au2 in comparison to benchmarks methods [30]. We performed a test on the larger clusters analyzed here and we find that the ‘atomic ZORA’ and scaled ZORA yield binding energies that differ less than 0.02 eV atom−1for all functionals. When the difference in binding energies between isomers, of the same size N of AuN, is examined, the two methods agree within 0.01 eV atom−1. Harmonic
vibrational frequencies and intensities were computed from finite differences of the analytic forces. The binding energy of Kr to the gold dimer, equilibrium geometry, static electric dipole moment, and harmonic spectrum of Au2· Kr, as calculated with PBE + vdW, were compared to a hierarchy of electronic structure methods, from the local-density approximation (LDA) functional, through the hybrid functional PBE0 and the double-hybrid XYG3 [34], to RPA + rSE and rPT2 applied on both PBE and PBE0 orbitals [35]; furthermore, also MP2 and CCSD(T) values were calculated. All methods beyond GGA, except CCSD(T), were calculated with FHI-aims and we used really tight settings and tier 4 basis set. CCSD(T) values are calculated with Gaussian03 (revision D.01) [36] and aug-cc-pVTZ-PP basis set of Figgen et al [37] and Peterson and co-workers [38,39]. For some of the vdW complexes (see below), the interactions between the cluster and the RG atom were calculated at the MP2 level including the recently introduced correction to the dispersion interactions, MP2+1vdW [26]; MP2+1vdW energies have been shown to be in excellent agreement with CCSD(T) calculations for systems bonded by dispersion forces. A very good agreement between PBE + vdW and MP2 + 1vdW is found, which confirms the reliability of our calculated results reported and discussed below.
As explained in section ‘Experimental approach’, we can only detect a particular species and record its IR spectrum if its IP is lower than the energy of the F2-laser used to ionize the species in the molecular beam. For this reason, we have evaluated the vertical IP (vIP) of the species here analyzed, in two different ways (vide infra in table2). (i) Energy difference between the (relaxed) neutral cluster and the cationic cluster (in the neutral cluster geometry), both evaluated at the PBE + vdW level. (ii) By evaluating the one-shot perturbative single-particle excitation (G0W0 [40]), starting from PBE orbitals of the neutral cluster. The latter evaluation was performed with FHI-aims, with ‘really-tight’ settings and ‘tier 4’ basis set. For our systems, the difference of predicted vIPs between the two methods is within 0.3 eV (vide infra in table2).
2.2.2. Statistical mechanics. The IR spectra beyond the harmonic approximation of the clusters were calculated by performing Born–Oppenheimer MD simulations in the canonical ensemble at the experimental temperature (see next session for the definition of temperature) and extracting the Fourier transform of the dipole–dipole autocorrelation function from the trajectories. Thus, the IR intensities are computed via
I (ω) ∝ βω2
Z ∞
0
dtD EM(t ) · EM(0)E
N V T exp(iωt), (1)
where EM(t ) is the total electric dipole of the cluster at time t, β = 1/kBT and the angular brackets indicate an ensemble average in the canonical thermodynamical ensemble. We assume the system as ergodic: this means that a time average performed on a long thermostatted trajectory is equivalent to an ensemble average in the N V T ensemble. A trajectory is judged ‘long enough’ when the vibrational spectrum calculated for the whole trajectory does not change any more. The scalar product in the integral is averaged by selecting several times t = 0 along the same trajectory. The interval between two subsequent t = 0 is chosen to be longer than the time for the decay of the dipole–dipole autocorrelation function from one to the long-time average. This is because at short times the correlation between dipole moments (as for any other property of the system) is nearly 1 (the vector has still a similar modulus and direction). At the time at which the scalar product reaches the long-time average, the memory of the initial time is lost and thus a new dipole can be used as initial one for the statistical average. The factor βω2in front of the integral is the result of the product of the classical pre-factor βω(1 − exp(−β ¯hω))
and the quantum correction factor ω/(1 − exp(−β ¯hω)) [41, 42]. The classical factor results from the assumption of Boltzmann statistics for the ensemble of oscillators, while the quantum factor corrects for the so-called detailed balance, which reflects in an asymmetry of the peaks in the spectrum. The quantum correction is not uniquely defined, but the one we applied was shown to be the most accurate [43,44] when comparing theoretical and experimental spectra.
In the literature, autocorrelation functions are normally calculated from simulations in the microcanonical ensemble (N V E, i.e. constant number of particles N , constant volume V , constant energy E) and then referred to the average temperature of the run (such simulations are typically pre-equilibrated with a thermostat in order to impose the target temperature). In our case, though, the small number of DoF required a thermostat during the sampling of the correlation function. The reason for this is that, when the DoF are few, the distribution of the kinetic energy in a NVE ensemble departs from the distribution of the canonical ensemble (constant number of particles, constant volume, constant temperature, NVT) at the same average temperature (the latter distribution is nothing else than the Boltzmann distribution). The NVT distribution has a thick tail at large kinetic energies [45], while the NVE distribution is a Gaussian function around the average temperature (both distribution have 2/(3N ) relative variance). When the number of DoF is large (rigorously, at the thermodynamic limit), the two distributions converge to the same shape and a simpler NVE simulation, after thermalizing the system at the desired temperature, would be a good approximation of the rigorous NVT sampling.
There are two ways to overcome this problem, either averaging the correlation function over an ensemble of NVE trajectories, where the initial states (coordinates and velocities) are extracted from a canonically distributed set at the target temperature, or using a thermostat that does not perturb the dynamics. The first solution is computationally very demanding and the second requires a not trivial implementation. Since a thermostat always acts on the velocities, it is difficult to design one that does not destroy the dynamical correlations. Recently, Bussi et al introduced a stochastic thermostat that fulfills this requirement [45]. We tested the thermostat by calculating spectra via equation (1) at very low temperatures. The results reproduced the harmonic spectra impressively well. Furthermore, we observe that the finite-temperature spectrum is practically independent of the only tuning parameter that the thermostat has, which can be interpreted as a relaxation time, over a wide range of its values.
In the figures where we compare theoretical and experimental spectra (figures3–6) we have shifted the theoretical spectra in order to align the frequencies of the peaks to the frequencies at which the experimental peaks occur (note that a rigid shift is sufficient to align all the peaks). The necessity of such a shift is due to force inaccuracies caused by the approximate exchange-correlation functional and the finiteness of the basis set, but also they are caused by the finiteness of the MD timestep and the granularity of the mesh onto which the basis functions are projected. The sensitivity of the theoretical spectra toward the above mentioned settings is debated in the appendix. All the theoretical spectra shown in this paper are obtained with the same setting and we found that a rigid frequency (blue-)shift of 8 cm−1 optimized the matching for all cases. In figures3–6, we also report the harmonic spectra, where the frequencies of the peaks (bars) were scaled by a factor 1.05. In this way the peaks are approximately aligned to the experimental and finite-T theoretical spectra, in order to help the visual comparison. For converged vibrational spectra, MD runs of at least 100 ps were needed, and we used a timestep of 10 fs. A stable integration of the equations of motion with such an unusually large timestep is allowed by the low value of the highest frequency phonon (∼200 cm−1) in our systems.
2.3. Definition of temperature: classical versus quantum statistics for nuclei
In Born–Oppenheimer MD the nuclei are propagated as classical (point) particles. As a consequence, the population of their vibrational modes in the canonical ensemble obeys classical (Boltzmann) statistics. However, nuclei are quantum particles and also the population of the vibrational modes is quantized. Strictly speaking, one cannot define a joint {positions, momenta} phase-space probability distribution for a quantum system. For the simple case of a harmonic oscillator, however, the semiclassical Wigner distribution associated with thermal populations of the vibrational states is a Gaussian distribution of position and momentum, with fluctuations that depend parametrically on frequency and temperature [46]. For each normal mode and for a given ‘classical temperature’ T , one could then define an effective ‘quantum temperature’ as the temperature ¯T at which the quantum oscillator would exhibit the same fluctuations as a classical oscillator of the same frequency and at temperature T . For a set of non-interacting harmonic oscillators, by equating the widths of the classical and quantum harmonic oscillators momenta distributions, one obtains [47]
N kBT = X i hνi 2 coth hνi 2kBT¯, (2)
where νi are the (harmonic) vibrational frequencies of the cluster under consideration, T is the classical temperature (the one by the thermostat adopted for our simulations), N is the number of DoF and ¯T is the quantum temperature, which we adopt as an estimate of the ‘real’ temperature for the equilibrated system. We note that the two temperatures converge for large
T. The discrepancy between the two temperatures can be intuitively understood in terms of zero point energy: a classical system has to use some temperature in order to give kinetic energy to vibrational modes, while for a quantum system these modes are already active at T = 0 K. Thus the classical temperature has to be higher in order to give the same kinetic energy to the vibrational modes. Interestingly, this mapping also defines a lowest classical temperature, which is, by taking the limit ¯T →0: N kBT =P
i hνi
2 . This is the (classical) temperature needed to activate all the zero point vibrations. In the rest of the paper, for each cluster we will give both the classical temperature T at which the thermostat was set and the estimated quantum temperature ¯T.
The thermalization of clusters in sources similar as used here to prepare the AuN· KrM complexes has been characterized before and allows the conclusion that under our conditions equilibration to the source temperature is achieved [48, 49]. Nevertheless, it has to be noted that the experimental FIR-MPD spectra may not come from an exactly canonically distributed population. This is due to the fact that in the molecular beam cluster complexes belonging to the hotter tail of the canonical distribution may spontaneously dissociate and thus not contribute to the depletion spectrum. The experiment would then be sampling only the colder part of the full distribution.
3. Localized bonding of Kr: Au2·Kr and Au2·Kr2
In [50, 51], the cationic gold atom is found to form a strong bond, suggested to be covalent on the basis of orbitals-population analysis, with the heavier rare gases. The CCSD(T) binding energies between Au+ and Ar, Kr and Xe are 0.29, 0.51 and 0.91 eV, respectively [50]. While the neutral gold atom only forms a weakly bonded vdW dimer with Kr (as well as Ar and Xe) [52],
Figure 1. Equilibrium geometries (at T = 0 K) for Au2, Au3 and Au4 and their complexes with one or two Kr atoms. Distances (in Å) and angles (in degrees) for the determination of the structure are noted.
we find that Au2· Ar, Au2· Kr, and Au2· Xe are linear molecules where the RG–Au2interaction at equilibrium is unexpectedly strong. The PBE + vdW bonding energies of the RG with the gold dimer are 0.11, 0.22 and 0.43 eV for Ar, Kr and Xe, respectively. The values for Ne and He are 0.02 and 0.01 eV, i.e. there is practically only a vdW interaction between the two lighter RGs and the gold dimer (the equilibrium geometry is in these cases an isosceles triangle with Au2as the short basis). We find a similar trend for the other coinage metals, Cu and Ag. Consistently with the behavior of the surfaces of these coinage metals, Ag proves to be overall less binding, with a maximum of 0.13 eV for Ag2Xe, while Cu2has the interaction energies roughly halved when compared to the corresponding Au2· RG molecule. The detailed analysis of this unusual bond-ing between the dimer and rare gases will be presented elsewhere [53]. We note in passing that when Au is treated non-relativistically9, Kr would exhibit a negligible bonding, namely purely
vdW. Here we focus on the vibrational properties of the AuN· Kr and AuN· Kr2 complexes. Recently, in [54] a study was presented of the equilibrium distance and binding energy of Xe, Kr and Rn to Au, Ag and Cu small clusters, calculated at the CAM-B3LYP level10. Our equilibrium geometries and energies for Kr adsorbed on Au2, Au3 and Au4 qualitatively agree with the results there presented (cf figure 1). In particular, Kr was found to adsorb at distances between 2.7 and 2.9 Å to one Au atom in Au2, Au3and Au4with binding energies of 0.1–0.2 eV and a Au–Kr stretching frequency around 70 cm−1. However, on one issue our results disagree: while in [54] a very small increase of the Au–Au distance upon adsorption of RG was found, we find a small decrease (see table1). This is of no relevance for this paper. However, we note in passing that we carefully tested our results and the physical mechanism of the decrease of the Au–Au distance is in fact interesting. It will be discussed in a separate paper [53].
9 Also Kr is consistently treated non-relativistically, but this is less crucial. When compared to relativistically corrected Au2, the PBE + vdW NR gold dimer has a bond distance significantly increased from 2.51 to 2.77 Å and a bonding energy changing from −2.38 to −1.57 eV.
10Validation at M06-2X, MP2 and CCSD(T) level was performed only for dimers bound to Xe; MP2 binding energies were calculated for all studied system, but on CAM-B3LYP geometries.
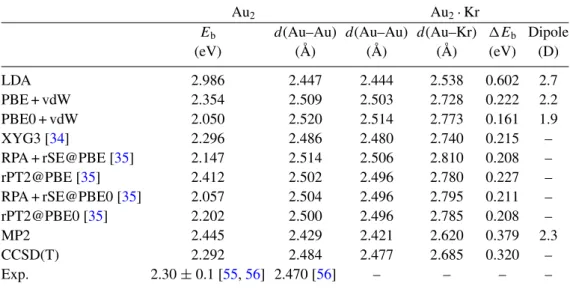
Table 1. Calculated properties of Au2 and Au2· Kr at various level of theory. All values except for CCSD(T) are calculated with FHI-aims, really tight grid, tier 4 basis set. CCSD(T) values are calculated with Gaussian03 (revision D.01) [36] and aug-cc-pVTZ-PP basis set of Figgen et al [37] and Peterson and co-workers [38, 39]. The binding energy of the gold dimer is Eb(Au2) =
E (Au2) −2E(Au). The adsorption energy of the Kr atom(s) onto the Au2 is
1Eb(Au2· Kr) = E(Au2) −E (Au2· Kr) − E(Kr), E(. . .) is the total energy of
the relaxed system.
Au2 Au2· Kr
Eb d(Au–Au) d(Au–Au) d(Au–Kr) 1Eb Dipole
(eV) (Å) (Å) (Å) (eV) (D) LDA 2.986 2.447 2.444 2.538 0.602 2.7 PBE + vdW 2.354 2.509 2.503 2.728 0.222 2.2 PBE0 + vdW 2.050 2.520 2.514 2.773 0.161 1.9 XYG3 [34] 2.296 2.486 2.480 2.740 0.215 – RPA + rSE@PBE [35] 2.147 2.514 2.506 2.810 0.208 – rPT2@PBE [35] 2.412 2.502 2.496 2.780 0.227 – RPA + rSE@PBE0 [35] 2.057 2.504 2.496 2.795 0.211 – rPT2@PBE0 [35] 2.202 2.500 2.496 2.785 0.208 – MP2 2.445 2.429 2.421 2.620 0.379 2.3 CCSD(T) 2.292 2.484 2.477 2.685 0.320 – Exp. 2.30 ± 0.1 [55,56] 2.470 [56] – – – – Au2· Kr
ν1 IR int. ν2 IR int. ν3 IR int. (cm−1) (km mol−1) (cm−1) (km mol−1) (cm−1) (km mol−1)
PBE + vdW 35 0.3 82 3.3 185 2.4
CCSD(T) 39 – 90 – 200 –
The occurrence of an interaction between RG atoms and metal clusters, so strong that the vibrational spectrum of the pristine cluster is perturbed, was also observed by Gehrke et al [22] for charged Co clusters and Ar. In that case, the interaction was explained in terms of electrostatic interactions between the static charge at the metal cluster and the induced dipole at the RG. In our case, for neutral systems, this electrostatic explanation cannot be invoked.
The static dipole of the AuN· Kr molecule is non-zero (see table1) and vibrations become IR active, with two marked lines in the harmonic spectra: the Au–Au stretch at 185 cm−1and a Kr–Au2stretch at 82 cm−1. Note that, while the higher frequency eigenmode is still recognizable as an Au–Au stretch with just a small blue-shift (cf figure2), and Kr just makes it IR active by breaking the symmetry of the molecule, the lower frequency line is entirely due to the presence of Kr.
The bonding predicted at the PBE + vdW level is confirmed at higher level of calculation, as shown in table 1. As expected, LDA overestimates the bond strength while PBE + vdW underestimates it, when compared to MP2 and CCSD(T). The fact that PBE + vdW and higher
0 50 100 150 200 0 1 2 IR intensity / arb. u.
Au
2·Kr
2, 100 K
Frequencies / cm-1Au
2·Kr
2, 23 K
Au
2·Kr
2Au
2 IR intensity / km mol -1 ν 1 ν 2 ν 3 ν 4,5 ν 6,7 ν 1 ν 2 ν 3 ν 4,5 ν 6,7 0 10Figure 2. Theoretical harmonic (bars) versus theoretical finite-temperature IR spectra of Au2· Kr2. The circles on the top x-axis mark the position of the IR-inactive vibrational modes, hollow for bare Au2 and filled for Au2· Kr2. The harmonic frequencies are labeled corresponding to the eigenmodes of Au2· Kr2 as illustrated on the right. ν4,5 and ν6,7 are doubly degenerate modes, respectively. Thin lines show the main character of the bands observed in the finite-temperature spectra, for which the thermostat was set to T = 23 K ( ¯T =
0 K) and T = 103 K ( ¯T =100 K). These spectra were neither shifted nor scaled.
level calculations exhibit similar Au–Kr bond distances, static dipole moments, harmonic vibrational frequencies and harmonic IR intensities suggests that the nature of the bond is also the same in the different approaches.
In the case of Au2· Kr2, the vibrational properties of the dimer are also strongly modified by the adsorption of Kr. Like Au2, the Au2· Kr2 molecule is linear and inversion symmetric. Thus, fewer modes than for Au2· Kr are IR active. Au2· Kr2clearly shows anharmonic features already at relatively low temperature (see figure 2). At T = 23.5 K ( ¯T =0 K) the IR spectrum simulated by MD mimics closely the harmonic spectrum (this is an indication of the reliability of the MD settings, and in particular of the thermostat). At T = 103 K ( ¯T =100 K), however, clear differences become apparent: the band related to the antisymmetric Kr versus Au2 stretching is red-shifted to 57 cm−1 as compared to the harmonic frequency of 69 cm−1 and a new satellite peak appears at 48 cm−1. This is due to the interaction between the mentioned antisymmetric stretching mode with the symmetric one (harmonic frequency 62 cm−1), which is IR inactive in the harmonic approximation. During the MD simulation of both Au2· Kr and Au2· Kr2, the Kr atoms were found to stay localized at their bonding site. In the following, we will label this adsorption sites as ‘chemisorption sites’, in order to distinguish them from the pure vdW adsorption sites (vide infra). The actual nature of these adsorptions, which is largely covalent but also involves a complex charge polarization and redistribution, is discussed in [53].
Both Au2· Kr and Au2· Kr2, however, are not detected in the FIR-MPD experiment because their IPs are significantly higher than the energy of the ionizing UV laser. The theoretical values of their vIP are 9.0 eV for Au2· Kr and 8.7 eV for Au2· Kr2 (see table 2), i.e. well above the photon energy of the UV laser (7.9 eV) used in the experiment.
Table 2.Energy related quantities for all the clusters and complexes considered, calculated with the PBE + vdW functional. The structural for the same structures parameters are illustrated in figure1. Eb(equation (3)) is the total binding energy, 1Eb (equation (4)) is the interaction energy between the Kr atom(s) and the relaxed gold cluster, 1EvdW (equation (5)) is the vdW part of the interaction between the Kr atom(s) and the gold cluster. For bare clusters, this number (reported between brackets) is the total intra-cluster vdW interaction. For Au3, (a) labels the acute-angled and (o) the obtuse-angled isomer. For Au4, (rh) means rhombus and (Y) Y-shaped isomer. For Au7, (1) is the second isomer from the top in figure6 while (2) is the upper one in the same figure. vIPs are evaluated as energy difference of two single-point calculations with PBE + vdW for the neutral and cationic cluster (column marked with SCF) and via G0W0 [40], on PBE orbitals. Experimental values of the IPs for Au2, Au3, Au4and Au7 are 9.5, 7.5, 8.6 and 7.8 eV, respectively [17].
Molecule Eb(eV) 1Eb(eV) 1EvdW(eV) vIP (SCF) (eV) vIP (G0W0) (eV)
Au2 −2.35 – (0.00) 9.2 9.5 Au2· Kr −2.57 −0.22 −0.02 9.0 8.8 Au2· Kr2 −2.70 −0.35 −0.04 8.7 8.7 Au3(a) −3.53 – (0.00) 7.2 7.0 Au3(o) −3.65 – (−0.02) 8.4 8.1 Au3· Kr (a) −3.73 −0.20 −0.02 6.8 6.7 Au3· Kr (o) −3.75 −0.12 −0.01 7.9 7.7 Au3· Kr2(a) −3.84 −0.31 −0.04 6.6 6.4 Au3· Kr2(o) −3.86 −0.21 −0.02 7.5 7.3 Au4(rh) −6.14 – (−0.02) 7.9 7.8 Au4(Y) −6.12 – (−0.03) 8.2 8.0 Au4· Kr (rh) −6.31 −0.17 −0.03 7.7 7.5 Au4· Kr (Y) −6.31 −0.19 −0.01 7.9 7.8 Au4· Kr2(rh) −6.47 −0.33 −0.05 7.5 7.3 Au4· Kr2(Y) −6.46 −0.34 −0.02 7.7 7.5 Au7 −13.22 – (−0.13) 7.1 7.0 Au7· Kr ‘top’ (1) −13.32 −0.10 −0.03 7.0 6.9 Au7· Kr ‘top’ (2) −13.32 −0.10 −0.04 7.0 6.9 Au7· Kr ‘fcc’ −13.30 −0.09 −0.09 7.1 7.0
A detailed listing of energy related quantities is given in table 2. The total binding energy of the AuN· KrM cluster (M = 1, 2) is
Eb(AuN· KrM) =E (AuN · KrM) −N E (Au) − M E(Kr). (3) The ‘adsorption’ energy of the Kr atom(s) onto the cluster is defined as
1Eb(AuN · KrM) =E (AuN· KrM) −E (AuN) −M E (Kr), (4)
where E(AuN)is the total energy of the relaxed AuN cluster, AuN· KrM is the relaxed adsorbate system and E(Kr) the total energy of a single Kr atom. Furthermore, we report the vdW
interaction energy between the Kr atom(s) and the gold clusters, calculated as the overall vdW correction minus the vdW correction within the bare cluster:
1EvdW(AuN· KrM) =EvdW(AuN· KrM) −EvdW(AuN). (5) Due to the fact that some vdW interaction is present among the atoms of the gold cluster (and the larger the cluster, the larger is the intra-cluster vdW interaction), with the latter definition we single out the part of vdW interaction between the gold cluster and the adsorbed Kr atom(s). When this value is small in comparison to 1Eb, the interaction between the Kr atom(s) and the gold cluster has some covalent character [53].
4. Au3·Kr and Au3·Kr2
Au3 has two (meta)stable isomers, (a) an obtuse-angled isosceles triangle11, with an obtuse
angle of about 140◦and (b) an almost equilateral triangle12. According to PBE + vdW, the latter
is 0.12 eV less stable than the former. The linear isomer is only a saddle point for the neutral Au3. PBE0 + vdW also finds the obtuse-angled isomer more stable, but only by 0.04 eV (after relaxing both structures with PBE0 + vdW). For higher level methods, however, the most stable isomer is the acute-angled. Namely, for XYG3 by 0.11 eV and for RPA + rSE@PBE by 0.05 eV. Also in [10], GGA functionals predict the obtuse-angled isomer to be more stable and higher level functionals the acute-angled. However, all functionals underestimate the formation energy of the gold trimer when compared to the experimental value (3.80 ± 0.13 eV) [57] and the best agreements comes from GGA functionals. Thus, the accurate relative energetics between pristine isomers has to be regarded as still an open issue.
According to PBE + vdW, the binding of one or two Kr atoms to these two isomers of Au3 brings the two Au3· Kr structures to approximately the same energy (see table 2). For PBE0 + vdW, the Au3· Kr structure with acute-angled Au3is 0.06 eV more stable than the other and the Au3· Kr2structure with acute-angled Au30.10 eV more stable. With XYG3, these values become 0.20 and 0.24 eV, while for RPA + rSE@PBE 0.13 and 0.23 eV. For heavier RG atoms, in particular for Xe, we find that the acute-angled isomer becomes even (slightly) more stable than the obtuse-angled one. The final structure of Au3· Kr is an isosceles Au3 triangle with the two equal-length bonds of 2.6 Å (i.e. 0.02 Å contracted with respect to the bare isomer) and 11There has been some confusion in literature, when referring to this ‘obtuse-angled’ triangle. In [6,7] an ‘obtuse-angled’ triangle is mentioned, but it turns out that its internal angle is not bigger than 90◦, it is just bigger than 60◦. It looks like the terms ‘obtuse’ and ‘acute’ have been referred to the equilateral reference, rather than the usual right angle. The first clear reference to the ‘obtuse’ triangle as the one with internal angle about 140◦wide we find in [8].
12Actually, when spin–orbit coupling is not considered, as in this paper, two nearly equilateral isosceles triangles are identified as local minima, with the internal angle between the two equal length bonds of 66◦ and 56◦, respectively. These are determined by a Jahn–Teller distortion of the perfectly equilateral triangle. By considering spin–orbit coupling [10], the degeneracy that causes the Jahn–Teller distortion is removed and only the perfectly equilateral triangle is found. In this paper we consider only one obtuse-angled triangular isomer. This is justified by the fact that, when one Kr is chemisorbed to the acute-angled triangle, only a 64◦triangle is found; when two Kr are chemisorbed, only a 56◦triangle is stable. What the FIR-MPD experiment sees is thus only one acute-angled isosceles triangular species at a given number of adsorbed Kr, while the isolated perfect equilateral Au3 is not observable in a FIR-MPD experiment. Furthermore, when Kr is adsorbed to the acute-angled isomer, by binding to one of the Au atoms, the final structure is the same, whether the bonding Au atom is initially at the 66◦corner or one of the two 57◦.
the angle between them 64◦ wide (i.e. 2◦ smaller than in the bare cluster); Kr is bonded to the gold atom at the 64◦ vertex, with a Au–Kr distance of 2.74 Å. When Kr is adsorbed to the obtuse-angled isomer, it is chemisorbed to one of the two one-fold coordinated Au atoms. The Kr–Au bond length, 2.94 Å, is much longer than in the acute-angled case; it follows that the Au3–Kr interaction energy is about half than for the acute-angled isomer. As a consequence, by adding one Kr atom, e.g. by letting Kr approach toward the central (two-fold coordinated) Au atom, the obtuse-angled Au3 isomerizes into the acute-angled isomer. This would be an unusual example of a RG-induced isomerization of a metal cluster, but similar to the observations for Cu3RG [58].
Both Au3 isomers can also bind two Kr atoms, with binding energy slightly smaller than double the binding energy of one Kr (see table 2). A third Kr atom on the acute-angled isomer of Au3is only vdW bound. This Au3· Kr3has the geometry of the acute-angled Au3· Kr2, with the third Kr in plane, but only vdW-bonded at 4.0 Å from the third Au atom.
For both Au3 isomers, there are also other equilibrium positions for Kr. For the lowest energy structure besides the chemisorbed sites, i.e. the complex with the acute-angled triangle, Kr is out-of-plane and its trace is on the center of mass of the gold cluster, the interaction energy is −0.05 eV, which is about 25% of the bonding energy upon chemisorption. As it is easy to predict, finite-temperature MD simulations find Kr localized at the bonding site(s).
While the IR spectrum of bare Au3is dominated by one intense mode at 95 cm−1, related to the antisymmetric stretching of the acute-angled triangle, many peaks appear in the IR spectrum when one or two Kr atoms are adsorbed. Some of these peaks are associated with eigenmodes that correspond to IR-inactive modes of the pristine cluster, whereas the change of symmetry provoked by Kr adsorption makes them visible; some are new modes involving Kr as well.
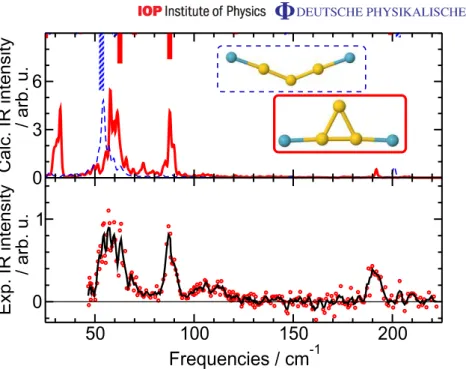
The finite-temperature theoretical spectrum of Au3· Kr (figure 3) agrees well with the experimental spectrum when only the acute-angled isomer is considered13. In fact, the obtuse-angled isomer would have a peak at ∼130 cm−1, which is not present in the experimental spectrum. It turns out that, even if the energetics of the obtuse-angled isomer is close to that of the acute-angled, the vIP of the obtuse-angled isomer is calculated to be close to the energy of the UV laser (7.9 eV), and thus it may not be (or not efficiently) ionized, while the vIP of the acute-angled isomer is far below the photon energy. At low wavenumbers (50–70 cm−1), though, the experimental spectrum does not show the band predicted by theory. The reason for this behavior is that also Au3· Kr2 absorbs at those frequencies (see below). However, at such low photon energies many Au3· Kr2 appear to loose only one Kr in the photodissociation and the formation of Au3· Kr compensates for the dissociated fraction.
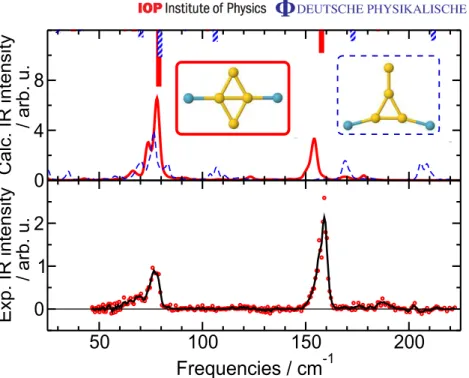
Provided that the relative energy of the obtuse-angled di-krypton complex is close to the energy of the acute-angled, the calculated vIPs suggest that the di-krypton complexes of both isomers can be ionized at 7.9 eV and could contribute to the experimental spectrum of Au3· Kr2, although the obtuse-angled may be slightly less efficiently ionized as it has the higher vIP. Indeed, a superposition of the two theoretical spectra shows a remarkable agreement with the experimental one (figure4). For instance, the broad band around 50–60 cm−1is reproduced quite well and shows a similar substructure. The subpeaks are an anharmonic feature, since only one peak per isomer is found in the harmonic spectrum in that region. Inclusion of the obtuse-angled isomer can explain the extension of this band toward lower frequencies.
13Here, we could not quantify the comparison between experimental and theoretical curves, by means, e.g. of Pendry [59] reliability factor, because the yield of the ionization laser is unknown, thus the relative ratio between the two isomers would be a fitting parameter and the R-factor would loose its meaning.
0 2 4
Calc. IR intensity / arb. u.
50 100 150 200
Frequencies / cm-1 0
1
Exp. IR intensity / arb. u.
Figure 3.FIR-MPD spectrum (lower panel) of Au3· Kr at 100 K and theoretical IR spectra (upper panel) at T = 100 K ( ¯T =96 K) of the two isomers of Au3· Kr. The harmonic spectra are plotted as bars upside-down. The horizontal line in the bottom panel marks the zero cross section. The dashed lines and bars refer to the obtuse-angled isomer, while the solid lines and bars refer to the acute-angled one.
5. Au4·Kr2
Similarly to Au3, Au4 has two low energy isomers, a rhombus and a Y-shaped cluster, with a difference in energy of 0.02 eV, which is further reduced by the adsorption of one or two Kr atoms. Au4· Kr is not ionized in the experiment, and indeed the calculated vIPs (table 2) are consistent with this observation.
The calculated vIPs of the two Au4· Kr2isomers suggest that the rhombus isomer is more efficiently ionized (vIP = 7.5 eV), as the vIP of the Y-shaped isomer is with 7.7 eV already rather close to the photon energy. The FIR-MPD spectrum for Au4· Kr2 (figure 5) is well reproduced by the theoretical finite-temperature spectrum of the rhombic isomer. Inclusion of a fraction of the Y-shaped isomer could explain a further broadening of the low frequency peak, however, there are no signs of the other, though less intense, bands predicted for this isomer.
If the Kr atom is placed above the plane of the rhombic Au4, a vdW complex is formed with 1EvdW(Au4-Kr) = −0.08 eV, which is less than half the energy of the localized bonding. For comparison, we calculated the MP2 + 1vdW interaction energy for this complex14, which is
with −0.07 eV in very good agreement with the PBE + vdW value. The vdW complex Au4· Kr2 has the two Kr atoms symmetrically above and below the plane of Au4. The interaction energy is still −0.08 eV per Kr, again less than half than the bonding energy of the bonded Au4· Kr2. Even in this case at finite temperature the Kr atoms are practically always found at the bonding site(s). 14We used FHI-aims, tight grid settings, a ‘tier 3’ basis set and applied counterpoise correction for the basis set superposition error.
0 3 6
Calc. IR intensity / arb. u.
50 100 150 200
Frequencies / cm-1 0
1
Exp. IR intensity / arb. u.
Figure 4.FIR-MPD spectrum (lower panel) of Au3· Kr2at 100 K and theoretical IR spectra (upper panel) at T = 100 K ( ¯T =97 K) of the two isomers of Au3· Kr2. The horizontal line in the bottom panel marks the zero cross section. The dashed lines and bars refer to the obtuse-angled isomer, while the solid lines and bars refer to the acute-angled one.
In conclusion, theory predicts that Au4· Kr2 is present as a mixture of two low lying isomers, which are nearly equally present. The experiment clearly identifies the rhombic isomer, but there is no compelling verification of the Y-shaped structure, which may be explained by its low ionization probability.
6. Orbiting Kr: the case of Au7·Kr
For clusters bigger than Au4, the chemisorption sites for Kr are still present (always single coordinated adsorptions to perimetral two- or three-fold coordinated Au atoms), but, starting from Au5, the bonding energy is weakened to ∼ − 0.1 eV in the most favorable geometry. Since with increasing size the number of Au–Kr pairs that show a significant vdW attraction increases, the total vdW interaction between the gold cluster and the Kr atom(s) increases and grows comparable to the bonding energy to a specific site.
For planar clusters, this interaction is maximized when Kr is out of plane, and the trace of the Kr position onto the cluster plane lies near the center of mass of the cluster. We find that at size 5 the interaction of Kr sitting at the best bonding site starts to compete energetically with the (vdW) interaction energy of the purely vdW bound complex. In facts, for Au5 the purely vdW bound Kr yields a 1EvdWequal to −0.09 eV. Interestingly, a 1EvdWof about −0.1 eV is also the strongest interaction we found for a AuN· Kr complex. We tested up to Au20(which is a perfect tetrahedron, with four triangular{111} surfaces each made of ten atoms [19]) for which we find a 1EvdW(Kr above the center of one of the faces) of −0.11 eV. The fact that the vdW interaction between Kr and the cluster saturates with the cluster size is due to geometrical reasons, but also
0
4
8
Calc. IR intensity / arb. u.
50
100
150
200
Frequencies / cm
-10
1
2
Exp. IR intensity / arb. u.
Figure 5.FIR-MPD spectrum (lower panel) of Au4· Kr2at 100 K and theoretical IR spectra (upper panel) at T = 100 K ( ¯T =97 K) of the two isomers of Au4· Kr2. The horizontal line in the bottom panel marks the zero cross section. The dashed lines and bars refer to the Y-shaped isomer, while the solid lines and bars refer to the rhombic one.
to the polarizability of the Au atoms in the cluster, which, at least in the size interval that we have probed, decreases with the cluster size. The comparably strong vdW binding of Kr to the planar fcc sites is well in line with the experimental findings for anionic Au clusters, where Ar binding has been used to discriminate between 2D and 3D structural isomers [13].
Au7 is the first cluster size larger than Au4 for which we have a clearly structured experimental spectrum to compare to (Au5· Kr shows only relative week features in the spectrum, and no Au6· KrM is ionized in the experiment). The IR spectrum of Au7 had been the subject of analysis before and its structure has been identified as planar edge-capped triangle [19], which is here confirmed as the clear global minimum.
We find that Kr can bind, within the plane of the Au7 cluster, to single Au atoms, similarly to what was described before [19]. The strongest binding (1Eb= −0.10 eV) is in the two geometries shown in the top part of figure 6. However, the vdW complex, with Kr above the Au7 plane, depicted as third from the top in figure 6 has an interaction energy of −0.09 eV, i.e. comparable to the bound case. For this vdW complex, too, we have checked the accuracy of the PBE + vdW interaction energy with the MP2 + 1vdW approach. The latter predicts an interaction of −0.09 eV as well.
The experimental FIR-MPD spectrum of Au7· Kr is already well reproduced by the harmonic spectrum of the bare cluster and in particular the peak positions are in excellent agreement (see figure6). Nonetheless, the relative intensities of the peaks, in particular the more pronounced ones at 165, 186 and 201 cm−1, do not match. When the harmonic spectra of the complexes with chemisorbed Kr are considered, it is found that the peak positions do not shift significantly. But the relative intensities do change, in such a way that for one of the in-plane
0 1 2 1 2 0 1 2 0 1 2 IR intensiy / km mol -1 3.03 3.06 3.76 0 1 2 Calc. IR intensity / arb. u. 50 100 150 200 Frequencies / cm-1 0 1 2 Exp. IR intensity / arb. u.
Figure 6.Theoretical harmonic IR spectra of Au7, Au7· Kr and their calculated finite-temperature IR spectra at T = 100 K ( ¯T =96 K) compared to the experimental FIR spectrum of Au7· Kr (lower panel). The lower right structure depicts the isosurface enclosing the region where Kr is found 80% of the time during a 0.5 ns MD run at T = 100 K, when forming a vdW complex with Au7. Between the atoms surrounded by a square the weakest bond in Au7 is formed (inset lower panel, see text for details). The Au–Kr distances are in Å.
binding sites an optimal matching with the experiment is found (see figure6), as already noted in [19]. Due to the competing energetics between the bonded and the vdW complex, though, the picture suggested by MD is slightly different.
In a MD run at the experimental temperature of 100 K, the Kr atom, even when prepared in an initial position at one of the bonding sites, soon starts to orbit around the planar cluster, with a preference for the ‘polar’ regions (if the planar Au7 is regarded as the equatorial plane of the approximate sphere onto which Kr slides). The lower right structure in figure 6shows the isosurface that encloses the region in which Kr spends 80% of its time during a 0.5 ns long MD run. In practice, the simulation box is divided in small cubes and for each cube the average Kr-density is evaluated as the (normalized) number of times the Kr nucleus is found in the cube
during the MD sampling. The enhanced density at the polar regions can be interpreted as a clear preference for forming the vdW complex, despite its energetic quasi-degeneracy with the localized bonding situations. This is easily understood on entropic grounds. The vdW complex offers a large number of energetically degenerate levels, as shown by the extension of the isosurface shown in figure6. In contrast, when Kr is localized at an adsorption site, the system visits only a small number of configurational states, just because of the localization! Since entropy is a measure of the number of the states accessible to the system at a given temperature, the vdW complex has a larger (configurational) entropy and thus a lower free energy compared to the localized bonding case.
The finite-temperature spectrum obtained from a MD simulation of Au7· Kr is shown in figure6(second lowest panel, continuous trace). The relative peak heights are well reproduced. Furthermore, we find that the finite-temperature spectrum of the bare cluster (same panel, dashed line) is very similar to the spectrum of Au7· Kr. In particular the correct peak height ratio for the three peaks at higher frequency is found. This suggests that the Kr atom is not significantly affecting the spectrum, but that the differences to the harmonic spectrum of Au7 are related to an intrinsic behavior of Au7. The marked broadening of the highest frequency peak in the spectra of Au7 and Au7· Kr is indeed an anharmonic feature. Analysis of the MD trajectory reveals that the internal bond of the inner rhombus (i.e. the bond between the highlighted atoms in figure 6) is the weakest, in the sense that the variance of its length is about twice than the average variance of the other bond lengths. Elongation of this bond implies shortening of the distance between the other two atoms belonging to the inner rhombus of Au7. Furthermore, a trajectory at higher temperature reveals that this isomer undergoes a fluxional transformation by swapping the role of the atoms arranged in the inner rhombus, i.e. the long and short diagonal interchange and an isomer with identical topology, but with scrambled atoms is formed. This feature will be analyzed in detail in a subsequent publication, by comparing the fluxional behavior of this cluster with other similar behaviors of larger gold clusters. At this point, we just note that the anharmonic broadening of the highest frequency peak in Au7· Kr (as well as in pristine Au7) is related to this fluxional behavior. The theoretical understanding of Au7(·Kr) vibrational spectrum is not in contradiction with the analysis reported in [25]. In fact, in the work of Mancera and Benoit the analysis was carried out for small distortions of the global minimum structure (the same as ours) at T = 0 K. Only including larger distortion as sampled in a canonical MD trajectory, the anharmonic features of Au7become visible.
7. Conclusions
We report the FIR-MPD vibrational spectra of small AuN· KrM complexes and provide their assignment by simulating finite-temperature spectra via DFT (with vdW tail correction) molecular dynamics. This approach led us to the identification of the structural information of the considered species. For the MD simulations, we have used the PBE + vdW functional, but some static properties of the AuN· Kr were compared to higher level methods, for validation of our approach. In particular we have tested the validity of the TS scheme [32] for the vdW tail correction of the PBE functional for the system considered here against the MP2 + 1vdW [26] results. We always found a remarkably good agreement between the adopted method and the higher levels one.
Similarly to what was found for Ar adsorbed on cationic Co clusters [22] or Y doped gold clusters complexed with Xe [20,21], krypton is not a mere tag and does perturb the vibrational
spectra of small neutral gold clusters, sometimes even largely. While a somewhat strong electrostatic interaction between a charged cluster or molecule and a RG atom is predictable, an interaction between a RG and a neutral gold cluster, strong enough to visibly perturb the vibrational spectrum of the pristine cluster, may not be expected.
When Kr binds to Au2, Au3 and Au4, it is found localized at its binding sites also at the experimental temperature of 100 K and vibrational spectra are greatly affected by Kr adsorption, i.e. Kr does not act as a mere messenger for the detection. Therefore the interpretation of the vibrational spectra has to consider the whole AuN · KrM complex. Theory predicts that Au3· Kr, Au3· Kr2 and Au4· Kr2 appear in two different isomers each. However, in all these cases the experimental spectra can be explained also without assuming the presence of the higher energy isomer. The latter may be invisible due to low population or because of poor ionization yield.
In Au7· Kr, the Kr atom is not bound to a single site but delocalized with a clear preference for being above/below the Au7plane. We also find that anharmonic effects leading to unusual broadening of the peaks or new peaks due to mode interactions are present already at comparably low temperatures (T ∼100 K). In the case of Au7· Kr, the inclusion of anharmonicity results in the best agreement with the experimental spectrum. Nevertheless, the comparison with the harmonic spectra demonstrates that these can be sufficient to establish the metal cluster structure as long as one realizes intensities may be perturbed.
The role of the Kr atom(s), i.e. localized versus orbiting around the cluster, and its influence on the measured vibrational spectra, is fully revealed only by the statistical sampling of the canonical ensemble, due to the fact that the system is investigated at finite, albeit relatively low, temperatures.
We are currently extending the calculation of finite-temperature vibrational spectra via molecular dynamics to larger Au clusters, where at some sizes fluxional behaviors (i.e. relatively frequent structural interchanges between neighboring isomers) must be taken into account for a full understanding of the FIR-MPD spectra.
Acknowledgments
We thank Elizabeth Beret for the CCSD(T) calculations of Au2· Kr and for plotting the Kr density isosurface. Sergey Levchenko, Mariana Rossi, Michele Ceriotti, Alexandre Tkatchenko, Volker Blum and Elizabeth Beret are gratefully thanked for inspiring discussions. We acknowledge the support of the Stichting voor Fundamenteel Onderzoek der Materie (FOM) in providing beam time on FELIX. We thank the FELIX staff for their skillful assistance, in particular Dr A F G van der Meer and Dr B Redlich. This work was supported by the Deutsche Forschungsgemeinschaft through the Cluster of Excellence UNICAT hosted by the Technical University Berlin.
Appendix. Spectra as a function of grid, basis set, timestep, temperature
The sensitivity of the spectra toward the chosen computational settings and the MD temperature is exemplified in figureA.1for the case of Au3· Kr2(acute-angled isomer). The accuracy of the single point energy and force evaluation in FHI-aims is set by the size of the basis set and the density of the integration grid. The quality of the forces differences along the MD trajectory is also determined by the MD timestep.
We have chosen to record the frequency of the three IR active modes of Au3· Kr2 (acute-angled isomer) that fall into the experimentally accessible interval of frequencies. The peak
40 50 60 70 80 Frequencies / cm-1 exp. (100K) harm. vib. (0K) 10K 50K 75K 100K light tight tight 1202 really tight 974 Au:T1-gh, Kr:T1-f Au:T1-gh, Kr:T1 Au:T1-gh, Kr:T2 Au:T1, Au:T1 Au:T2, Au:T2 10fs 5fs 2fs 1fs 170 180 190 changing temperature tight, T2, 5fs changing grid 50K, T2, 5fs
changing basis set 50K, light, 5fs changing time step 50K, tight, T2
Figure A.1.Sensitivity of the vibrational spectrum of Au3· Kr2 toward changes in temperature, grid, basis set and MD timestep. Plotted are the frequencies of the three IR active mode (in the experimentally accessible region) of this complex. The circles on the x-axes mark the experimental peaks (at ¯T =100 K). Along the sets of diamonds, the temperature is changed from ¯T =0 K (harmonic analysis) to T = 100 K ( ¯T =96 K). Along the sets of squares the grid is changed from ‘light’ to ‘really tight 974’, i.e. including the extended angular grid [30]. Along the sets of downward triangles the basis set is changed independently for the two elements, from ‘tier1 − gh’ for Au and ‘tier1 − f ’ for Kr to ‘tier2’ for both elements. Along the upward triangles the timestep is changed from 10 to 1 ps. The labels for the basis set are ‘T1’ for ‘tier1’, ‘T2’ for ‘tier2’, while ‘tier1 − gh’ means that a g and a h atomic basis function are missing from ‘tier1’. On the right the status of the settings that are not changed along the sets are specified. In that case, when the basis set is marked with just ‘T2’, it means ‘tier2’ for both Au and Kr.
associated to the lowest-frequency of these modes appears in the experimental spectrum (see figure4) as divided into three sub-peaks (we assign the fourth sub-peak at the lowest frequency to the obtuse-angled isomer of this cluster). For the analysis reported in figure A.1, we have reported the sub-peak at highest frequency, i.e. at 63 cm−1. The position of the three experimental peaks (the other two are at 88 and 190 cm−1) are marked on the x-axes of the plot as filled circles.
This particular isomer was chosen because it has IR visible modes near the extremes and in the middle of the (experimentally accessible) frequency interval spanned by the gold clusters. There are also modes at frequencies lower than 50 cm−1, but they fall below the experimental window. Right above the experimental points, the positions of the theoretical peaks at various
temperatures, all the other settings being fixed, appear. One can note that the peaks are generally red-shifted at increasing temperature, but, more strikingly, the change of frequency as a function of temperature is not the same at all frequencies: lower frequency modes shift more than higher frequency ones. This is one of the effects of anharmonicity. One can note that in the harmonic approximation (i.e. at T = 0 K) the lowest frequency mode is closer to the experimental value than the highest frequency mode to its experimental counterpart. As a consequence, in literature an empirical scaling factor for aligning the theoretical and experimental numbers is often employed . At ¯T =100 K the three peaks are then red-shifted by different amounts from their positions calculated within the harmonic approximation, in such a way that a (rigid) blue-shift would bring them in approximate correspondence with the experimental values. The necessity of a rigid shift rather than a scaling factor for theoretical finite-temperature spectra has been already noted by other authors (see e.g. [42] and references therein). Here we make the systematic observation that (a) when the density of the integration grid is increased (set of squares in figure A.1), (b) when the size of the basis set is increased (set of downwards triangles) or (c) when the MD timestep is decreased (set of upward triangles), i.e. whenever the accuracy of the evaluation of the potential-energy surface improves, the position of the peaks are always blue-shifted, i.e. toward the experimental values. These shifts are also approximately rigid (except when passing from the least accurate basis set or grid to the next step) across the frequency window. It has to be noted that the sensitivity of the peak positions toward the settings is quite small, unless when passing from the coarsest ‘light’ integration grid to the next level (‘tight’), or when passing from the very small basis set (‘tier1’ for Kr, without the f function) to the next level.
References
[1] Hammer B and Nørskov J K 1995 Nature376238
[2] Haruta M, Kobayashi T, Sano H and Yamada N 1987 Chem. Lett.16405
[3] Haruta M, Yamada N, Kobayashi T and Iijima S 1989 J. Catal.115301
[4] Haruta M 1997 Catalysis Today36153
[5] Gr¨onbeck H and Andreoni W 2000 Chem. Phys.2621
[6] H¨akkinen H and Landman U 2000 Phys. Rev. B622287
[7] Wesendrup R, Hunt T and Schwerdtfeger P 2000 J. Chem. Phys.1129356
[8] Fern´andez E, Soler J M, Garz´on I L and Balb´as L 2004 Phys. Rev. B70165403
[9] Soul´e B, de Bas Ford M J and Cortie M B 2004 J. Mol. Struct.686193
[10] Rusakov A, Rykova E, Scuseria G E and Zaitsevskii A 2007 J. Chem. Phys.127164322
[11] Furche F, Ahlrichs R, Weis P, Jacob C, Gilb S, Bierweiler T and Kappes M M 2002 J. Chem. Phys.1176982
[12] Johansson M, Lechtken A, Schooss D, Kappes M M and Furche F 2008 Phys. Rev. A77053202
[13] Huang W and Wang L-S 2009 Phys. Rev. Lett.102153401
[14] Schooss P D, Weis D, Hampe O and Kappes M M 2010 Phil. Trans. R. Soc. A3681211
[15] Wang L-M and Wang L-S 2012 Nanoscale44038
[16] Gilb S, Weis P, Furche F, Ahlrichs R and Kappes M M 2002 J. Chem. Phys.1164094
[17] Jackschath C, Rabin I and Schulze W 1992 Ber. Bunsenges. Phys. Chem.961200
[18] Collings B A, Athanassenas K, Lacombe D, Rayner D M and Hackett P A 1994 J. Chem. Phys.1013506
[19] Gruene P, Rayner D M, Redlich B, van der Meer A F G, Lyon J T, Meijer G and Fielicke A 2008 Science
321674
[20] Lin L, H¨oltzl T, Gruene P, Claes P, Meijer G, Fielicke A, Lievens P and Nguyen M T 2008 Chem. Phys.
[21] Lin L, Claes P, Gruene P, Meijer G, Fielicke A, Nguyen M T and Lievens P 2010 Chem. Phys. Chem.111932
[22] Gehrke R, Gruene P, Fielicke A, Meijer G and Reuter K 2009 J. Chem. Phys.130034306
[23] Burow A M, Wende T, Sierka M, Wlodarczyk R, Sauer J, Claes P, Jiang L, Meijer G, Lievens P and Asmis K R 2011 Phys. Chem. Chem. Phys.1319393
[24] Asmis K R, Wende T, Brummer M, Gause O, Santambrogio G, Stanca-Kaposta E C, Dobler J, Niedziela A and Sauer J 2012 Phys. Chem. Chem. Phys.149377
[25] Mancera L A and Benoit D M 2013 Phys. Chem. Chem. Phys.151929
[26] Tkatchenko A, Di Stasio R A Jr, Head-Gordon M and Scheffler M 2009 J. Chem. Phys.131094106
[27] Fielicke A, von Helden G and Meijer G 2005 Eur. Phys. J. D3483
[28] Oepts D, van der Meer A F G and van Amersfoort P W 1995 Infrared Phys. Technol.36297
[29] Kwapien K, Sierka M, D¨obler J, Sauer J, Haertelt M, Fielicke A and Meijer G 2011 Angew. Chem. Int. Edn
Engl.501716
[30] Blum V, Gehrke R, Hanke F, Havu P, Havu V, Ren X, Reuter K and Scheffler M 2009 Comput. Phys. Commun.
1802175
[31] Perdew J P, Burke K and Ernzerhof M 1996 Phys. Rev. Lett.773865
[32] Tkatchenko A and Scheffler M 2009 Phys. Rev. Lett.1026
[33] van Lenthe E, Baerends E and Snijders J 1994 J. Chem. Phys.101
[34] Zhang Y, Xua X and Goddard W A III 2008 Proc. Natl Acad. Sci. USA1064963
[35] Ren X, Rinke P, Joas C and Scheffler M 2012 J. Mater. Sci.477447
[36] Frisch M J et al 2004 Gaussian 03, Revision D.01 (Wallingford, CT: Gaussian) [37] Figgen D, Rauhut G, Dolg M and Stoll H 2005 Chem. Phys.311227
[38] Peterson K A and P C 2005 Theor. Chem. Acc.114283
[39] Peterson K A, Figgen D, Goll E, Stoll H and Dolg M 2003 J. Chem. Phys.11911113
[40] Ren X, Rinke P, Blum V, Wieferink J, Tkatchenko A, Sanfilippo A, Reuter K and Scheffler M 2012 New J.
Phys.14053020
[41] Ram´ırez R, L´opez-Ciudad T, Kumar P and Marx D 2004 J. Chem. Phys.1213973
[42] Gaigeot M-P, Martinez M and Vuilleumier R 2007 Mol. Phys.1052857
[43] Gaigeot M-P and Sprik M 2003 J. Phys. Chem. B10710344
[44] Iftimie R and Tuckerman M E 2005 J. Chem. Phys.122214508
[45] Bussi G, Donadio D and Parrinello M 2007 J. Chem. Phys.126014101
[46] Ceriotti M 2010 PhD Thesis ETH, Zurich (available ate-collection.library.ethz.ch/view/eth:2145) [47] Ceriotti M and Markland T E 2012 J. Chem. Phys.138014112
[48] Bechthold P S, Parks E K, Weiller B H, Pobo L G and Riley S J 1990 Z. Phys. Chem.169101
[49] Collings B A, Amrein A H, Rayner D M and Hackett P A 1993 J. Chem. Phys.994174
[50] Pyykk¨o P 1995 J. Am. Chem. Soc.1172067
[51] Breckenridge W H, Ayles V L and Wright T G 2008 J. Phys. Chem. A1124209
[52] Scott W Hopkins, Woodham A P, Plowright R J, Wright T G and M S R 2010 J. Chem. Phys.132214303
[53] Ghiringhelli L M, Levchenko S and Scheffler M 2013 in preparation
[54] Jamshidi Z, Fakhraei Far M and Maghari A 2012 J. Phys. Chem. A11612510
[55] James A, Kowalczyk P, Simard B, Pinegar J and Morse M 1994 J. Mol. Spectrosc.168248
[56] Lombardi J R and Davis B 2002 Chem. Rev.1022431
[57] Hilpert K and Gingerich K A 1980 Ber. Bunsenges. Phys. Chem.84739
[58] Knickelbein M B 1994 J. Chem. Phys.1004729