HAL Id: hal-00295492
https://hal.archives-ouvertes.fr/hal-00295492
Submitted on 27 Aug 2004
HAL is a multi-disciplinary open access
archive for the deposit and dissemination of
sci-entific research documents, whether they are
pub-lished or not. The documents may come from
teaching and research institutions in France or
abroad, or from public or private research centers.
L’archive ouverte pluridisciplinaire HAL, est
destinée au dépôt et à la diffusion de documents
scientifiques de niveau recherche, publiés ou non,
émanant des établissements d’enseignement et de
recherche français ou étrangers, des laboratoires
publics ou privés.
from in-situ CO measurements during SPURT
P. Hoor, C. Gurk, D. Brunner, M. I. Hegglin, H. Wernli, H. Fischer
To cite this version:
P. Hoor, C. Gurk, D. Brunner, M. I. Hegglin, H. Wernli, et al.. Seasonality and extent of extratropical
TST derived from in-situ CO measurements during SPURT. Atmospheric Chemistry and Physics,
European Geosciences Union, 2004, 4 (5), pp.1427-1442. �hal-00295492�
www.atmos-chem-phys.org/acp/4/1427/
SRef-ID: 1680-7324/acp/2004-4-1427
Chemistry
and Physics
Seasonality and extent of extratropical TST derived from in-situ CO
measurements during SPURT
P. Hoor1,2, C. Gurk2, D. Brunner1, M.I. Hegglin1, H. Wernli1,3, and H. Fischer2
1Institute for Atmospheric and Climate Science, Swiss Federal Institute of Technology, Z¨urich, Switzerland 2Max Planck Institute for Chemistry, Air Chemistry, Mainz, Germany
3Institute for Atmospheric Physics, University of Mainz, Germany
Received: 26 January 2004 – Published in Atmos. Chem. Phys. Discuss.: 16 March 2004 Revised: 24 August 2004 – Accepted: 24 August 2004 – Published: 27 August 2004
Abstract. We present airborne in-situ trace gas measure-ments which were performed on eight campaigns between November 2001 and July 2003 during the SPURT-project (SPURenstofftransport in der Tropopausenregion, trace gas transport in the tropopause region). The measurements on a quasi regular basis allowed an overview of the seasonal vari-ations of the trace gas distribution in the tropopause region over Europe from 35◦–75◦N to investigate the influence of transport and mixing across the extratropical tropopause on the lowermost stratosphere.
From the correlation of CO and O3 irreversible mixing of tropospheric air into the lowermost stratosphere is iden-tified. The CO distribution indicates that transport and sub-sequent mixing of tropospheric air across the extratropical tropopause predominantly affects a layer, which closely fol-lows the shape of the local tropopause. In addition, the sea-sonal cycle of CO2 illustrates the strong coupling of that layer to the extratropical troposphere. Both, horizontal gradi-ents of CO on isentropes as well as the CO-O3-distribution in the lowermost stratosphere reveal that the influence of quasi-horizontal transport and subsequent mixing weakens with distance from the local tropopause. The mixing layer ex-tends to about 25 K in potential temperature above the local tropopause exhibiting only a weak seasonality.
However, at large distances from the tropopause a signif-icant influence of tropospheric air is still evident. The rela-tion between N2O and CO2indicates that a significant tribution of air originating from the tropical tropopause con-tributes to the background air in the extratropical lowermost stratosphere.
Correspondence to: P. Hoor ([email protected])
1 Introduction
Mixing of tropospheric air across the extratropical tropopause plays an important role for the trace gas composition in the lowermost stratosphere affecting chem-istry and radiative transfer in the UT/LS region at mid and high latitudes. Tropospheric pollutants like volatile organic compounds (VOC’s) and reactive nitrogen affect local chemistry in the lowermost stratosphere, thereby acting in particular on the budgets of HOx and O3. Photochemical production of O3 (Lacis et al., 1990) and mixing of in-frared active species originating from the troposphere have direct impact on the radiation budget and therefore on the temperature distribution in the lowermost stratosphere. In particular trends of O3 in that region are subject to large uncertainties due to the high variability of the underlying photochemical and dynamical processes (WMO, 2003). Therefore, a detailed understanding of extratropical cross tropopause transport and its effect on the trace gas compo-sition is essential to understand the processes controlling photochemistry in the lowermost stratosphere.
It is well known that tropospheric air enters the strato-sphere predominantly in the tropics where air is lifted up-wards and poleup-wards on timescales of several years as part of the Brewer-Dobson circulation (Holton et al., 1995). Di-abatic downward motion occurs at mid- and high latitudes exhibiting a seasonal cycle. Downward flux through the 2 = 380 K surface maximizes during winter (Appenzeller et al., 1996) contributing to the trace gas composition of the lowermost stratosphere. According to Hoskins (1991) the lowermost stratosphere is defined as the region where isen-tropes cross the extratropical tropopause, thus enabling bidi-rectional exchange between both parts of the middleworld (Holton et al., 1995).
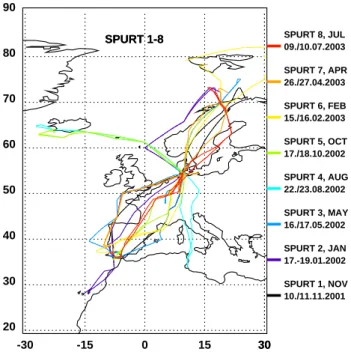
-30 -15 0 15 3030 20 30 40 50 60 70 80 90 SPURT 1-8 10./11.11.2001 17.-19.01.2002 16./17.05.2002 22./23.08.2002 17./18.10.2002 15./16.02.2003 26./27.04.2003 09./10.07.2003 SPURT 1, NOV SPURT 2, JAN SPURT 3, MAY SPURT 4, AUG SPURT 5, OCT SPURT 6, FEB SPURT 7, APR SPURT 8, JUL SPURT 1-8
Fig. 1. Flight tracks for the SPURT missions from November 2001
to July 2003.
In the following we will use the terms TST for troposphere-to-stratosphere transport, STT for stratosphere-to-troposphere transport, both characterizing the transfer of mass across the tropopause (Stohl et al., 2003) associated with a change of PV in the transported air parcel. The lat-ter is a prerequisite for mixing. We will use the lat-term mix-ing when we refer to an irreversible intermediate chemical composition of the involved air masses. STE (stratosphere-troposphere exchange) refers to the bidirectional process.
Numerous in-situ measurements in the vicinity of tropopause folds confirmed that the tropopause in the extrat-ropics is not totaly impermeable to transport and that STE oc-curs (e.g. Danielsen, 1968; Shapiro, 1980; Kritz et al., 1991). In addition, convection has been identified injecting bound-ary layer air directly into the lowermost stratosphere within several hours (Poulida et al., 1996; Fischer et al., 2003). Ra-diative processes associated with the decay of anticyclones also might play an important role for TST in the extratropics (Zierl and Wirth, 1997).
Besides these case studies, the results of Dessler et al. (1995), Fischer et al. (2000) and Hoor et al. (2002) indicated that the sum of these rather localized TST-processes result in the formation of a mixing layer in the lowermost strato-sphere exhibiting the photochemical characteristic of both, the troposphere and the stratosphere. Water vapour measure-ments showed that TST occurs between 2 = 320–360 K, but indicated a weakening influence with increasing PV on each isentropic surface (Pan et al., 2000).
Model studies indicated only a weak seasonality of the strength of TST on global scales (Sprenger and Wernli, 2003)
in contrast to STT. During summer the location of TST shifts to higher isentropic surfaces (Chen, 1995) exhibiting a sec-ondary maximum at 2 = 360 K (Sprenger and Wernli, 2003) possibly due to weaker PV-gradients and therefore a reduced barrier to TST at the subtropical jet (Chen, 1995; Haynes and Shuckburgh, 2000).
Beside the seasonality it is still an open question how far the effect of TST and subsequent mixing extends into the lowermost stratosphere in the vertical (cross isentropic) as well as in the quasi-horizontal direction on isentropes. In the stratosphere the air masses associated with TST furthermore interact with the diabatic downward motion (James et al., 2003).
In-situ measurements addressing this question were lim-ited by their temporal and spatial coverage. Ray et al. (1999) concluded from three balloon profiles at 34.5◦N and 64◦N, respectively, that the late spring lowermost stratosphere was dominated by air, which descended from 2>380 K, whereas in September tropospheric air contributed to a fraction of 50–80%. They concluded that the tropospheric fraction was mixed across the extratropical tropopause into the lower-most stratosphere. Based on two airborne measurement cam-paigns in Winter 1997 (northern Europe, 69◦N) and summer 1998 (Canada, 48◦N) Hoor et al. (2002) concluded that mix-ing across the extratropical tropopause results in the forma-tion of a layer with higher vertical extent in summer than in winter.
The next section gives a short description of the SPURT project and the measurement concept followed by an overview of the experimental setup. After a description of the data coverage in the tropopause region we discuss ex-emplary CO-profiles and investigate implications for TST in the UT/LS region using the whole SPURT data set. Finally, we will focus on the tropospheric contribution to the strato-spheric background air using long-lived tracers like CO2and N2O.
2 Project Overview
2.1 The SPURT concept
In 2001 the SPURT (trace gas transport in the tropopause region) project started to investigate dynamical and chemi-cal processes affecting the chemichemi-cal composition of the ex-tratropical lowermost stratosphere. Although the investiga-tion of TST was the prime focus of the project, single case studies of transport and mixing processes were a minor com-ponent of the project. Instead, a seasonal overview of the trace gas distribution in the tropopause region over a broad range of latitudes was investigated. The goal was to ex-amine seasonal variations and the integral effect of individ-ual TST-events on the trace gas composition of the low-ermost stratosphere. Therefore, a total of eight airborne measurement campaigns were performed in different months
Table 1. Instrumentation during SPURT.
species technique institute
CO, N2O, CH4 TDLAS MPI Mainz CO2 NDIR (LiCor-6262) MPI Mainz NO, NOy, O3 CLD + gold converter ETH Z¨urich H2O Lyman-α-fluorescence FZ J¨ulich
O3 UV-absorption FZ J¨ulich
N2O, F-12, SF6 in-situ GC University Frankfurt/Main
between 2001 and 2003. Home base was Hohn (northern Germany, 52◦N, 8◦E). A typical campaign consisted of two northbound and two southbound flights, respectively, cov-ering a latitude range from approximately 35◦N to 75◦N (Fig. 1). The flights were performed on two consecutive days and sampled a snapshot of the trace gas distribution in the tropopause region over Europe for a given meteorologi-cal situation. Flight planning for each campaign was based on the meteorological forecast provided by the ETH Z¨urich using operational ECMWF-data. In particular the PV-fields were used to deduce the location of the tropopause for the planning of the individual flights.
Each flight typically consisted of two long flight legs at constant altitude, one leg within the tropopause region and the second one high above in the lowermost stratosphere. At the end of each flight the aircraft climbed to maximum altitude in order to sample undisturbed stratospheric back-ground air followed by a slow descent providing high resolu-tion vertical profiles. Intermediate landings were made close to the most southerly and northerly points resulting in a total of eight vertical profiles per campaign at different latitudes. The successive flight on the same day mirrored the flight pat-tern such that each point along the flight path was sampled at two different altitudes, which was not always possible due to aircraft limitations and air traffic restrictions.
2.2 Experimental setup
A Lear Jet 35 operated by GFD (Gesellschaft f¨ur Flugzield-arstellung) in cooperation with the company enviscope was used as measurement platform. The aircraft is capable of reaching a maximum flight altitude of 13.7 km and has a range of approximately 2000 km at a cruising speed of 150 m/s. Table 1 gives an overview of the payload and lists the measured species and the techniques used. The trace gas measurements were supplemented by measurements of meteorological parameters such as pressure, temperature and horizontal winds.
CO, CH4and N2O were measured with the Tunable Diode Laser Absorption Spectrometer (TDLAS) TRISTAR (Tracer in situ TDLAS for atmospheric research) (Wienhold et al., 1998; Kormann et al., 2002). Time multiplexing is achieved
by pneumatically driven pop-up mirrors allowing subsequent measurement of each species with an integration time of 1.5 s. The time resolution is ultimately limited by the summed integration times for the three measurement chan-nels resulting in a duty cycle of less than 5 s for each species. The instrument is calibrated in-flight using secondary stan-dards of dried ambient air, whose concentrations are cross-calibrated prior to and after the campaigns against a labo-ratory long term standard. To guarantee consistency over the different campaigns the long term laboratory standard is traced to NOAA standards. The total uncertainty for N2O, CO and CH4is better than 1%, 1.5% and 2.5%, respectively. These values have to be taken as upper limits since the pre-cision is determined from the reproducibility of the in-flight calibrations, thus mainly mirroring the slow drifts of the in-strument sensitivity, which are accounted for in the subse-quent data processing. Furthermore, N2O is measured inde-pendently by the in-situ GC GHOST (University of Frank-furt/Main). Both techniques yield an excellent agreement of 98% (H. B¨onisch, personal communication).
A LICOR 6262 was used to determine CO2 mixing ra-tios with a time resolution of 1 Hz. A constant-pressure inlet allows the instrument to operate at a pressure of 850 (±0.1) hPa. The instrument temperature was stabi-lized to 40.0◦C. Ambient CO2is determined against a refer-ence gas of known CO2concentration. In-flight calibrations are performed with two secondary standards of compressed dried air, bracketing the expected ambient values. The stan-dards are cross-calibrated against two NOAA CMDL pri-mary standards. Total uncertainty of the measurements is better than 0.1%.
Ozone has been measured using a chemiluminescence de-tector (ECO-Physics SR-790) with an overall accuracy of 5%. The detector has been calibrated before and after each measurement campaign using a commercial ozone calibrator. Meteorological forecasts and analysis data were provided by the ETH-Z¨urich and were based on the 3-h opera-tional ECMWF data with 60 vertical levels corresponding to a height resolution of about 700 m at the extratropical tropopause. The meteorological post-flight analysis included the calculation of ten-day backward trajectories (Wernli and Davies, 1997) which were initialized every ten seconds along the flight track, providing information in particular on the history of PV and 2 of the encountered air masses.
3 Data coverage
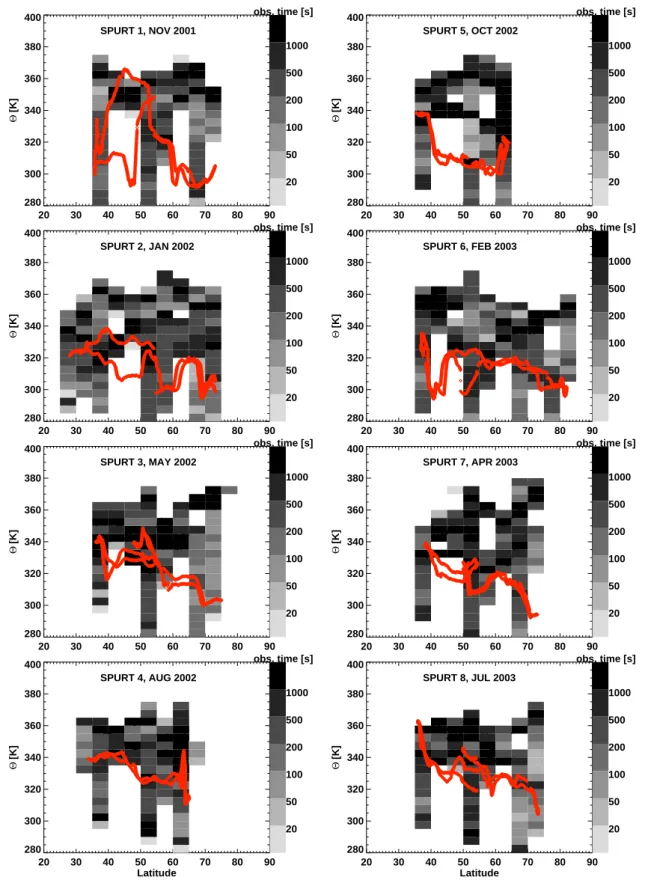
As mentioned earlier, the main focus of SPURT was to establish an overview of the chemical composition in the tropopause region. For this purpose a sufficient data coverage is crucial. Figure 2 displays the total observation time binned with respect to potential temperature 2 and latitude for all eight campaigns. Superimposed is the tropopause-potential temperature (denoted 2T P in the following) interpolated
20 30 40 50 60 70 80 90 280 300 320 340 360 380 400 Θ [K] 20 50 100 200 500 1000 SPURT 1, NOV 2001 obs. time [s] 20 30 40 50 60 70 80 90 280 300 320 340 360 380 400 Θ [K] 20 50 100 200 500 1000 SPURT 2, JAN 2002 obs. time [s] 20 30 40 50 60 70 80 90 280 300 320 340 360 380 400 Θ [K] 20 50 100 200 500 1000 SPURT 3, MAY 2002 obs. time [s] 20 30 40 50 60 70 80 90 Latitude 280 300 320 340 360 380 400 Θ [K] 20 50 100 200 500 1000 SPURT 4, AUG 2002 obs. time [s] 20 30 40 50 60 70 80 90 280 300 320 340 360 380 400 Θ [K] 20 50 100 200 500 1000 SPURT 5, OCT 2002 obs. time [s] 20 30 40 50 60 70 80 90 280 300 320 340 360 380 400 Θ [K] 20 50 100 200 500 1000 SPURT 6, FEB 2003 obs. time [s] 20 30 40 50 60 70 80 90 280 300 320 340 360 380 400 Θ [K] 20 50 100 200 500 1000 SPURT 7, APR 2003 obs. time [s] 20 30 40 50 60 70 80 90 Latitude 280 300 320 340 360 380 400 Θ [K] 20 50 100 200 500 1000 SPURT 8, JUL 2003 obs. time [s]
Fig. 2. Data coverage for SPURT as a function of latitude and potential temperature 2. The location of the local tropopause at the position
along the flight path. Although it was not possible to com-pletely cover the region above the local tropopause, a dense coverage was achieved from 35–75◦N up to 2 = 360 K. The two flights to Iceland during SPURT 4 in August 2002 and SPURT 5 in October 2002 resulted in a smaller latitude range for these missions.
The data, which were sampled during each individual measurement campaign covered a broad range of meteoro-logical situations due to meridional northward advection of (sub-)tropical tropospheric air or southward excursions of stratospheric air, both associated with large variations of the tropopause altitude along the flight path. A detailed descrip-tion of the meteorological situadescrip-tion during each individual flight is beyond the scope of this study and will be given in a separate article. Here, we focus on the temporal and spatial distribution of trace gases in the tropopause region to deduce the extent of TST in the lowermost stratosphere.
The trace gas composition of a single air parcel can be re-garded as the sum of several independent individual mixing events and thus represents a spectrum of different air masses and mixing time scales. Therefore a detailed analysis of the meteorological situation during each individual flight is not essential for the understanding of the trace gas distribution in the lowermost stratosphere. However, knowledge of the geo-graphical location of the local tropopause relative to the loca-tion of the measurements is crucial to separate tropospheric and stratospheric air.
For the following analysis we used a dynamical def-inition of the tropopause based on a value of 2 PVU (1 PVU=10−6m2K s−1kg−1). Although the tropopause was crossed at different 2-levels several times during each cam-paign, an in-situ, tracer- or temperature-based tropopause definition is not feasible since the aircraft flew most of the times in varying distances above or below the tropopause.
During each campaign at least the 2 = 370 K isen-tropic surface was crossed generally high above the local tropopause, allowing the characterization of stratospheric air far from recent extratropical tropospheric influence, but close to the lower boundary of the overworld.
4 Results
4.1 Irreversibility of TST
To identify TST and subsequent mixing across the extratrop-ical tropopause we used the relation between CO and N2O. The most important source for CO in the stratosphere is the photochemical degradation of CH4 via OH. Destruction of CO takes place via the reaction with OH forming CO2 result-ing in a lifetime of CO on the order of several months. If no additional CO from the troposphere is mixed into the strato-sphere, a steady state volume mixing ratio of 8–15 ppbv es-tablishes, which is the balance between photochemical pro-duction from CH4and the much faster CO oxidation via OH
0 20 40 60 80 100 120 140 280 300 320 340 N2 O [ppbv] autumn ∆Θ < 0 ∆Θ > 0 0 20 40 60 80 100 120 140 280 300 320 340 N2 O [ppbv] winter ∆Θ < 0 ∆Θ > 0 0 20 40 60 80 100 120 140 280 300 320 340 N2 O [ppbv] spring ∆Θ < 0 ∆Θ > 0 0 20 40 60 80 100 120 140 CO [ppbv] 280 300 320 340 N2 O [ppbv] summer ∆Θ < 0 ∆Θ > 0
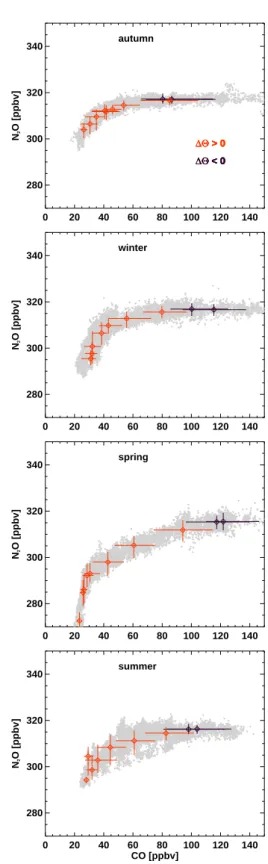
Fig. 3. Scatter plots of N2O and CO merged for different seasons. Colored symbols show the medians relative to the PV = 2 PVU-surface binned in steps of 12 = 10 K (see text for details). Bars show the variability in each bin centered at the respective means.
0 2 4 6
Number per Bin
0 10 20 30 40
∆Θ [K]
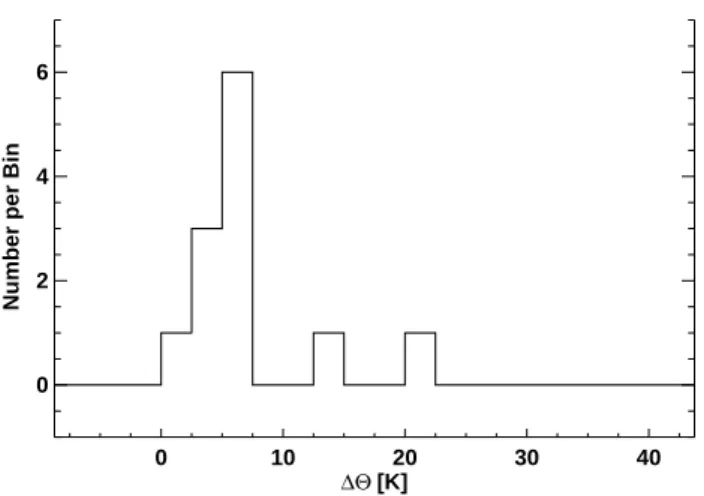
Fig. 4. Comparison of thermal and dynamical tropopause for the SPURT flights showing the distribution of 12 at the thermal tropopause. Details see text.
(Flocke et al., 1999). High altitude measurements by the ER-2 in the tropics as well as in polar regions indicated almost constant CO-values of 12 ppbv (Flocke et al., 1999; Toon et al., 1999). In the stratosphere near the local tropopause in general values above this background are observed reflecting transport of tropospheric air into the stratosphere. Thus, in the stratosphere any excess CO above the equilibrium level indicates a contribution of air of tropospheric origin.
The sources of N2O are at the earth’s surface. Unlike CO, tropospheric N2O is well mixed giving a rather constant tro-pospheric mean value of 317 ppbv. It’s major sink is in the tropical stratosphere where it is destroyed via photoly-sis and reaction with O(1D). The long local photochemical lifetime on the order of 120 years (Volk et al., 1997) leads to much weaker N2O-gradients at the tropopause than for O3, but makes it ideal to trace stratospheric transport since N2O is not affected by local photochemistry. In a CO-N2O scatter-plot mixing of air across the tropopause leads to the formation of positive correlations among both species. In particular, intermediate CO between tropospheric values and stratospheric background at decreasing N2O-levels clearly indicates irreversible mixing of tropospheric air into the low-ermost stratosphere.
As illustrated in Fig. 3 the N2O-CO-relationship exhibits rather compact slopes over different seasons towards higher altitudes (i.e. lower N2O-values). Lowest N2O values are found during winter and spring, respectively, accompanied with the steepest slopes of the N2O-CO correlation. Both findings indicate a stronger contribution of photochemically aged stratospheric air in the lowermost stratosphere com-pared to summer and autumn. The transition from tropo-spheric to stratotropo-spheric air in Fig. 3 is indicated by interme-diate values of CO at decreasing levels of N2O.
Since we are interested in the extent of isentropic mixing in the lowermost stratosphere we analyzed our data in
poten-tial temperature coordinates relative to the local tropopause (12 [K]). 12 was deduced from ECMWF-data by calculat-ing the difference between 2 and 2T P at the PV = 2 PVU-surface along the flight path. A single PV-value of two PVU seems to be somewhat arbitrary since PV-values rang-ing from 1.5–3.5 PVU have been used to define the extratrop-ical tropopause (e.g. WMO (1986); Hoerling et al. (1991)).
However, it is evident from Fig. 3 that an almost constant tropospheric N2O-value of 317 ppbv indicative for tropo-spheric air is found at 12<0 (i.e. PV < 2 PVU). Above, the decrease of N2O starts within 12 = 10 K above the local tropopause. If the PV-threshold of 2 PVU were too far off the tropopause, the rapid overturning and mixing would have destroyed a stratospheric N2O-signature in the troposphere on timescales of hours to days.
We compared the thermal and the dynamical tropopause definition for vertical profiles reaching sufficiently high into the stratosphere to apply the thermal criterion (lowest level, where temperature lapse rate is exceeding −2 K/km with the average lapse rate within the next 2 kilometers above not falling below −2 K/km). Fig. 4 shows that on aver-age the dynamical tropopause is found slightly below the thermal tropopause in agreement with the results of Ho-erling et al. (1991) and Bethan et al. (1996). When we use a less restrictive criterion by averaging the temperatures only within one kilometer to account for higher tropopause altitudes (not shown) the signature becomes even stronger with 80% of thermal tropopauses falling into the bin below 12=7.5 K. As indicated by Wirth (2001) the bias of the ther-mal tropopause towards a higher PV-threshold partly arises from the choice of the −2 K/km criterion. Using a lapse rate threshold which is closer to the average of typical tro-pospheric and stratospheric lapse rates, respectively, the dis-crepancies are reduced.
Note that the observation of decreasing N2O above
12= 0 (equivalent to PV = 2 PVU) which indicates per-sistent stratospheric influence in the 12 = 0–10 K bin, il-lustrates that the photochemical transition from the tropo-sphere into stratotropo-sphere falls into that region. The almost tropospheric trace gas signature in the 12 = 0–10 K-bin during autumn can be due to the weak contribution of over-world air in late summer/autumn (Ray et al., 1999) leading to weak N2O gradients at the tropopause, but might also arise from the choice of a single PV-value of 2 PVU for the tropopause. Thus, in the following the latter may result in an upper limit of distances relative to the local tropopause, when dealing with 12, but as indicated in Fig. 3 and Fig. 4 this offset is in general on the order of 12 = 5–7.5 K. There-fore, Fig. 3 illustrates that the dynamical tropopause defined as the PV = 2 PVU-surface is a good approximation for the tropopause in our measurement region.
Focussing on mixing processes at the extratropical tropopause rather than the stratospheric background the cor-relation of CO and O3is more appropriate due to the stronger gradient of ozone at the tropopause. In a CO-O3scatter-plot
mixing of air across the tropopause leads to the formation of mixing lines connecting stratospheric background and upper tropospheric CO- and O3-values, respectively. Note, that the appearance of mixing lines associated with an intermediate chemical composition of air in the lowermost stratosphere in-dicates the irreversibility of the mixing process. The method is described in detail in Fischer et al. (2000) and Hoor et al. (2002).
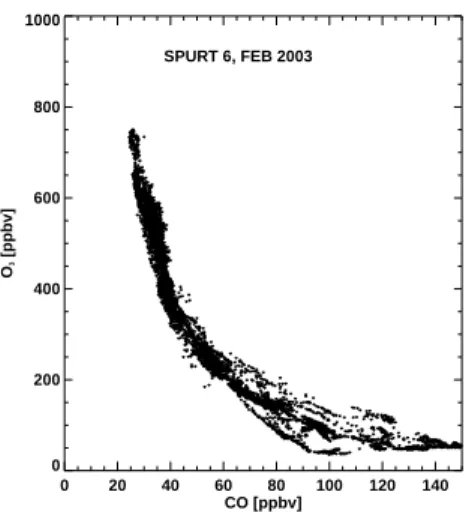
Figure 5 displays the CO-O3-scatterplot for the campaign in February 2003. A rather compact anticorrelation covering almost the entire range of stratospheric O3-mixing ratios is evident. Just above the tropopause O3mixing ratios between 100–300 ppbv accompanied by CO values ranging from 40– 75 ppbv indicate a mixture of tropospheric and stratospheric air. A close inspection reveals distinct mixing lines indicat-ing mixindicat-ing from recent TST-events of various tropospheric origins. Different CO concentrations in the upper tropo-sphere, which are involved in these mixing events result in the observed different slopes of the individual mixing lines. However, most points form the broad compact central band which can be regarded as the sum of individual mixing events that are already completed and possibly remixed, thus form-ing a “smoothed” mean slope. This major part of the correla-tion is therefore independent from the current meteorological situation which on the other hand may determine individual mixing lines.
Higher up in the lowermost stratosphere at ozone levels exceeding 300 ppbv, the slope of the anticorrelation becomes steeper and less scattered, indicating a layer with different air mass characteristics. In particular individual mixing lines that connect directly to the local tropopause are absent de-spite the large data coverage during SPURT 6 (comp. Fig. 2). Note that TST and subsequent mixing associated even with a small amount of tropospheric air would appear as a mixing line in such a scatter plot as long as mixing is incomplete.
The absence of mixing lines above O3>300 ppbv and the steep and compact anti-correlation indicate that recent injec-tions from the extratropical troposphere are of minor impor-tance in this part of the stratosphere. Nevertheless, tropo-spheric influence is still evident due to the fact that observed CO-values ranging from 20–45 ppbv significantly exceed the stratospheric equilibrium value. The rather sharp transition between these two layers in the lowermost stratosphere indi-cates two regions with a different degree of tropospheric in-fluence, different air mass histories and possibly mixing time scales.
4.2 Trace gas profiles and vertical structure of the lower-most stratosphere
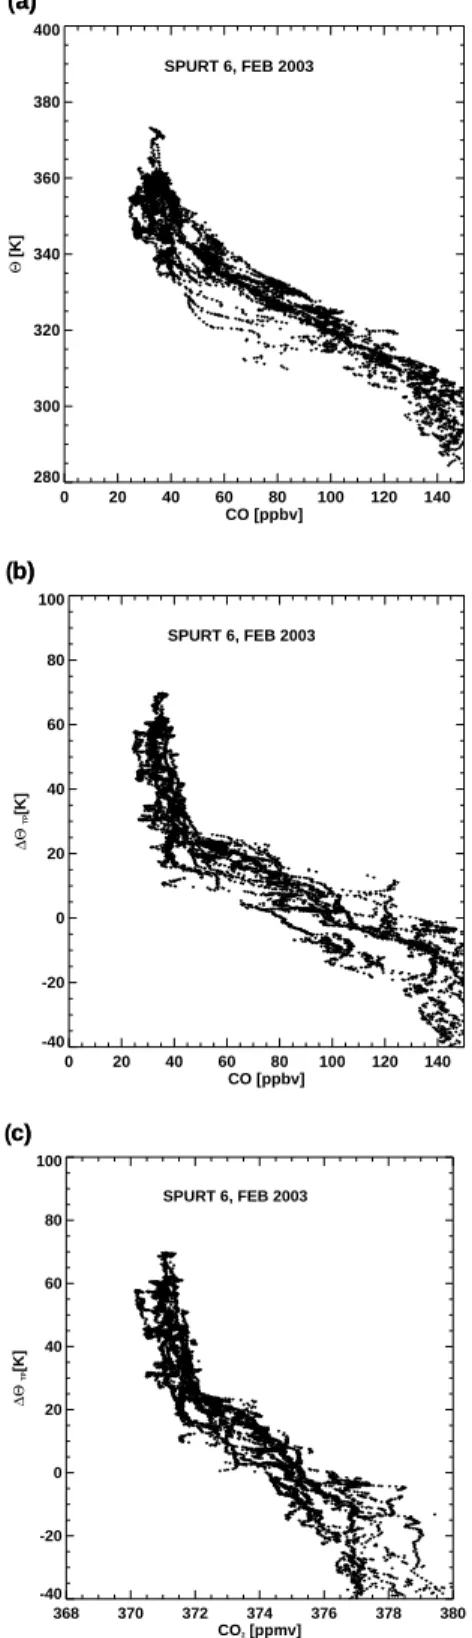
Figure 6a shows the whole CO-dataset which was obtained from the five mission flights during SPURT 6 using 2 as vertical coordinate. The tropopause altitude along the flight tracks during this campaign varied between 350 hPa and 200 hPa, corresponding to variations in 2T P from 295–
0 20 40 60 80 100 120 140 CO [ppbv] 0 200 400 600 800 1000 O3 [ppbv] SPURT 6, FEB 2003
Fig. 5. Scatterplot of CO and ozone for SPURT 6 in February
2003. Taking an ozone threshold of 100 ppbv as an approximation for the tropopause the anticorrelation indicates irreversible cross tropopause mixing. Note, that at O3= 300 ppbv the slope abruptly changes indicating a rather sharp transition between different lay-ers.
335 K (compare Fig. 2). A large part of the scatter in Fig. 6a is due to this variation of the tropopause potential tempera-ture 2T P. In particular no significant upper or lower bound-ary for tropospheric influence becomes evident.
The picture changes significantly, if potential temperature relative to the local tropopause (12 [K]) is used as a verti-cal coordinate. In Fig. 6b the CO data from SPURT 6 are shown as a function of 12 instead of 2. The profile exhibits less scatter resulting in a much higher compactness. In con-trast to Fig. 6a the vertical distribution now displays a kink at 12 = 25 K separating two regimes of different chemical composition within the lowermost stratosphere. Just above the local tropopause CO decreases rapidly within a layer of 12= 25 K from tropospheric values down to mixing ratios of less than 45 ppbv. At greater vertical distances from the tropopause the decrease of CO is much more gradual leading to a steeper CO gradient than directly above the tropopause.
The change of gradient in the vertical CO-profile which appears at 12 = 25 K corresponds to a mean CO value of 45 ppbv. Note that the kink in the CO-O3scatter plot (Fig. 5) is evident at the same CO value separating photochemically aged air and a layer which is influenced by recent mixing as indicated by distinct mixing lines in Fig. 5. Thus, the respec-tive region between the local tropopause and 12 < 25 K (Fig. 6b) is strongly influenced by recent TST-events and subsequent mixing at the extratropical tropopause. It is in-teresting to note that the overall effect of different individual processes and events exhibits a common upper boundary, al-though the data were collected over a broad latitude range (35◦–85◦N) and variations of 2
T P from 295 K–335 K. A similar behaviour can also be identified from other trace gas measurements. For example, CO2 exhibits almost the
0 20 40 60 80 100 120 140 CO [ppbv] 280 300 320 340 360 380 400 Θ [K] SPURT 6, FEB 2003 (a)a) 0 20 40 60 80 100 120 140 CO [ppbv] -40 -20 0 20 40 60 80 100 ∆Θ TP [K] ( SPURT 6, FEB 2003 b) b) 368 370 372 374 376 378 380 CO2 [ppmv] -40 -20 0 20 40 60 80 100 ∆Θ TP [K] ( SPURT 6, FEB 2003 c) c)
Fig. 6. (a) Complete CO data set obtained during the SPURT 6
missions as a function of (a) potential temperature and (b) poten-tial temperature relative to the local tropopause 12. Note the more compact 12-profile and the rather sharp change of the CO gradi-ent at 12 = 25 K. (c) CO2as a function of 12 during SPURT 6 showing the same behaviour at 12 = 25 K.
Table 2. Statistical dependencies for the profiles of CO versus 2,
12and PV during SPURT.
campaign date Spearmans ρ: CO vs.
2 12 PV SPURT 1, NOV 10.–11.11.2001 −0.71 −0.85 −0.91 SPURT 2, JAN 17.–19.01.2002 −0.85 −0.94 −0.89 SPURT 3, MAY 16.–17.05.2002 −0.88 −0.94 −0.90 SPURT 4, AUG 22.–23.08.2002 −0.80 −0.89 −0.85 SPURT 5, OCT 17.–18.10.2002 −0.75 −0.89 −0.79 SPURT 6, FEB 16.–17.02.2003 −0.80 −0.87 −0.74 SPURT 7, APR 26.–27.04.2003 −0.89 −0.94 −0.84 SPURT 8, JUL 09.–10.07.2003 −0.75 −0.87 −0.78
same vertical distribution relative to 12 (Fig. 6c) including a sharp transition at 12 = 25 K. Since CO2 has no pho-tochemical sinks in the lowermost stratosphere its distribu-tion is exclusively controlled by dynamics. It is thus unlikely that the structure seen in the CO-distribution was caused pre-dominantly by photochemical degradation associated with a longer residence time in this part of the lowermost strato-sphere. Instead, the sharp change of gradient of the CO-and CO2-profiles at 12 = 25 K separates air masses with different fractions of tropospheric air, thus different histo-ries, within the lowermost stratosphere. This rather well pro-nounced separation in the lowermost stratosphere marked by the “kink” in the vertical CO- and CO2-12 profiles (Fig. 6b and Fig. 6c) and the CO-O3-correlation (Fig. 5) was found during all campaigns independent of season or latitude.
The most compact relationships appeared between CO and 12(Table 2). We used Spearmans’ rank correlation to com-pare the correlation between CO and the respective parame-ters since it is independent of the “shape” of the distribution. Thus we don’t have to make any assumptions on the func-tional relationship between CO and the respective parame-ters (Press et al., 1999). Although the definition of 12 is based on PV (PV = 2 PVU) a stronger correlation between CO and 12 than for CO and PV is found. On the one hand 2is determined from in-situ measurements of pressure and temperature whereas PV is calculated on a coarse grid. On the other hand PV-gradients might determine trace gas dis-tributions rather than absolute values of PV. The fact that the highest degree of correlation appears between 12 and CO implies that the CO-distribution in the lowermost strato-sphere is more dependent on the vertical distance from the local tropopause than on the absolute 2-value of the isen-tropic surface. This has consequences for the extent of the TST-impact in the lowermost stratosphere which will be dis-cussed in the next section.
5 Discussion
5.1 Seasonal variation of the mixing layer
To investigate the horizontal extent of the TST-impact along isentropic surfaces we used the 2-equivalent latitude coor-dinate system. Equivalent latitude φeq can be obtained by transforming the area that is enclosed by a PV-contour on a given isentrope to a pole-centered circle of equal area. The distance of the respective PV-circles from the equator in de-grees latitude represents φeq, forming a unique relation be-tween PV and φeq on each isentropic surface. The φeq –2-coordinate system can be regarded as tropopause-following since it follows the meridional excursions of PV-contours in-duced by planetary waves. Using a value of PV = 2 PVU (associated to a unique φeq) for the extratropical tropopause, trace gas mixing ratios, which are displayed in this coor-dinate system, therefore appear according to their distance to the local tropopause on a given isentropic surface. For SPURT PV-φeq-relations have been calculated for 37 indi-vidual isentropes from 2 = 270–400 K in steps of 5 K. The equivalent latitude of each measurement point then was ob-tained by bilinear interpolation from the discrete φeq (PV,2)-distribution to the PV- and 2-values at the observation.
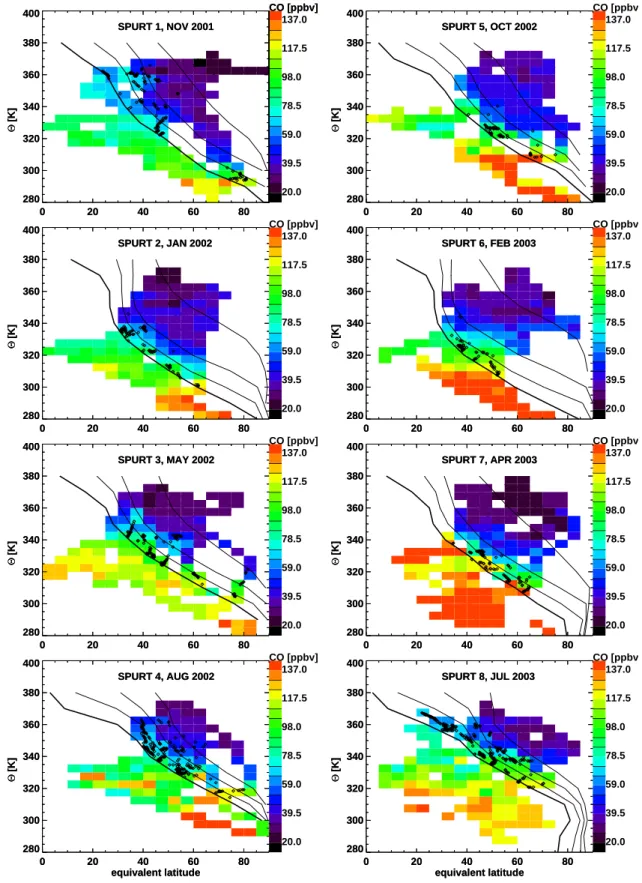
Figure 7 shows the distribution of CO for the whole set of SPURT missions mapped onto φeq–2-coordinates. In the troposphere CO exhibits significant latitudinal gradients in agreement with the climatology of CO for the northern hemisphere (e.g. Emmons et al., 2000; Herman et al., 1999; Zahn et al., 2004). The strongest decline of CO mixing ratios is observed in a layer from PV = 2–6 PVU (black lines), where CO decreases from tropospheric values down to less than 50 ppbv. Thus, the CO-isopleths in the lower-most stratosphere are non-parallel to isentropes resulting in a tropopause-following layer structure independent from sea-son. As stated in the previous section, these CO mixing ra-tios from 50–80 ppbv indicate a mixture of tropospheric and stratospheric air. Moreover, the existence of a tropopause-following layer implies that the effect of mixing out of this layer further into the lowermost stratosphere is only weak or the processes are slow since CO-gradients extend along isen-tropes further into the lowermost stratosphere.
In Fig. 7 the positions of ten-day backward trajectories are superimposed, which indicated TST and ended along the stratospheric part of the flights (black dots). We selected only TST-trajectories that spent at least 24 h in both the tro-posphere and stratosphere, respectively. If quasi-horizontal mixing of tropospheric air deep into the lowermost strato-sphere were fast, one could expect a large spread of TST trajectories on isentropic surfaces. However, this is not ob-served. Almost all TST-trajectories end in close proximity to the local tropopause below 6 PVU and 12<20 K. The dis-tribution of TST as indicated by the TST-trajectories roughly matches the distribution of regions with elevated CO in the stratosphere and supports the hypothesis that TST and
sub-sequent mixing along isentropes on short time scales mainly affect a layer close to the local tropopause.
The picture deduced from the absolute CO volume mixing ratio might be biased by the seasonal and latitudinal varia-tions of CO in the troposphere. From Fig. 7 it is difficult to deduce a seasonality of the extent of mixing or to conclude on variations of the layer depth.
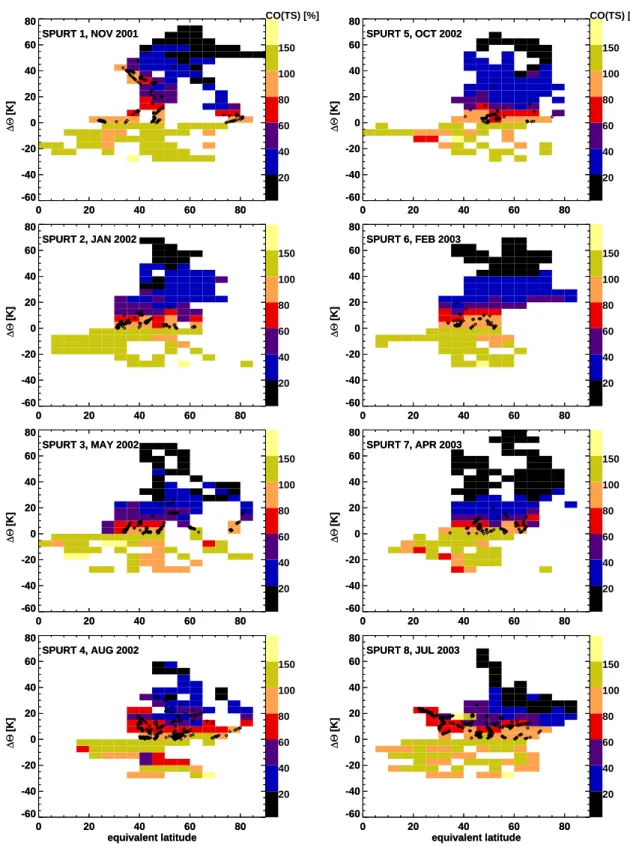
Therefore, we selected all CO data in the region between 12=−5 – 0 K and interpolated these data along 2T P giving upper tropospheric CO (COU T). We furthermore assumed a background equilibrium value of 12 ppbv (referred to as CObkgd) being representative for undisturbed stratospheric air. To obtain a measure for the tropospheric CO-fraction (COT S) the ratio COT S=(CO-CObkgd)/(COU T-CObkgd) was calculated. COT Sshould be independent of the seasonal and latitudinal variations of tropospheric CO-values, and thus re-flect predominantly the effect of TST and mixing on time scales of days to weeks.
Note, that the fraction COT S without any additional infor-mation is not equal to the mass fraction of tropospheric air in the lowermost stratosphere due to the limited photochemical lifetime of CO on the order of three months. In the strato-sphere the CO mixing ratio of an air parcel is not only deter-mined by mixing but also by photochemical degradation de-pending on the time since its last contact to the troposphere. Thus, the approach provides a lower limit for the fraction of tropospheric air in the lowermost stratosphere since photo-chemical degradation of CO is not accounted for.
The distribution of the COT S in φeq −12-coordinates (Fig. 8) confirms the conclusions which are drawn from the absolute CO volume mixing ratios in Fig. 7. The large en-hancements in November 2001 result from a southbound flight in the vicinity of a deep stratospheric intrusion adja-cent to a tropospheric ridge with 2T P>360 K (see Fig. 2) and an almost vertical dynamical tropopause, indicative of a tropopause break. Since 12 is defined as the vertical dis-tance from the PV = 2 PVU-surface a vertical tropopause results in very large 12-values (compare SPURT 1 in Fig. 7 and Fig. 8). The system was associated with a strong jet as well as convective activity ahead of the surface cold front. A detailed case study by Hegglin et al. (2003) suggests that this convective activity over the southwestern Mediterranean, which was associated with intense lightning activity, was re-sponsible for the injection of significant amounts of NOyand water vapor into the lowermost stratosphere.
The use of 12 instead of 2 in Fig. 8 illustrates that iso-lines of constant tropospheric fraction roughly follow the tropopause (12 = 0). A ratio of COT S = 40% approxi-mates the 1/e-photochemical lifetime (37%) which we use as a measure for extratropical TST and subsequent mix-ing within the CO-lifetime. With the exception of the out-standing SPURT 1-campaign the distributions for the cor-responding seasons over different years show similar pat-terns. Largest layer depths and variabilities of the tropo-spheric fraction are observed during the summer campaigns.
0 20 40 60 80 280 300 320 340 360 380 400 Θ [K] 20.0 39.5 59.0 78.5 98.0 117.5 137.0 SPURT 1, NOV 2001 CO [ppbv] CO [ppbv] 0 20 40 60 80 280 300 320 340 360 380 400 Θ [K] 20.0 39.5 59.0 78.5 98.0 117.5 137.0 SPURT 2, JAN 2002 CO [ppbv] 0 20 40 60 80 280 300 320 340 360 380 400 Θ [K] 20.0 39.5 59.0 78.5 98.0 117.5 137.0 SPURT 3, MAY 2002 CO [ppbv] 0 20 40 60 80 equivalent latitude 280 300 320 340 360 380 400 Θ [K] 20.0 39.5 59.0 78.5 98.0 117.5 137.0 SPURT 4, AUG 2002 CO [ppbv] 0 20 40 60 80 280 300 320 340 360 380 400 Θ [K] 20.0 39.5 59.0 78.5 98.0 117.5 137.0 SPURT 5, OCT 2002 CO [ppbv 0 20 40 60 80 280 300 320 340 360 380 400 Θ [K] 20.0 39.5 59.0 78.5 98.0 117.5 137.0 SPURT 6, FEB 2003 CO [ppbv 0 20 40 60 80 280 300 320 340 360 380 400 Θ [K] 20.0 39.5 59.0 78.5 98.0 117.5 137.0 SPURT 7, APR 2003 CO [ppbv 0 20 40 60 80 equivalent latitude 280 300 320 340 360 380 400 Θ [K] 20.0 39.5 59.0 78.5 98.0 117.5 137.0 SPURT 8, JUL 2003 CO [ppbv 0 20 40 60 80 280 300 320 340 360 380 400 Θ [K] SPURT 1, NOV 2001 0 20 40 60 80 280 300 320 340 360 380 400 Θ [K] SPURT 2, JAN 2002 0 20 40 60 80 280 300 320 340 360 380 400 Θ [K] SPURT 3, MAY 2002 0 20 40 60 80 equivalent latitude 280 300 320 340 360 380 400 Θ [K] SPURT 4, AUG 2002 0 20 40 60 80 280 300 320 340 360 380 400 Θ [K] SPURT 5, OCT 2002 0 20 40 60 80 280 300 320 340 360 380 400 Θ [K] SPURT 6, FEB 2003 0 20 40 60 80 280 300 320 340 360 380 400 Θ [K] SPURT 7, APR 2003 0 20 40 60 80 equivalent latitude 280 300 320 340 360 380 400 Θ [K] SPURT 8, JUL 2003
Fig. 7. CO-distribution in equivalent latitude φeq-2-coordinates for the whole SPURT-deployment. The thick black line denotes the location
of the tropopause PV = 2 PVU-surface, thin lines mark the 4,6 and 8 PVU-contours, respectively. Superimposed are the positions of 10-day backward trajectories indicating TST within ten days before the flights.
0 20 40 60 80 -60 -40 -20 0 20 40 60 80 ∆Θ [K] 20 40 60 80 100 150 SPURT 1, NOV 2001 CO(TS) [%] 0 20 40 60 80 -60 -40 -20 0 20 40 60 80 ∆Θ [K] 20 40 60 80 100 150 SPURT 2, JAN 2002 0 20 40 60 80 -60 -40 -20 0 20 40 60 80 ∆Θ [K] 20 40 60 80 100 150 SPURT 3, MAY 2002 0 20 40 60 80 equivalent latitude -60 -40 -20 0 20 40 60 80 ∆Θ [K] 20 40 60 80 100 150 SPURT 4, AUG 2002 0 20 40 60 80 -60 -40 -20 0 20 40 60 80 ∆Θ [K] 20 40 60 80 100 150 SPURT 5, OCT 2002 CO(TS) [% 0 20 40 60 80 -60 -40 -20 0 20 40 60 80 ∆Θ [K] 20 40 60 80 100 150 SPURT 6, FEB 2003 0 20 40 60 80 -60 -40 -20 0 20 40 60 80 ∆Θ [K] 20 40 60 80 100 150 SPURT 7, APR 2003 0 20 40 60 80 equivalent latitude -60 -40 -20 0 20 40 60 80 ∆Θ [K] 20 40 60 80 100 150 SPURT 8, JUL 2003 0 20 40 60 80 -60 -40 -20 0 20 40 60 80 ∆Θ [K] SPURT 1, NOV 2001 0 20 40 60 80 -60 -40 -20 0 20 40 60 80 ∆Θ [K] SPURT 2, JAN 2002 0 20 40 60 80 -60 -40 -20 0 20 40 60 80 ∆Θ [K] SPURT 3, MAY 2002 0 20 40 60 80 equivalent latitude -60 -40 -20 0 20 40 60 80 ∆Θ [K] SPURT 4, AUG 2002 0 20 40 60 80 -60 -40 -20 0 20 40 60 80 ∆Θ [K] SPURT 5, OCT 2002 0 20 40 60 80 -60 -40 -20 0 20 40 60 80 ∆Θ [K] SPURT 6, FEB 2003 0 20 40 60 80 -60 -40 -20 0 20 40 60 80 ∆Θ [K] SPURT 7, APR 2003 0 20 40 60 80 equivalent latitude -60 -40 -20 0 20 40 60 80 ∆Θ [K] SPURT 8, JUL 2003
Fig. 8. Tropospheric fraction of CO relative to the respective isentropic tropopause CO-value in Fig. 7 as a function of equivalent latitude
1.7.2001 1.1.2002 1.7.2002 1.1.2003 1.7.2003 time 365 370 375 380 (a) 385 CO 2 [ppmv] 40 K - 60 K 1.7.2001 1.1.2002 1.7.2002 1.1.2003 1.7.2003 time 365 370 375 380 385 CO 2 [ppmv] 20 K - 40 K 1.7.2001 1.1.2002 1.7.2002 1.1.2003 1.7.2003 time 365 370 375 380 385 CO 2 [ppmv] 0 K - 20 K 1.7.2001 1.1.2002 1.7.2002 1.1.2003 1.7.2003 time 365 370 375 380 385 CO 2 [ppmv] -20 K - 0 K 1.7.2001 1.1.2002 1.7.2002 1.1.2003 1.7.2003 time 365 370 375 380 (b) 385 CO 2 [ppmv] 360 K - 380 K 1.7.2001 1.1.2002 1.7.2002 1.1.2003 1.7.2003 time 365 370 375 380 385 CO 2 [ppmv] 340 K - 360 K 1.7.2001 1.1.2002 1.7.2002 1.1.2003 1.7.2003 time 365 370 375 380 385 CO 2 [ppmv] 320 K - 340 K 1.7.2001 1.1.2002 1.7.2002 1.1.2003 1.7.2003 time 365 370 375 380 385 CO 2 [ppmv] 300 K - 320 K
Fig. 9. (a) CO2as a function of time and 12 above the local tropopause. The phase shift at 12 > 20 K is evident. (b) CO2 on isentropic surfaces. Note the local maximum in summer on the highest isentropic surface of 2 = 360 K and the negative vertical CO2gradient in August 2002.
During the rest of the year a rather homogenous layer struc-ture was found rarely exceeding 12 = 20 K. Note, that in case of a homogenous CO-distribution on isentropic surfaces one would expect an increasing layer depth at higher φeq due to the sloping tropopause on isentropic surfaces (comp. Fig. 7). Instead, rather constant mixing layer depths in terms of 12 [K] or even increasing layer depths towards low lati-tudes are observed (SPURT 1, SPURT 4, SPURT 8). In Fig. 8 the stratospheric end points of TST-trajectories are again su-perimposed. The trajectories indeed correspond to air parcels showing an enhanced tropospheric CO-fraction. In particular during SPURT 1 and SPURT 4 COT S and TST-trajectories both indicate significant TST within the last 10 days. Note the large vertical spread of trajectory-indicated TST during summer in agreement with a higher mixing layer depths de-duced from the tropospheric CO-fraction.
A larger depth of the summer mixing layer is in agreement with the seasonal cycle found in theoretical studies (Chen, 1995; Haynes and Shuckburgh, 2000) and the
measurement-based conclusions by Hoor et al. (2002). Moreover, during summer a stronger tropospheric contribution is indicated to-wards lower equivalent latitudes, which is in close agree-ment with an additional maximum for TST near 2 = 360 K (Sprenger and Wernli, 2003). In contrast, during winter di-abatic downward transport from the overworld maximizes (Appenzeller et al., 1996; Pan et al., 2000) leading to a stronger contribution of overworld air filling the lowermost stratosphere with photochemically aged CO-depleted air dur-ing late winter/sprdur-ing.
Therefore, we conclude that only the lowest 12 = 20 K (30 K during summer) above the tropopause are influenced by TST and subsequent mixing with extratropical tropo-spheric air on time scales of days to a few weeks.
5.2 Beyond the mixing layer
Beyond the mixing layer above the tropopause, CO mix-ing ratios higher than the undisturbed stratospheric CO-equilibrium value indicate that the air cannot be regarded as purely stratospheric from a photochemical point of view. In this part of the lower stratosphere either time scales for mix-ing have to be longer, allowmix-ing CO to be photochemically processed, or the amount of tropospheric air reaching these distances from the tropopause is smaller. To address mix-ing processes exceedmix-ing the CO-lifetime we used relations between long-lived tracers like N2O with a photochemical lifetime of 100 years and CO2which is virtually inert in the lower stratosphere.
CO2with its well known tropospheric seasonal cycle pro-vides useful informations on the transit time scale and the tropospheric origin of the mixed air masses. In Fig. 9 up-per tropospheric CO2(12 = −20–0 K) shows a strong sea-sonal cycle with a springtime maximum in May 2002 and April 2003, respectively. The minimum is found during sum-mer which is in accordance with measurements of Nakazawa et al. (1991). Just above the tropopause at (12=0–20 K) the same seasonal pattern is evident which confirms the strong coupling between the lowermost stratosphere and the extra-tropical troposphere through TST and subsequent mixing in accordance with the analysis in the previous section. The dampening of the amplitude of the seasonal cycle reflects the role of the extratropical tropopause as a barrier to transport. Above 12 = 20 K the phase maximum is shifted towards summer. The delay of three months indicates a phase lag due to longer transit times for the tropospheric fraction of air, which is mixed into the lowermost stratosphere, and pos-sibly a different transport path. The observation of distinct seasonal cycles of CO2at a certain distance relative to the local tropopause is in agreement with other measurements. Ozone sonde data evaluated at the thermal tropopause and 2 km above exhibit different seasonal cycles (Logan, 1999) which illustrates the separation between the mixing layer and the lowermost stratosphere.
To investigate if isentropic mixing delayed by three months can account for the observed phase lag in the lower-most stratosphere, we evaluated the seasonal cycle of CO2on isentropic surfaces (Fig. 9b). Similar to Fig. 9a a clear phase shift is evident between 2 = 320 K and 360 K. At 2 = 340 K no distinct minima or maxima occur due to averaging the CO2seasonal cycles from the mixing layer (12<20 K) and the lower stratospheric background (12>20 K). The isen-tropic view reveals that isenisen-tropic mixing from the extratrop-ics cannot account for the observed phase signal. The CO2 -maximum which is found above 2 = 360 K in August 2002 exceeds any value which was measured during the preceed-ing campaigns in the same layer. Therefore it cannot be re-garded as a remnant of isentropic cross tropopause mixing during the previous months. Similarly, local cross isentropic transport from tropospheric altitudes (e.g. through convec-tion) cannot account for the phase maximum at the highest isentropic surfaces observed in August 2002 due to the neg-ative vertical CO2-gradient during summer.
If TST and subsequent mixing in the extratropics cannot account for the tropospheric fraction of air in the lowermost stratosphere, the air most likely entered the stratosphere at the tropical tropopause. To find a tropical signature in our data we analyzed the correlation between CO2 and N2O. Both species are long-lived enough to obey the conditions for slope equilibrium (Plumb and Ko, 1992) i.e. their iso-pleths are controlled by dynamics as opposed to photochem-istry. We evaluated the correlation for 12>45 K to exclude recent TST and mixing from the extratropics, but to have a statistically significant data base (300–1100 data points per campaign). Following Hintsa et al. (1999) we applied a lin-ear fit to the reduced N2O-CO2-relationship and extrapolated the tropospheric end member of CO2assuming a tropopause value of 317 ppbv for N2O (WMO, 2003). The applied fit method accounts for the uncertainties in both measurements (Press et al., 1999) and returns the standard deviation of the parameters.
Figure 10 displays the deduced tropospheric CO2 end members for the SPURT-camapaigns as well as the average of the surface data of Samoa and Mauna Loa (Keeling and Whorf, 2003). We found that a backward timeshift of 2.5 months gave the best agreement between the extrapolated tropical SPURT CO2tropopause values and the averaged sur-face cycles. Andrews et al. (1999) showed that at 2 = 390 K the maximum of the seasonal cycle occurs in early July in agreement with observations of Boering et al. (1996) who used a delay of two months for the propagation of the sur-face signal to these altitudes. Since the phase maximum oc-curs around mid June in the tropical troposphere (Nakazawa et al., 1991; Matsueda and Inoue, 1996) the air most likely entered the tropical stratosphere at 2 = 380 K between mid June and the beginning of July resulting in a horizontal trans-port time to high latitudes of about one month which is in close agreement with Boering et al. (1996).
1.1.2001 1.7.2001 time 1.1.2002 1.7.2002 1.1.2003 366 368 370 372 374 376 378 380 CO 2 [ppmv] SPURT 1 SPURT 2 NOV JAN MAY SPURT 3 SPURT 4 AUG SPURT 5 OCT FEB SPURT 6 APR SPURT 7
Fig. 10. Tropical CO2surface data and tropical tropopause CO2 -data deduced from SPURT shifted backward in time by 2.5 months (dark blue), light blue: time of measurement. Error bars are deduced from the error of the fit parameters of the N2O-CO2 -correlation for 12>45 K (details see text).
The large error bar for the summer campaign is the result of a data base of only 300 points and a large scatter of the data resulting in a poor correlation coefficient. For the spring mis-sions in May 2002 (SPURT 3) and April 2003 (SPURT 7), respectively, a time lag of 2.5 months is too short to match the tropical seasonal cycle. The extrapolated CO2tropopause values from SPURT indicate a longer transient time since tro-pospheric entry. Most likely the springtime lowermost strato-sphere carries a larger contribution of aged air from higher altitudes which descended from 2>380 K. The net down-ward mass transport across the 380 K isentropic surface max-imizes during winter (Appenzeller et al., 1996) leading to an increasing fraction of photochemically aged air in late winter and spring in the lowermost stratosphere. Thus, the contribu-tion of air masses with a longer transit time since last contact with the tropical tropopause is larger than during the rest of the year.
Ray et al. (1999) stated that the lowermost stratosphere is more strongly influenced by air descending from above
2>380 K during springtime than at the end of summer. Our
results show a similar pattern, however we can identify a significant contribution of air originating from the tropical tropopause in the extratropical lowermost stratosphere. Ray et al. (1999) addressed the tropospheric influence in their data to mixing across the extratropical tropopause. However, this transport pathway cannot explain the propagation of the sea-sonal CO2-cycle on different isentropic surfaces which is ob-served during SPURT.
Therefore, we conclude that the lowermost stratosphere above 12 = 30 K is significantly affected by tropo-spheric air, that entered the stratosphere at the tropical tropopause. According to Rosenlof et al. (1997) these air masses are partly transported quasi horizontally to mid-and high latitudes within 2–4 months where they mix with
photochemically aged air which diabatically descends from the overworld. Grewe et al. (2002) calculated transport timescales of not more than 1.5 months for tropical tro-pospheric air being transported to the extratropical lower-most stratosphere. In agreement with observations Andrews et al. (2001) found, that stratospheric CO2time series (for N2O>255 ppbv) are represented best by bimodal age spec-tra. For N2O>275 ppbv the younger peak indicates a mean transit time of only several weeks. The aforementioned stud-ies reveal that a significant amount of air that enters the stratosphere at the tropical tropopause is transported quasi-horizontally within a few weeks to months to higher lat-itudes. Diabatic descent (Appenzeller et al., 1996) from
2>380 K leads to the observed tropical contribution of air in
the lowermost stratospheric background far from the extrat-ropical tropopause. Closer to the extratextrat-ropical tropopause the phase shift of CO2 between 12<0 K and 12>20 K suggests, that TST and mixing in the extratropics dominates over the diabatically descending tropical tropospheric frac-tion of air.
6 Conclusions
The extensive data set obtained during the SPURT missions facilitated a broad overview of the seasonal distribution of trace gases over Europe. The CO distribution in the lower-most stratosphere indicates the existence of a mixing layer which establishes above the local tropopause. The mixing layer exhibits trace gas signatures being characteristic for a mixture of young tropospheric and stratospheric air. The depth of the layer exhibits a weak seasonal cycle showing the largest elevation of 12 =30 K above the local tropopause in summer and 20–25 K during the rest of the year. The sea-sonal cycle of CO2in the mixing layer shows the same phase as in the troposphere illustrating the strong coupling between both regions. Within the lowermost stratosphere the influ-ence of TST and subsequent mixing decreases with distance from the local tropopause in both vertical and horizontal di-rection resulting in a mixing layer which closely follows the local tropopause. Based on ER-2 measurements of CO and O3Pan et al. (2003)1suggested the extratropical tropopause can be viewed as a layer characterized by intermediate tracer mixing ratios due to rapid and shallow exchange (Stohl et al., 2003). Similar conclusions based on trajectory calculations have been drawn from James et al. (2003) showing that layers of the same age are a function of distance to the tropopause and not of isentropic surfaces in agreement with the observed CO isopleths during SPURT.
At larger distances from the local tropopause the CO2 phase lag as well as CO values exceeding the stratospheric 1Pan, L., Randel, W., Browell, E., Gary, B., Mahoney, M., and Hintsa, E.: Definitions and sharpness of the extratropical tropopause: A trace gas perspective, submitted to J. Geophys. Res., 2003.
steady state mixing ratio both indicate tropospheric influ-ence, but on different transient- and mixing time scales. From the relationship between CO2 and N2O and tropical surface data we could determine an average transport time of 2.5 months from the tropics to the extratropical lower-most stratosphere above 2 = 370 K. Due to the strong down-welling in the extratropics during winter the contribution of overworld air is enhanced in accordance with Ray et al. (1999).
Acknowledgements. Without the excellent support by the company
GFD (Gesellschaft f¨ur Flugzieldarstellung) in cooperation with the company enviscope in operating the Lear Jet the whole SPURT project would not have been possible. We are grateful to the German Ministry for Education and Research for financial support within the AFO-2000 programme and to the Swiss National Fond. Edited by: A. Stohl
References
Andrews, A. E., Boering, K. A., Wofsy, S. C., Daube, B. C., Hintsa, E. J., Weinstock, E. M., and Bui, T. P.: Empirical age spectra for the lower tropical stratosphere from in situ observations of CO2: Implications for stratospheric transport, J. Geophys. Res., 104, 26 581–26 595, 1999.
Andrews, A. E., Boering, K. A., Wofsy, S. C., Daube, B. C., Jones, D. B., Alex, S., Loewenstein, M., Podolske, J. R., and Strahan, S. E.: Empirical age spectra for the midlatitude lower strato-sphere from in-situ observations of CO2: Quantitative evidence for a subtropical “barrier” to horizontal transport, J. Geophys. Res., 106, 10 257–10 274, 2001.
Appenzeller, C., Holton, J. R., and Rosenlof, K. H.: Seasonal vari-ation of mass transport across the tropopause, J. Geophys. Res., 101, 15 071–15 078, 1996.
Bethan, S., Vaughan, G., and Reid, S. J.: A comparison of ozone and thermal tropopause heights and the impact of tropopause def-inition on quantifying the ozone content of the tropopause, Q. J. R. Meteorol. Soc., 122, 929–944, 1996.
Boering, K. A., Wofsy, S. C., Daube, B. C., Schneider, J. R., Loewenstein, M., Podolske, J. R., and Conway, T. J.: Strato-spheric mean ages and transport rates from observations of CO2 and N2O, Science, 274, 1340–1343, 1996.
Chen, P.: Isentropic cross tropopause mas exchange in the extrat-ropics, J. Geophys. Res., 100, 16 661–16 673, 1995.
Danielsen, E. F.: Stratospheric-tropospheric exchange based upon radioactivity, ozone, and potential vorticity, J. Atmos. Sci., 25, 502–518, 1968.
Dessler, A. E., Hintsa, E. J., Weinstock, E. M., Anderson, J. G., and Chan, K. R.: Mechanism controlling water vapor in the lower stratosphere: A tale of two stratospheres, J. Geophys. Res., 100, 23 167–23 172, 1995.
Emmons, L. K., Hauglustaine, D. A., M¨uller, J.-F., Carrol, M. A., Brasseur, G. P., Brunner, D., Staehelin, J., Thour´et, V., and Marenco, A.: Data composites of airborne observations of tropo-spheric ozone and its precursors, J. Geophys. Res., 105, 20 497– 20 538, 2000.
Fischer, H., Wienhold, F. G., Hoor, P., Bujok, O., Schiller, C., Siegmund, P., Ambaum, M., Scheeren, H. A., and Lelieveld, J.: Tracer correlations in the northern high latitude lowermost strato-sphere: Influence of cross-tropopause mass exchange, Geophys. Res. Lett., 27, 97–100, 2000.
Fischer, H., de Reus, M., Traub, M., Williams, J., Lelieveld, J., de Gouw, J., Warneke, C., Schlager, H., Minikin, A., Scheele, R., and Siegmund, P.: Deep convective injection of boundary layer air into the lowermost stratosphere at midlatitudes, Atmos. Chem. Phys., 3, 739–745, 2003,
SRef-ID: 1680-7324/acp/2003-3-739.
Flocke, F., Herman, R. L., Salawitch, R. J., Atlas, E., Webster, C. R., Schauffler, S. M., Lueb, R. A., May, R. D., Moyer, E. J., Rosenlof, K. H., Scott, D. C., Blake, D. R., and Bui, T. P.: An examination of chemistry and transport processes in the tropical lower stratosphere using observations of long-lived and short-lived compounds obtained during STRAT and POLARIS, J. Geo-phys. Res., 104, 26 625–26 642, 1999.
Grewe, V., Reithmeier, C., and Shindell, D. T.: Dynamic-chemical coupling of the upper troposphere and lower stratosphere region, Chemosphere: Global Change Science, 47, 851–861, 2002. Haynes, P. and Shuckburgh, E.: Effective diffusivity as a diagnostic
of atmospheric transport, 2., Troposphere and lower stratosphere, J. Geophys. Res., 105, 22 795–22 810, 2000.
Hegglin, M. I., Brunner, D., Wernli, H., Schwierz, C., Martius, O., Krebsbach, M., Schiller, C., Spelten, N., Hoor, P., Fischer, H., Parchatka, U., Weers, U., Staehelin, J., and Peter, T.: Tracing troposphere to stratosphere transport within a mid-latitude deep convective system, Atmos. Chem. Phys. Discuss., 105, 22 795– 22 810, 2003.
Herman, R. L., Webster, C. R., May, R. D., Scott, D. C., Hu, H., Moyer, E. J., Wennberg, P. O., Hanisco, T. F., Lanzendorf, E. J., Salawitch, R. J., Yung, Y. L., Margitan, J. J., and Bui, T. P.: Measurements of CO in the upper troposphere and lower stratosphere, Chemosphere: Global Change Science, 1, 173– 183, 1999.
Hintsa, E. J., Boering, K. A., Weinstock, E. M., Anderson, J. G., Gary, B. L., Pfister, L., Daube, B. C., Wofsy, S. C., Loewen-stein, M., Podolske, J. R., Margitan, J. J., and Bui, T. P.: Troposphere-to-stratosphere transport in the lowermost strato-sphere from measurements of H2O, CO2, N2O and O3, Geophys. Res. Lett., 25, 2655–2658, 1999.
Hoerling, M. P., Schaack, T. K., and Lenzen, A. J.: Global objective tropopause analysis, Mon. Weather Rev., 119, 1816–1831, 1991. Holton, J. R., Haynes, P. H., McIntyre, M. E., Douglass, A. R., Rood, R. B., and Pfister, L.: Stratosphere-troposphere exchange, Rev. Geoph., 33, 403–439, 1995.
Hoor, P., Fischer, H., Lange, L., Lelieveld, J., and Brun-ner, D.: Seasonal variations of a mixing layer in the low-ermost stratosphere as identified by the CO-O3 correlation from in situ measurements, J. Geophys. Res., 107, 4044, doi:10.1029/2000JD000 289, 2002.
Hoskins, B. J.: Towards a PV-2-view of the general circulation, Tellus, Ser. A/B, 43, 27–35, 1991.
James, P., Stohl, A., Forster, C., Eckhardt, S., Seibert, P., and Frank, A.: A 15-year climatology of stratosphere-troposphere exchange with a Lagrangian particle dispersion model: 1. Methodology and validation, J. Geophys. Res., 108, doi:10.1029/2002JD002 637, 2003.
Keeling, C. D. and Whorf, T. P.: Atmospheric CO2records from sites in the SIO air sampling network, Carbon Dioxide Infor-mation Analysis Center, Oak Ridge National Laboratory, U.S. Department of Energy, Oak Ridge, Tenn., USA, 2003.
Kormann, R., Fischer, H., Gurk, C., Helleis, F., Kl¨upfel, T., Kowal-ski, K., K¨onigstedt, R., Parchatka, U., and Wagner, V.: Appli-cation of a multi-laser tunable diode laser absorption spectrom-eter for atmospheric trace gas measurements at sub-ppbv levels, Spectrochim. Acta A, 58, 2489–2498, 2002.
Kritz, M. A., Rosner, S. W., Danielsen, E. F., and Selkirk, H. B.: Air mass origins and troposphere to stratosphere exchange associated with mid-latitude cyclogenesis and tropopause folding inferred from7Be measurements, J. Geophys. Res., 96, 17 405–17 414, 1991.
Lacis, A. A., Wuebbles, D. J., and Logan, J. A.: Radiative forc-ing of climate by changes in the vertical distribution of ozone, J. Geophys. Res., 95, 9971–9981, 1990.
Logan, J. A.: An analysis of ozonesonde data for the troposphere: Recommendations for testing 3-D models and development of a gridded climatology for tropospheric ozone, J. Geophys. Res., 104, 16 115–16 149, 1999.
Matsueda, H. and Inoue, H.: Measurements of atmospheric CO2 and CH4using a commercial airliner from 1993 to 1994, Atmos. Environ., 30, 1647–1655, 1996.
Nakazawa, T., Miyashita, K., Aoki, S., and Tanaka, M.: Tempo-ral and spatial variations of upper tropospheric and lower strato-spheric carbon dioxide, Tellus, 43B, 106–117, 1991.
Pan, L., Hintsa, E., Stone, E., Weinstock, E., and Randel, W.: The seasonal cycle of water vapor and saturation vapor mixing ra-tio in the extratropical lowermost stratosphere, J. Geophys. Res., 105, 26 519–26 530, 2000.
Plumb, R. A. and Ko, M. K. W.: Interrelationships between mixing ratios of long-lived stratospheric constituents, J. Geophys. Res., 97, 10 145–10 156, 1992.
Poulida, O., Dickerson, R. R., and Heymsfield, A.: Stratosphere-troposphere exchange in a mid latitude mesoscale convective complex, 1. Observations, J. Geophys. Res., 101, 6823–6836, 1996.
Press, W. H., Vetterling, W., Teukolsky, S., and Flannery, B.: Nu-merical recipes in Fortran 77: The art of scientific computing, Cambridge University Press, 2 edn., 1999.
Ray, E. A., Moore, F. L., Elkins, J. W., Dutton, G. S., Fahey, D. W., V¨omel, H., Oltmans, S. J., and Rosenlof, K. H.: Transport into the Northern Hemisphere lowermost stratosphere revealed by in situ tracer measurements, J. Geophys. Res., 104, 26 565–26 580, 1999.
Rosenlof, K. H., Tuck, A. F., Kelly, K. K., Russel, J. M., and Mc-Cormick, M. P.: Hemispheric asymmetries in water vapor and inferences about transport in the lower stratosphere, J. Geophys. Res., 102, 13 213–13 234, 1997.
Shapiro, M. A.: Turbulent mixing within tropopause folds as a mechanism for the exchange of chemical constituents between the stratosphere and troposphere, J. Atmos. Sci., 37, 994–1004, 1980.
Sprenger, M. and Wernli, H.: A northern hemispheric climatology of cross-tropopause exchange for the ERA15 time period (1979– 1993), J. Geophys. Res., 108, doi:10.1029/2002JD002 636, 2003.