HAL Id: inserm-02958175
https://www.hal.inserm.fr/inserm-02958175
Submitted on 5 Oct 2020
HAL is a multi-disciplinary open access
archive for the deposit and dissemination of
sci-entific research documents, whether they are
pub-lished or not. The documents may come from
teaching and research institutions in France or
abroad, or from public or private research centers.
L’archive ouverte pluridisciplinaire HAL, est
destinée au dépôt et à la diffusion de documents
scientifiques de niveau recherche, publiés ou non,
émanant des établissements d’enseignement et de
recherche français ou étrangers, des laboratoires
publics ou privés.
rhabdomyosarcoma unravels disease heterogeneity and
AKT sensitivity
Gabriele Manzella, Leonie Schreck, Willemijn Breunis, Jan Molenaar, Hans
Merks, Frederic Barr, Wenyue Sun, Michaela Römmele, Luduo Zhang, Joelle
Tchinda, et al.
To cite this version:
Gabriele Manzella, Leonie Schreck, Willemijn Breunis, Jan Molenaar, Hans Merks, et al..
Pheno-typic profiling with a living biobank of primary rhabdomyosarcoma unravels disease heterogeneity
and AKT sensitivity. Nature Communications, Nature Publishing Group, 2020, 11 (1), pp.4629.
�10.1038/s41467-020-18388-7�. �inserm-02958175�
Phenotypic pro
filing with a living biobank of
primary rhabdomyosarcoma unravels disease
heterogeneity and AKT sensitivity
Gabriele Manzella
1
, Leonie D. Schreck
1
, Willemijn B. Breunis
1,2
, Jan Molenaar
2
, Hans Merks
2
, Frederic G. Barr
3
,
Wenyue Sun
3
, Michaela Römmele
1
, Luduo Zhang
1
, Joelle Tchinda
1
, Quy A. Ngo
1
, Peter Bode
4
,
Olivier Delattre
5
, Didier Surdez
5
, Bharat Rekhi
6
, Felix K. Niggli
1
, Beat W. Schäfer
1,7
✉
&
Marco Wachtel
1,7
Cancer therapy is currently shifting from broadly used cytotoxic drugs to patient-speci
fic
precision therapies. Druggable driver oncogenes, identi
fied by molecular analyses, are
pre-sent in only a subset of patients. Functional pro
filing of primary tumor cells could circumvent
these limitations, but suitable platforms are unavailable for most cancer entities. Here, we
describe an in vitro drug pro
filing platform for rhabdomyosarcoma (RMS), using a living
biobank composed of twenty RMS patient-derived xenografts (PDX) for high-throughput
drug testing. Optimized in vitro conditions preserve phenotypic and molecular characteristics
of primary PDX cells and are compatible with propagation of cells directly isolated from
patient tumors. Besides a heterogeneous spectrum of responses of largely patient-speci
fic
vulnerabilities, profiling with a large drug library reveals a strong sensitivity towards AKT
inhibitors in a subgroup of RMS. Overall, our study highlights the feasibility of in vitro drug
profiling of primary RMS for patient-specific treatment selection in a co-clinical setting.
https://doi.org/10.1038/s41467-020-18388-7
OPEN
1University Children’s Hospital, Department of Oncology and Children’s Research Center, Steinwiesstrasse 75, CH-8032 Zurich, Switzerland.2Princess
Máxima Center for Pediatric Oncology, Uppsalalaan 8, 3584 CT Utrecht, The Netherlands.3Laboratory of Pathology, Center for Cancer Research, National Cancer Institute, Bethesda, MD 20892, USA.4University Hospital Zurich, Institute of Surgical Pathology, Schmelzbergstrasse 12, CH-8091
Zurich, Switzerland.5France INSERM U830, Équipe Labellisé LNCC, PSL Université, SIREDO Oncology Centre, Institut Curie, Paris, France.6Tata Memorial
Hospital, Department of Pathology, Dr E.B. road, Parel, Mumbai 400012, India.7These authors contributed equally: Beat W. Schäfer, Marco Wachtel. ✉email:beat.schaefer@kispi.uzh.ch
123456789
W
hile cancer treatment improved dramatically during
the past decades and nowadays allows cures for many
previously fatal cases, in a significant number of
patients therapy still fails. An important reason for this variability
in therapy success is inter-tumoral heterogeneity, which is a
characteristic of most if not all tumor categories. Hence, it is
generally believed that future therapeutic approaches should be
more patient-tailored and take into account the specific molecular
and cellular characteristics of the individual tumors. Along these
lines, genetic analysis is now a clinical routine for different types
of cancers and allows identification of patient-specific driver
oncogenes that serve as relevant therapeutic targets.
Unfortu-nately, genome-based drug selection is not feasible for tumors
which are driven by mutated but undruggable targets and have an
otherwise low mutational burden, a characteristic of many
pediatric sarcomas and leukemias.
An example for this class of tumors is rhabdomyosarcoma
(RMS), which is the most common soft-tissue sarcoma in
chil-dren and is composed of several histological subtypes, all having
cells with characteristics of a propensity for skeletal-muscle
dif-ferentiation. The two main histological RMS subtypes, alveolar
(ARMS) and embryonal (ERMS), are characterized by distinct
genetic alterations. Most ARMS cases are associated with specific
translocations, generating PAX3-FOXO1 or PAX7-FOXO1 fusion
transcription factors that act as the main drivers of tumorigenesis.
ERMS cases, in contrast, do not contain these translocations and
have a more heterogeneous genetic landscape. One important
subgroup is associated with mutational activation of the
RAS-pathway. Based on these molecular characteristics, RMS is
sub-classified into fusion-positive (FP-RMS) and fusion-negative
(FN-RMS) RMS. In both FP-RMS and FN-RMS, the number of driver
oncogenes that hold the potential for druggability is very low
1–3.
Despite the great progress that has been made in RMS treatment
by optimizing conventional therapies, up to 30 percent of patients
still have dismal outcome and no targeted therapy has entered
into clinical practice so far
4. This situation highlights the unmet
medical need to address alternative routes that aid cancer-drug
treatment decisions.
An alternative option for identification of drugs effective
against mutationally quiet tumors is direct and unbiased testing
of compounds on freshly isolated, patient-derived cancer cells. In
general, patient cells can be propagated in mice as patient-derived
xenografts (PDX) or grown in vitro under suitable culture
con-ditions in 2D or 3D. While PDX models constitute an important
tool for expansion of patient-derived biopsies and, at least during
early passages, closely resemble the original tumor specimen at
the morphological and molecular level, they might not be
affordable in terms of cost and space for many laboratories and
are unsuitable for large high throughput drug testing
5,6. For large
phenotypic screenings with drug libraries, in vitro cultures of
cancer cells are more suitable. In case of leukemia as well as some
carcinoma entities such screening approaches have proven to
produce data of clinical utility
7–11. Importantly however,
opti-mized protocols for primary cancer cell cultures have been
established for only a small number of entities and not yet for
sarcoma.
Here, we set out to develop a functional predictive preclinical
toolkit which combines the use of PDX and primary cultures for
RMS. In this respect, we present the systematic development of
optimized culture conditions for PDX-derived primary RMS cells.
Importantly, we detect subtype specific demands on culture
parameters such as presence or absence of bFGF and
find that
traditional culture conditions with presence of serum have a toxic
effect on primary RMS cells, leading to the outgrowth of resistant
clones. Comprehensive molecular characterization demonstrates
that cultured cells are stable both at the genomic and genetic level
under these conditions. Additionally, by performing drug screens
we show the feasibility of our platform to pinpoint
patient-specific pharmacological vulnerabilities with a high-fidelity
pre-diction of the in vivo response and describe an AKT-inhibitor
sensitivity of specific samples. Finally, we show that established
culture conditions allow propagation and drug-profiling of cells
directly isolated from patient tumors, considerably accelerating
the procedure. Our platform therefore holds the promise to be a
valid tool for prioritizing actionable drug targets for RMS in a
clinical setting.
Results
Culture conditions for PDX-derived primary RMS cells. To set
up a cell culture system that closely preserves the phenotypic and
molecular characteristics of cells in the parental tumor, we
fol-lowed the scheme depicted in Fig.
1
a. We used a collection of 20
RMS PDX tumors (12 FN-RMS and 8 FP-RMS), either
estab-lished on our own with a success rate comparable to previous
reports
12or in one of the three collaborating institutions
(Sup-plementary Fig. 1A, B)
12. Then, we
first aimed to determine the
optimal culture conditions supporting growth of the PDX-derived
primary cells (PPCs) in vitro. At least two independent pieces
from each PDX model were re-transplanted s.c. into NSG mice
and grown up to 1 cm
3, followed by tumor isolation, dissociation
into a single cell suspension and culture in 96-well plate format.
We compared 18 different culture conditions by combining three
media (DME and F10 medium both supplemented with 10% heat
inactivated fetal bovine serum [FBS] and Neurobasal [NB]
medium supplemented with serum replacement B-27) with three
types of adhesion substrates (no coating, Matrigel and Gelatin),
each in the presence or absence of growth factors (GF) (EGF plus
bFGF). Cell viability/proliferation was determined by WST-1
assay (normally within 1-3 weeks), and cell morphology,
differ-entiation status and contamination with mouse stromal cells was
assessed by microscopy (Fig.
1
b). Differentiation was monitored
by Myosin Heavy Chain (MHC) expression (Supplementary
Fig. 1C), while mouse cells were identified by the punctate
DAPI-staining pattern of their nuclei
13(Supplementary Fig. 1C). The
analysis revealed that F-10 medium was not effective in
sup-porting PPC growth in most cases and therefore was not studied
further (Fig.
1
b and Supplementary Fig. 1D). In contrast, NB
conditions supported growth of cells from most PDX tumors,
especially in combination with an adhesion substrate, and also
exhibited the lowest percentage of mouse contamination across
the entire set of samples tested (Fig.
1
b and Supplementary
Fig. 1D). DMEM conditions typically yielded high cell viability
scores independently from the coating matrix or presence of GFs
(Fig.
1
b and Supplementary Fig. 1D). Importantly however,
morphological analysis revealed that cells in DMEM often had an
increased size and were rich in stress-fibers, suggesting that this
conditions does not support continuous proliferation.
Further-more, DMEM cultures were enriched with mouse cell
con-taminants, which completely overtook the culture in four cases
(Fig.
1
b, right panel).
Although cell differentiation was highly affected by the different
culture conditions, it remained below 10% in most of the samples
(8 out of 13 PPCs) consistent with the low fraction of terminally
differentiated cells observed in primary RMS tumors
14,15(Fig.
1
b).
Nevertheless, in a few PPCs such as SJRHB010463_X16
(PAX3-FOXO1 positive), SJRHB010468_X1C and SJRHB013757_X2
(both PAX7-FOXO1-positive), the percentage of MHC
+cells
exceeded 30% in some conditions, a phenomenon that was visible
either after short-term culture or at later passages (Fig.
1
b,
Supplementary Fig. 2A) and that highlights the inherent myogenic
differentiation potential of some RMS.
To further validate these
findings, we next compared the
long-term proliferation rate of PPCs in DMEM and NB medium.
Counting of cell numbers of 6 FP-RMS and 5 FN-RMS cultures
over a period of 1-2 months at every passage revealed that in 10
out of 11 cases (91%), NB-cultured cells continuously proliferated
with an exponential growth rate, whereas cell counts in DMEM
decreased over time starting already at passage 1 or 2 (Fig.
1
c, d
and Supplementary Fig. 2B). Only SJRHB13758_X2C cells could
easily be propagated in DMEM with a growth kinetic
indis-tinguishable from the one in NB medium, reflecting the high
take-rate and aggressiveness of this particular tumor observed
in vivo (Fig.
1
d and Supplementary Fig. 2B). Overall, this initial
test series resulted in highly efficient (17/20 PDX) generation of
PPCs and only in case of ZH002, ZH005 and
RMS-AMS007 culture establishment failed. In these latter cases we
additionally tested advanced DMEM/F12 medium containing
e
RMS-ZH004 IC-pPDX-35_XC RMS-ZH004_XCd
c
b
f
a
DMEM+FBS 0-100 100-200CELL VIABILITY (% OF DMEM-GF)
MHC+ (%) MOUSE (%) >200 0-3 3-15 >15 0-5 5-50 >50 NB+B27 Diagnosis Patient Biopsis PDX Cell viablity SJRHB13758_X1C DMEM NB F-10 UNCO AT ED GF -+ -+ -+ -+ -+ -+ -+ -+ -+ MA TRIGEL GELA TIN UNCO A T ED MA TRIGEL GELA TIN UNCO AT ED MA TRIGEL GELA TIN SJRHB010463_X16C SJRHB013759_X1C SJRHB010468_X1C SJRHB013757_G1C SJRHB13758_X2C
SJRHB013_XC RMS-ZH004_XC SJRHB012_YC SJRHB011_XC IC-pPDX-35_XC RMS-ZH003_XC IC-pPDX-29_XC RMS-AMS007_XC
SJRHB13758_X1C 1000 800 600 T umor v olume (mm 3) 400 200 1200 0 0 10 20 30 40 50 60 2–10 20 210
Log2 rel cell count (passage 5 vs passage 0) 220 SJRHB010463_X16C SJRHB013757_G1C SJRHB013759_X1C SJRHB13758_X2C SJRHB011_XC SJRHB012_YC IC-pPDX-35_XC IC-pPDX-29_XC RMS-ZH004_XC RMS-ZH003_XC
SJRHB13758_X1C SJRHB013_XC RMS-ZH004_XC SJRHB012_YC SJRHB13758_X2C SJRHB011_XC IC-pPDX-35_XC SJRHB010463_X16C SJRHB013759_X1C RMS-ZH003_XC IC-pPDX-29_XC SJRHB010468_X1C SJRHB013757_G1C RMS-AMS007_XC SJRHB13758_X1C SJRHB013_XC RMS-ZH004_XC SJRHB012_YC SJRHB13758_X2C SJRHB011_XC IC-pPDX-35_XC SJRHB010463_X16C SJRHB013759_X1C RMS-ZH003_XC IC-pPDX-29_XC SJRHB010468_X1C SJRHB013757_G1C RMS-AMS007_XC
Differentiation Mouse cells
Days 1×10⁶
1×10³
1×100
Log2 cell count
1×10⁻³ 0 10 20 30 40 1×10⁶ 3×10⁴ 3×101 1×10³
Log2 cell count
1×100
Tumor isolation
Culture condition screen Optimal culture condition Drug profie In vivo validationPDX aCGH analysis Biobanking Sequencing Days Adv.DMEM/F12 150 100 c p = 0.003 p = 0.003 Y-27632 DMEM NB (+GF) A83-01 Y-27632+A83-01 Relativ e cell viability [%] 50 0 NB 0 20 40 60 Days CDX 80
Uncoated Matrigel Gelatin
F10
DMEM
F10 F10
NB+B27 NB+B27 NB+B27 Adv DMEM Adv DMEM Adv DMEM
DMEM DMEM
60 40
Time unitl sacr
ifice (d) 100 50 0 Relativ e cell viability [%] 20 0 PDX p=0.0197 DMEM NB (+GF) p=0.0142 +GF - GF CDX (N=5) PDX (N=3) nd nd nd nd nd nd nd nd nd nd nd nd nd nd nd nd nd nd nd nd nd nd nd nd nd nd nd nd nd nd nd nd nd nd nd nd nd nd nd nd nd nd nd nd nd nd nd nd nd nd nd nd nd nd nd nd nd nd nd nd nd nd nd nd nd nd nd nd nd nd nd nd nd nd nd nd nd nd nd nd nd nd nd nd nd nd nd nd nd nd nd 1 A B C D E F G H 2345678910 11 12
ROCK and TGFβ pathway inhibitors in combination with the
additives described above. Interestingly, these conditions allowed
establishment PPCs in all these cases (Fig.
1
e).
The optimized medium conditions also allowed propagation of
PPCs as spheroids in a 3D culture system, with both size and cell
numbers in spheroids increasing over time (Supplementary
Fig. 3A, B). Immunohistochemical (IHC) characterization of
7 days old spheroids confirmed that the majority of cells was
negative for cleaved Caspase-3 and expressed RMS markers
(Myogenin and AP2β) (Supplementary Fig. 3A). Furthermore, we
detected increased levels of the hypoxia marker Glut-1 in the
center of large spheroids, indicating presence of an
oxygen-gradient from the outside towards the inside of the spheres as
expected (Supplementary Fig. 3A).
Finally, to evaluate whether in vitro culture in NB medium
affects tumorigenicity of cells in vivo, we injected 5 × 10
6RMS-ZH004 cells from in vitro cultures and dissociated parental PDX
into NSG mice. In both models the engraftment rate was 100%
and tumor growth as well as survival of tumor-bearing mice were
very similar (Fig.
1
f).
Altogether, these
findings indicate that our platform can
readily capture heterogeneity in culture requirements among
different tumors and identified NB medium in combination with
a matrix support as the optimal condition that outperforms
conventional cell line protocols.
Culture condition dependencies distinguish subgroups of
RMS. To better characterize our culture protocol, we aimed next
to unravel the role of individual media constituents in more
detail.
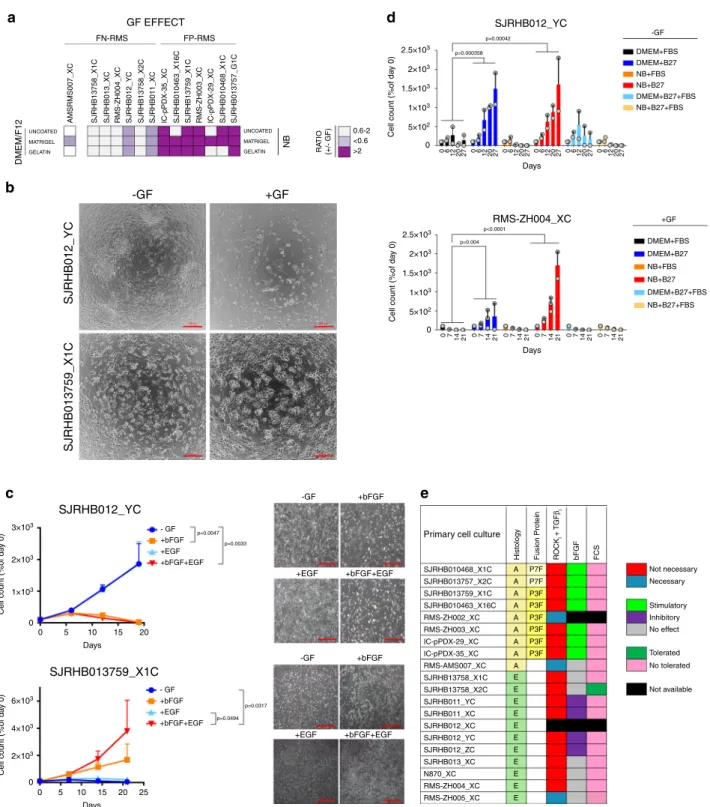
First, we assessed the contribution of GFs to cell viability and
proliferation and calculated the ratio of cell viability in presence and
absence of GFs (Fig.
2
a). Remarkably, while GFs stimulated growth of
FP-RMS, in FN-RMS they either were inert or dramatically impaired
cell viability (SJRHB012_YC, SJRHB012_ZC, SJRHB011_XC and
SJRHB011_YC), demonstrating differential GF demands among
PPCs (Fig.
2
a–c, Supplementary Figs. 1D and 4A). To identify the
responsible GF, we evaluated the proliferation rate of GF-stimulated
(SJRHB013759_X1C) and -inhibited (SJRHB011_YC, SJRHB012_YC
and SJRHB012_ZC) PPCs under all possible permutations (Fig.
2
c
and Supplementary Fig. 4B). Notably, this analysis identified bFGF as
the major player affecting proliferation (Fig.
2
c and Supplementary
Fig. 4B). Taken together, while these data confirm the well-known
role of FGF signaling pathways for RMS cell proliferation, they also
unravel a novel and unexpected anti-proliferative effect of bFGF in
some FN-RMS.
Second, we aimed to determine the component(s) in the DMEM
mixture which are detrimental to cell growth by measuring
proliferation of four PPCs in both DMEM or NB-based media
supplemented with either B-27, FBS or the combination of both
(Fig.
2
d and Supplementary 4C,D). This revealed that FBS limited
cell growth in all PPC cultures irrespective of medium (Fig.
2
d and
Supplementary Fig. 4C, D).
Importantly, in DMEM cultures of two tumors (SJRHB012_YC
and SJRHB012_ZC) we observed outgrowth of a few clones in
DMEM medium (DMEM_clones), which then could be
propa-gated to confluent monolayers within 1-2 months
(Supplemen-tary Fig. 4E, F). When transplanted into mice, both NB cultured
cells and the DMEM clones were tumorigenic. Though the NB
cultured cells and DMEM clones displayed similar growth
kinetics with no significant differences in animal survival for
SJRHB012_YC cells (Supplementary Fig. 4G), the DMEM clones
from SJRHB012_ZC showed a more heterogeneous in vivo
growth pattern and tumorigenic behavior than the corresponding
NB cultured cells (Supplementary Fig. 4H). Thus, cells cultured in
DMEM require a selection and/or adaptation process to re-gain
proliferation which is not always homogenous in vivo.
Overall, this analysis identifies a difference in response to FGF
pathway activation between FN- and FP-RMS and also implicates
serum as an adverse component for PPC long-term proliferation
(Fig.
2
e).
Molecular and histological characterization of PDXs and PPCs.
To assess whether our culture conditions exert a clonal selection
pressure
16, we performed an in-depth molecular analysis of all
matched PDX tumors and PPCs. First, we compared global DNA
copy number alterations in matched PDX tumors and PPCs
(passage<11) using array-CGH (aCGH). Overall, we detected a
high level of concordance between PDXs and PPCs (Fig.
3
a and
Supplementary Fig. 5). Nevertheless, in accordance with previous
studies, we also noticed some focal differences in DNA copy
numbers between PDX and corresponding PPCs which were
more pronounced in DMEM-derived clones (Fig.
3
a).
Next, we analyzed the mutational landscape in PDXs and
corresponding PPCs by exome sequencing. If available, we also
compared data from PDX and PPC with patient germline data.
This comparison confirmed that all somatic mutations identified
in the PDX are also present in matched PPCs (Fig.
3
b). The
mutations found in our cohort reflect the common mutational
spectrum of RMS. In FN-RMS we detected recurrent mutations in
the RAS pathway, including FGFR4, NRAS and HRAS mutations,
and TP53. Importantly, we also detected a close relationship
Fig. 1 2D and 3D culture platform of PPCs. a Workflow used to set up a RMS pre-clinical drug profiling platform. Briefly, PDXs were established from small RMS biopsies andfirst enzymatically dissociated to derive PPCs, followed by a culture condition screen (see text). DNA-sequencing and aCGH analysis were performed on both PDXs and paired PPCs to generate a sample collection with annotated genomic information. Finally, a high-throughput drug screen was conducted on each PPC cultivated under optimal culture conditions and top drug candidates were further validated in vivo on the original PDXs. b Culture optimization of indicated PPCs. Heat map depicting cell viability scores (n = 2–5 biological replicates), differentiation status (n = 2–3 biological replicates) and quantification of contamination with mouse stroma cells (n = 2–3 biological replicates) after short-term culture (1–3 weeks) of PPCs is shown. nd, not determined due to either low number of surviving cells or high fraction of cell loss during washing steps.c Growth curves of indicated PPCs cultured in DMEM on uncoated plates (black line) or in NB+ GF on matrigel (red line). Cell number was normalized to day of seeding and is expressed in a log2 scale. (Mean ± range;n = 2 biological replicates). d Graph summarizing the proliferation rate of 11 PPCs under optimal and standard DMEM conditions. Data express the percentage of cells after 5 passages relative to day 0 in a log2 scale (n = 2–3 biological replicates). The dotted line indicates the cell number at day 0.e, left panel, Viability of the human cell fraction in PPCs from RMS-AMS007 PDXs cultured under indicated conditions (Mean ± range;n = 2 biological replicates). e, right panel, Viability of PPCs from RMS-AMS007 cultured in indicated media supplemented with ROCK- (Y-27632) and/or TGFβ- (A83-01) inhibitors (Mean ± sd; n = 3 biological replicates; two-way ANOVA with Tukey’s multiple comparisons test). f, left panel, Tumor growth kinetics of RMS-ZH004 PDX (blue,n = 3 biological replicates) and passage 4 CDX (green, n = 5 biological replicates). (Mean ± sem). f, right panel, Histogram indicating the day (d) of sacrifice of individual CDX- and PDX-bearing mice (gray dots) when tumors reached ~1000 mm3. (Mean ± sd;
SJRHB13758_X1C
AMSRMS007_XC SJRHB013_XC RMS-ZH004_XC SJRHB012_YC SJRHB13758_X2C SJRHB011_XC IC-pPDX-35_XC SJRHB010463_X16C SJRHB13759_X1C RMS-ZH003_XC IC-pPDX-29_XC SJRHB010468_X1C SJRHB013757_G1C
UNCOATED MATRIGEL GELATIN UNCOATED MATRIGEL GELATIN DMEM/F12 NB RA TIO (+/- GF) 0.6-2 <0.6 >2 2.5×10³ FN-RMS FP-RMS GF EFFECT DMEM+FBS -GF DMEM+B27 NB+FBS NB+B27 DMEM+B27+FBS NB+B27+FBS 2×10³ 1×10³ 1.5×10³
Cell count (%of da
y 0) 5×10² 0 2.5×10³ 2×10³ 1×10³ 1.5×10³
Cell count (%of da
y 0) 5×10² 0 Days 0 6 12 20 27 0 612 20 27 0 612 20 27 0 612 20 27 0 612 20 27 0 612 20 27 p=0.00042 p=0.000358 SJRHB012_YC p<0.0001 p=0.004 Days 0 7 14 21 0 7 14 21 0 7 14 21 0 7 14 21 0 7 14 21 0 7 14 21 DMEM+FBS +GF DMEM+B27 NB+FBS NB+B27 DMEM+B27+FBS NB+B27+FBS RMS-ZH004_XC -GF SJRHB012_YC SJRHB013759_X1C SJRHB012_YC SJRHB013759_X1C +GF 3×10³ 2×10³ 1×10³
Cell count (%of da
y 0) 0 Days 0 5 10 15 20 Days 0 5 10 15 25 - GF +bFGF +EGF +bFGF+EGF 20 6×10³ 4×10³ 2×10³
Cell count (%of da
y 0) 0 p=0.0494 p=0.0317 p=0.0033 p=0.0047 - GF +bFGF +EGF +bFGF+EGF -GF +bFGF
Primary cell culture
Histology Fusion Protein RO
C Ki + TGF βi bFGF FCS +EGF +bFGF+EGF -GF +bFGF +EGF +bFGF+EGF SJRHB13758_X1C SJRHB13758_X2C SJRHB013759_X1C SJRHB010463_X16C SJRHB011_YC SJRHB012_YC SJRHB012_ZC SJRHB013_XC N870_XC SJRHB011_XC SJRHB012_XC RMS-ZH002_XC RMS-ZH003_XC IC-pPDX-29_XC IC-pPDX-35_XC RMS-AMS007_XC RMS-ZH004_XC RMS-ZH005_XC SJRHB010468_X1C A P7F Not necessary Necessary Stimulatory Inhibitory No effect No tolerated Not available Tolerated P7F P3F P3F P3F P3F P3F P3F A A A A A A A A E E E E E E E E E E E SJRHB013757_X2C
a
d
b
c
e
Fig. 2 Culture condition dependencies distinguish subgroups of RMS. a Heat map displaying the ratio of cell viability scores (as calculated from data shown in Fig.1b and corrected for mouse contamination) in presence and absence of GFs (+/- GF) for FN-RMS (left) and FP-RMS (right) PPCs. Light and dark purple colors indicate a negative and positive influence of the GF on cell viability, respectively. White color represents a range of negligible effect. b Representative bright-field images of indicated cells at passage 1 cultivated with or without GF stimulation. Scale bar, 200 μm. c Assessment of GF dependency for long-term proliferation of GF-inhibited (SJRHB012_YC, upper panel) and GF-stimulated (SJRHB013759_X1C, lower panel) cells. Each data point is expressed as percentage of day 0. (Mean ± range;n = 2 biological replicates; two-way ANOVA with Tukey’s multiple comparisons test). c, right panel, Representative light-microscopy images of the respective cells taken at passage 2. 100X magnification. d Histograms displaying cell counts over time for two PPC lines (RMS-ZH004_XC, SJRHB012_YC) cultivated under indicated conditions. -GF and+GF indicate the absence and presence of growth factors in the culture, respectively. (Mean ± range; RMS-ZH004_XC 0-14 daysn = 3 biological replicates, RMS-ZH004_XC 21 days and SJRHB012_YC, n = 2 biological replicates; two-way ANOVA with Dunnett’s multiple comparison test). e Heat map summarizing growth conditions found to be optimal for indicated PPCs. NB, NB medium supplemented with 2xB27, Adv.DMEM/F12, Adv.DMEM/F12 medium supplemented with 0.75xB27, Y-27632, A83-01 and N-acetylcysteine. Source data are provided as source datafile.
between the mutational status of TP53 and the cellular response
to idasanutlin, a MDM2-P53 interaction antagonist
(Supplemen-tary Fig. 6A), suggesting that increasing P53 protein levels in cells
with non-mutant TP53 remains an attractive therapeutic strategy.
In FP-RMS the number of detected somatic SNVs was generally
much lower. Expression of PAX3/7-FOXO1 fusion proteins was
validated in all FP-RMS cultures by Western blot (Supplementary
Fig. 6B). We then used the genewise target coverage of the exome
seq data to identify focally amplified genes and matched the
findings with the aCGH data. We detected amplifications of
MYC (one FN-RMS) and MYCN (one FP-RMS) (Fig.
3
b and
Supplementary Table. 1).
SJRHB013759_X1C IC-pPDX-35_XC IC-pPDX-35 SJRHB013759_X1 SJRHB13758_X2 SJRHB012_Z RMS-ZH004 PDX NB_R TC PDX NB_R TC 1 2 3 4 5 6 7 8 9 # Chromosome 10 1112 131415 1617 18 19 20 2122 X Yd
b
c
a
1 2 3 4 5 6 7 8 9 # Chromosome 10 11 12 1314151617 18 19 20 2122X Y 1 2 3 4 5 6 7 8 9 # ChromosomeTranscription Ras pathway Cwll Death / Cell
cycle Other P3F SJRHB011_X EP C P C P C P C P C P C P C P C P C P C P C P C P C P C P C E ERMS ARMS PDX Cultured ells FP PPC 15 0 –15 –30 –15 0 PC1 15 30 PC2 FP PDX FN PPC FP PDX FP cell line FN cell line Additional FP PDX Additional FN PDX Gene Fusion
Copy Number Amplfication (>10 fold) Data not available
Somatic nonsynonymous SNV
Homozygous nonsynonymous SNV-germline data not available Homozygous nonsynonymous SNV-germline data not available
A P C P C E E E E E E E E A A A A A A A SJRHB012_X SJRHB012_Y SJRHB012_Z SJRHB13758_X1 SJRHB13758_X2 SJRHB010463_X16 SJRHB013759_X1 SJRHB010468_X1 SJRHB013757_X2 SJRHB011_X C 0 200 400 600 Number of exonic SNVs 800 1000 1200 P C P C P C P C P C P C P C P C P C P C P C P C P C P C Common Unique P SJRHB012_Y SJRHB012_Z SJRHB013_X SJRHB13758_X1 SJRHB13758_X2 RMS-ZH004 N870 IC-pPDX-29 IC-pPDX-35 RMS-ZH003 N870 RMS-ZH004 SJRHB013_X
Histology Model P7F HRAS NRAS NF1 FGFR4 TP53 CDKN2A PIK3CA FBXW7 A2ML1 LRP1B SYNE1 CACNA1HMUC16 MYCN MYC
N495K N495K N2812H R81L R81L R224L R441Q R248Q R248Q F113S F113S R248Q R248Q W110X R144C R144C N2812H Q61K Q61K Q61K Q61K G13R G13R G13R G13R C176F C176F 5`-UTR 5`-UTR L993M T3514K T3514K A1312T A1312T S10968G S10968G L993M L993M L993M L993M 10 11 12 1314151617 18 19 20 2122 X Y 1 2 3 4 5 6 7 8 9 # Chromosome 10 1112 1314151617 18 19 20 2122X Y 1 2 3 4 5 6 7 8 9 # Chromosome 10 1112 13 14151617 18 19 20 2122X Y PDX NB_R TC DMEM_R T C PDX CNV CNV CNV CNV NB_R TC CLONE PDX NB_R TC R441Q P618L P618L 3 SNVs 3 SNVs D120G D120G D3061Y SJRHB013757_X2 SJRHB010468_X1 SJRHB013759_X1 RMS-ZH003 IC-pPDX-35 IC-pPDX-29 SJRHB010463_X16 CNV
We also determined the stability of the models at both the
epigenetic and genetic level. For the former we measured
methylation profiles of 15 PDX/PPC pairs and used 8 common
RMS cell lines (4 ARMS and 4 ERMS) as comparison. Principle
component analysis (PCA) revealed that in 13 out of 15 cases
PDXs and corresponding PPCs have similar methylation profiles
and only two of the PDX/PPC pairs (SJRHB013759_X1 and
IC-pPDX-35) showed a more divergent methylation pattern (Fig.
3
c).
Importantly, conventional cell lines clustered separately
display-ing much higher methylation levels at multiple sites.
To assess genetic stability we compared the number of exonic
SNVs present in PDX and PPCs, respectively. Interestingly, in
most pairs the number of SNVs was very similar (Fig.
3
d). Only
in SJRHB13758_X2C cells, we noticed a high number of unique
SNVs that were not present in the parental PDX, indicative of
genetic instability in the cultured cells.
To test whether histological RMS features are preserved in our
models, we generated s.c. xenografts with passage 4-6 PPC cells
(cell-derived xenografts; CDX) and compared their histological
character-istics with the PDX and original patient tumors, if available. Tumor
sections were assessed for cell and tissue morphology by
haematox-ylin and eosin (H&E) staining and for presence of cells with skeletal
muscle differentiation by immunohistochemical detection of
DES-MIN and MYOGENIN. Impressively, both PDX and CDX show
characteristic RMS architecture and a degree of MYOGENIN and
DESMIN positivity, which is in line with published data showing that
number of MYOGENIN positive cells discriminates ARMS from
ERMS (Supplementary Fig. 7A, B).
Altogether, these
findings showed that PPCs are epigenetically
and genetically stable and faithfully recapitulate tumor histology
when transplanted in vivo.
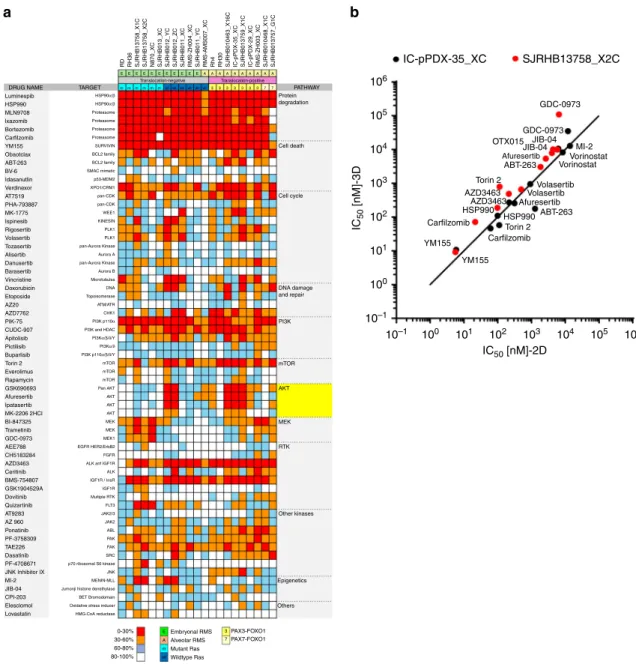
In vitro compound screen with PPCs. We next asked whether
PPC cultures would represent a suitable pre-clinical model to
unveil drug sensitivities in individual tumors. Therefore, we
applied an in vitro proof-of-concept high-throughput screen
employing a compound library containing 204 drugs which
contained both Food and Drug administration (FDA)-approved
drugs and small molecules in clinical development, covering a
range of functional classes of targets, as well as standard
che-motherapeutics used for RMS therapy (Supplementary Table 2).
A panel of 17 PPCs (10 FN-RMS and 7 FP-RMS) and four
established cell lines (FN-RMS cell lines RD and RH36 and
FP-RMS cell lines Rh4 and Rh30) were cultured in 2D and treated for
72 h with a drug concentration of 500 nM. 63/204 (∼30.9%)
decreased cell viability by more than 40% in at least one sample,
with a high concordance between biological replicates (Fig.
4
a
and Supplementary Fig. 8A). Unsupervised hierarchical clustering
using the response data revealed that FP-RMS samples cluster
together, while FN-RMS split into two branches (Supplementary
Fig. 8B), reflecting both the different genetic landscape
char-acterizing the two RMS subtypes as well as the larger
hetero-geneity of FN-RMS tumors
2. At the level of individual drugs, we
detected different response patterns. The minority of drugs
showed general toxicity including proteasome (4), HSP90 (2) and
PI3K (2) inhibitors, as well as compounds interfering with the
apoptotic machinery (YM155 and verdinexor), the dual ALK/
IGF1R inhibitor AZD3463, and the mTOR inhibitor torin 2.
Importantly however, most drugs showed more patient-specific
activity patterns. Among them, both AKT and MEK inhibitors
exhibited selective sensitivities (Fig.
4
a). As proof-of-principle for
reproducibility of our discovery drug platform we generated
dose-response curves for several compounds anticipated to have either
a general (verdinexor and YM155) or specific (ponatinib,
dovi-tinib, ABT-263 and AZ20) effect and found agreement with the
predicted cell viability scores (Supplementary Fig. 9A).
To test whether drug responses differ between 2D and 3D
culture conditions, we compared the sensitivity of
IC-pPDX-35_XC and SJRHB13758_X2C cells cultured as monolayer and as
spheroids towards a selection of 12 drugs covering a broad range
of half-maximal inhibitory concentration (IC
50) values.
Impor-tantly, IC
50values of the different drugs were very similar in the
two culture systems (Fig.
4
B and Supplementary Fig. 9B),
suggesting that drug response is not relevantly different in 2D
and 3D cultures.
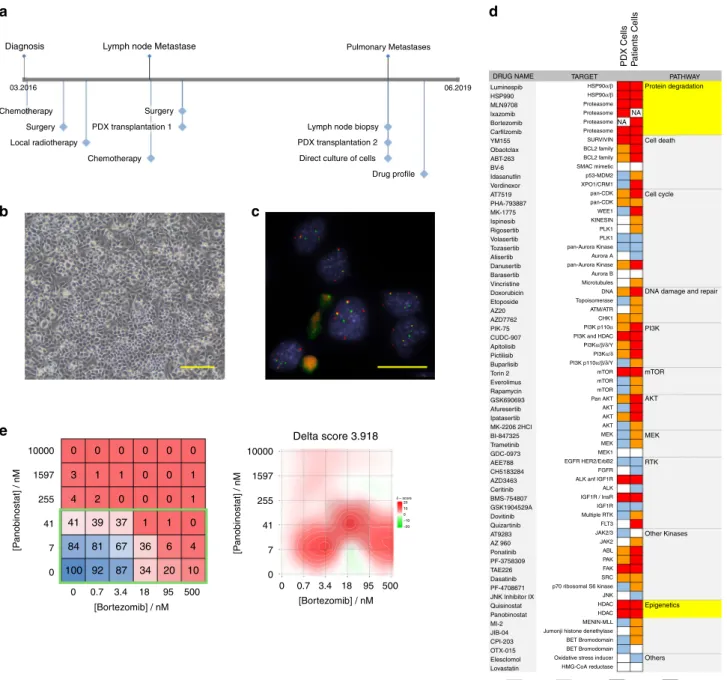
Direct culture of RMS patient cells. To move our platform
towards a co-clinical situation, we next aimed to culture cells
directly from patient tumor biopsies. For this, we isolated cells
from a lymph node biopsy removed from FP-RMS patient
RMS-ZH002 at the second relapse stage (Fig.
5
a). Cultures of these cells
established in NB medium supplemented with B27 and bFGF
revealed to contain only tumor cells as determined by DNA
fluorescent in-situ hybridization using probes detecting the
FOXO1 translocation (50 out of 50 cells positive for two copies of
rearranged FOXO1) (Fig.
5
b, c). We therefore performed a drug
profiling as described above, using a slightly larger drug library
containing 250 drugs (Fig.
5
d). Cells from the PDX generated
from the
first relapse were used as comparison. Among the
identified effective drugs were several proteasome and HDAC
inhibitors. Consequently, we validated the effects of the
protea-some inhibitor Bortezomib and the inhibitor Panabinostat alone
and in combination. The combinatorial treatment matrix revealed
IC
50values of 26 and 10 nM for Panobinostat and Bortezomib,
respectively, and showed a synergistic effect of the two drugs at
clinically relevant doses (Fig.
5
e).
Taken together, this data demonstrates that the PPC drug
profiling platform is compatible with cells directly isolated from
patient tumors and allows detection of relevant patient-specific
vulnerabilities in a reasonable time frame in a co-clinical setting.
AKT is a potential therapeutic target in a subgroup of RMS. Of
particular interest among the responses detected by the drug
profiling were the individual sensitivities towards AKT and MEK
inhibitors. Correlation analysis further underscored the high
degree of overlap among different AKTi and MEKi, suggesting
on-target activities of these compounds (Supplementary Fig. 9C).
Fig. 3 Genomic and proteomic characterization of paired PDX and PPC samples. a Copy-number variant (CNV) analysis of PDXs and corresponding PPCs (passage <11). Red arrows indicate detected copy number changes between PDX and PPC for samples where both DMEM- and NB-derived cultures were available.b Comparison of the mutational landscape of PDXs and corresponding PPCs. The table depicts all confirmed somatic SNVs in cases with available matched germline sequencing data. For samples without available germline data, comparison to dbSNP and 1000 g databases was used to identify potential non-synonymous SNVs in the same genes. Focal amplifications refer to genes with more than 10 gene copies. c Principal component analysis comparing DNA methylation profiles of RMS PDXs, PPCs and cell lines. DNA methylation data for 15 RMS PDX and PPC pairs, 9 additional PDXs and 10 cell lines were analyzed using the top 5000 most varied DNA methylation probes across all samples. Samples were indicated as color coded dots. Red and pink denote FP PDXs and corresponding PPCs respectively; blue and brown, FN PDX and corresponding PPCs; yellow and green, additional FP and FN PDXs; orange and purple, FP and FN cell lines.d Number of exonic SNVs in PDX and PPC model. P, PDX, C, PPC.
Remarkably, we could discriminate three subgroups in our PPC
panel: Two groups are responsive to either AKT or ERK
inhibi-tion and a third group is refractory to both (Fig.
6
a). Interestingly,
drug responses could not be predicted by the genetic profile, and
sensitive cases included both FP- and FN-RMS. In contrast,
inhibition of downstream mTOR by torin-2 showed a more
uniform toxicity (Supplementary Fig. 9D).
In order to study the interplay between the two pathways, we
next treated eight PPC cultures with a combination matrix of
afuresertib and trametinib to block both AKT and MEK,
respectively. Calculation of BLISS scores to evaluate synergism
revealed a synergistic behavior of the two drugs in all but one of
the cases, which was especially evident for the RAS mutant ERMS,
with BLISS scores of 10-20 (Fig.
6
b and Supplementary Fig. 10A).
IC
50values for trametinib alone differed nearly 2 logs among four
RAS mutant cases (Fig.
6
c), with more sensitive cases responding
uniformly with cell death, while in the most resistant case
(SJRHB13758_X2C) up to 30 percent of the cells differentiated
(Supplementary Fig. 10B, C). IC
50of the most sensitive cases
(IC
50< 10 nM) were in the range of therapeutically applicable
concentrations. The same was the case for afuresertib (IC
50< 281
nM) and a second AKT inhibitor (GSK690693) for the most
sensitive PPCs (Fig.
6
d). Western blot analysis in sensitive
(IC-pPDX-35_XC) and resistant (RMS-ZH004_XC) cases confirmed
that afuresertib selectively inhibited phosphorylation of S6
Ribosomal Protein and released a negative feedback loop on
AKT phosphorylation similar to previous reports
17(Fig.
6
e and
Supplementary Fig. 11A). We also observed a strong increase in
number of
floating cells as well as cleaved Caspase 3/PARP
specifically in sensitive cells (Supplementary Fig. 11B), indicating
that these cells die upon treatment.
Next, to explore the reliability of our pre-clinical in vitro platform
for prioritizing compounds, we tested the response to afuresertib
in vivo. For this, PDX from a sensitive (IC-pPDX-35_X) and a
DRUG NAME Luminespib HSP90α/β EEEEEEEEEEEAAAAAAAAAA TARGET HSP90α/β Proteasome Proteasome Proteasome Proteasome SURVIVIN BCL2 family BCL2 family SMAC mimetic p53-MDM2 XPO1/CRM1 pan-CDK pan-CDK WEE1 KINESIN PLK1 PLK1 pan-Aurora Kinase pan-Aurora Kinase Aurora A Aurora B Microtubules DNA Topoisomerase ATM/ATR CHK1 PI3K p110α PI3Kα/β/δ/Y PI3Kα/δ PI3K p110α/β/δ/Y mTOR mTOR mTOR Pan AKT AKT AKT AKT MEK MEK MEK1 EGFR HER2/ErbB2 FGFR ALK anf IGF1R
IGF1R / InsR IGF1R Multiple RTK FLT3 JAK2/3 JAK2 ABL PAK FAK SRC p70 ribosomal S6 kinase JNK MENIN-MLL BET Bromodomain Oxidative stress inducer HMG-CoA reductase
0-30% 30-60% 60-80% 80-100%
Jumonji histone denethylase ALK PI3K and HDAC
HSP990 MLN9708 lxazomib Bortezomib Carfilzomib YM155 Obaotclax ABT-263 BV-6 Idasanutlin Verdinexor AT7519 PHA-793887 MK-1775 Ispinesib Rigosertib Volasertib Tozasertib Alisertib Danusertib Barasertib Vincristine Doxorubicin Etoposide AZ20 AZD7762 PIK-75 CUDC-907 Apitolisib Pictilisib Buparlisib Torin 2 Everolimus Rapamycin GSK690693 Afuresertib Ipatasertib MK-2206 2HCI BI-847325 Trametinib GDC-0973 AEE788 CH5183284 AZD3463 Ceritinib BMS-754807 GSK1904529A Dovitinib Quizartinib AT9283 AZ 960 Ponatinib PF-3758309 TAE226 Dasatinib PF-4708671 JNK Inhibitor IX MI-2 JIB-04 CPI-203 Elesclomol Lovastatin
SJRHB013_XC SJRHB012_YC SJRHB012_ZC SJRHB011_XC RMS-ZH004_XC SJRHB011_YC RMS-AMS007_XC Rh4 RH30 RMS-ZH003_XC RD RH36 SJRHB13758_X1C SJRHB13758_X2C N870_XC SJRHB010463_X16C IC-pPDX-35_XC SJRHB013759_X1C IC-pPDX-29_XC SJRHB010468_X1C SJRHB013757_G1C mmmmmmwt Translocation-negative Translocation-positive PATHWAY 10 6 105 104 106 105 104 103 103 IC 50 [nM]-3D IC50 [nM]-2D IC-pPDX-35_XC SJRHB13758_X2C GDC-0973 GDC-0973 JIB-04 JIB-04 ABT-263 Torin 2 AZD3463 AZD3463 HSP990 Carfilzomib YM155 YM155 Carfilzomib Torin 2 HSP990ABT-263 Volasertib Volasertib VorinostatVorinostat MI-2 Afuresertib Afuresertib OTX015 102 102 101 101 100 100 10–1 10–1 Protein degradation Cell death Cell cycle DNA damage and repair PI3K mTOR AKT MEK RTK Other kinases Epigenetics Others wtwtwtwtwt3 33 33 33 77
a
b
EEmbryonal RMS 3 7 PAX3-FOXO1 PAX7-FOXO1 Alveolar RMS Mutant Ras Wildtype Ras A m wtFig. 4 2D and 3D in vitro drug profiling of PPCs. a Heat map depicting the activity of indicated agents used at a final concentration of 500 nM across the panel of RMS cells. Histological subtype, fusion status andRAS mutation status are shown above each column. Each color in the heat map indicates the percentage of remaining cell viability after treatment relative to vehicle control: 0–30% (red), 30–60% (orange), 60–79% (light blue) and >79% (white) (Mean;n = 2 biological replicates). b Correlation plot comparing IC50values for indicated drugs determined in 2D and 3D cultures of IC-pPDX-35 and SJRHB13758_X2C cells. (Mean;n = 2–3 biological replicates). Source data are provided as source data file.
resistant (RMS-ZH004_X) patient were treated with afuresertib for
at least three consecutive treatment cycles. Strikingly, growth of the
RMS-ZH004_X tumor (Fig.
6
f, lower panel) was not altered unlike
the strong response observed for IC-pPDX-35_X PDX, which
showed stable disease within the
first three weeks of treatment
(Fig.
6
f, upper panel). Consequently, sensitive but not resistant
tumor-bearing mice lived significantly longer than control groups
with a difference in median survival of ~19 days (Fig.
6
f, right
panels). Western Blot analysis using tumor extracts after short-term
in vivo treatment (7 days) proved on-target activity of the drug
(Supplementary Fig. 11C) whereas the levels of phosphorylated S6
ribosomal protein consistently increased upon prolonged therapy,
consistent with the late-stage tumor re-growth following the strong
initial response to the drug (Supplementary Fig. 10D).
In order to further validate the combinatorial effects of AKT
and MEK inhibition in vivo, we treated IC-pPDX-35_X
tumors with the combination of afuresertib and trametinib
using low doses of both drugs. Similar to the in vitro results,
we also detected a synergistic behavior of the two drugs in vivo
(Fig.
6
g).
255 1597 10000 41 7 0 95 500 0.7 3.4 18 [P anobinostat] / nM 255 1597 10000Diagnosis Lymph node Metastase
03.2016 06.2019 Chemotherapy Chemotherapy Surgery Local radiotherapy PDX transplantation 1 PDX transplantation 2 Lymph node biopsy
Pulmonary Metastases
Direct culture of cells Drug profile Surgery 41 7 0 [P anobinostat] / nM [Bortezomib] / nM 0 95 500 0.7 3.4 18 [Bortezomib] / nM 0 Delta score 3.918
e
b
a
d
c
DRUG NAME TARGET
PDX Cells Patients Cells
PATHWAY Protein degradation NA NA Cell death Cell cycle
DNA damage and repair PI3K mTOR Luminespib HSP990 MLN9708 lxazomib Bortezomib Carfilzomib YM155 Obaotclax ABT-263 BV-6 Idasanutlin Verdinexor AT7519 PHA-793887 MK-1775 Ispinesib Rigosertib Volasertib Tozasertib Alisertib Danusertib Barasertib Vincristine Doxorubicin Etoposide AZ20 AZD7762 PIK-75 CUDC-907 Apitolisib Pictilisib Buparlisib Torin 2 Everolimus Rapamycin GSK690693 Afuresertib Ipatasertib MK-2206 2HCI BI-847325 Trametinib GDC-0973 AEE788 CH5183284 AZD3463 Ceritinib BMS-754807 GSK1904529A Dovitinib Quizartinib AT9283 AZ 960 Ponatinib PF-3758309 TAE226 Dasatinib PF-4708671 JNK Inhibitor IX Quisinostat Panobinostat MI-2 JIB-04 OTX-015 CPI-203 Elesclomol Lovastatin 0-30% 30-60% 60-80% 80-100% HSP90α/β HSP90α/β Proteasome Proteasome Proteasome Proteasome SURVIVIN BCL2 family BCL2 family SMAC mimetic p53-MDM2 XPO1/CRM1 pan-CDK pan-CDK WEE1 KINESIN PLK1 PLK1 pan-Aurora Kinase pan-Aurora Kinase Aurora A Aurora B Microtubules DNA Topoisomerase ATM/ATR CHK1 PI3K p110α PI3Kα/β/δ/Y PI3Kα/δ PI3K p110α/β/δ/Y mTOR mTOR mTOR Pan AKT AKT AKT AKT AKT MEK RTK Other Kinases Epigenetics Others MEK MEK MEK1 EGFR HER2/ErbB2 FGFR ALK anf IGF1R IGF1R / InsR IGF1R Multiple RTK FLT3 JAK2/3 JAK2 ABL PAK FAK SRC JNK HDAC HDAC MENIN-MLL BET Bromodomain BET Bromodomain Oxidative stress inducer HMG-CoA reductase Jumonji histone denethylase p70 ribosomal S6 kinase ALK PI3K and HDAC
0 0 0 0 0 0 3 1 1 0 0 1 4 2 0 0 0 1 41 39 37 1 1 0 84 81 67 36 6 4 100 92 87 34 20 10 δ – score 20 10 0 –10 –20
Fig. 5 Direct culture of RMS patient cells for drug profiling and therapy guidance. a Scheme depicting the clinical course of patient RMS-ZH002. b Bright-field image of cells isolated from the lymph node biopsy of patient RMS-ZH002. Scale bar 400 μm. The displayed image is representative of n = 1 individual cell isolation.c Fluorescence in situ hybridization detection of theFOXO1 gene using probes binding to genomic sites N- (red) and C-terminal (green) of the gene. The displayed image is representative ofn = 1 fluorescence in situ hybridization experiment. d Heat map depicting the activity of indicated agents used at afinal concentration of 500 nM on cells isolated from PDX RMS-ZH002 and on cells isolated from the lymph node biopsy. Each color in the heat map indicates the percentage of remaining cell viability after treatment relative to vehicle control: 0–30% (red), 30–60% (orange), 60–79% (light blue) and >79% (white). e, left panel Heat map depicting effect of panobinostat and bortezomib alone and in combinations on viability of RMS-ZH002 patient cells isolated from the lymph node biopsy (Mean;n = 2 biological replicates). Clinically applicable concentrations of the two drugs are framed with a green box. Right panel, Heat map depicting synergism between panobinostat and bortezomib using zero interaction potency model analysis. Source data are provided as source datafile.
In conclusion, we describe a functional and reliable
proof-of-concept drug profiling platform that allowed to identify a novel
subgroup of AKTi sensitive RMS that could not be revealed by
genomic-based predictions. These
findings highlight the
suit-ability of our platform to identify functional signaling
dependen-cies in RMS.
Discussion
In the present study we have established a biobank of
PDX-derived primary rhabdomyosarcoma cultures using optimized
serum-free culture methods that preserves niche factor
require-ments, patient-specific genomic alterations, proliferative capacity
and tumorigenic ability.
c
Afuresertib_AKTiBI-847325_MEKi
Cell viability (% of control)
LO
W
HIGH
AKTi sensitivity MEKi sensitivity
SJRHB013757_G1C 100 80 60 40 20 0 BLISS score 25 20 15 10 5 0 SJRHB011_XC RMS-ZH004_XC SJRHB011_YC SJRHB013_YC SJRHB012_YC RMS-AMS007_XC IC-pPDX-29_XC Rh30 Rh4 SJRHB012_ZC SJRHB012_YC IC-pPDX-35_XC IC-pPDX-35_XC SJRHB013759_X1C SJRHB013759_X1C SJRHB010463_X16C SJRHB010463_X16C SJRHB13758_X2C SJRHB13758_X1CSJRHB13758_X2C RD Rh36 SJRHB013_XC RMS-ZH003_XC SJRHB13758_X1C SJRHB010468_X1C N870_XC N870_XC
a
f
g
b
e
d
cell viability (% of control)
100 80 60 40 20 0 0 1 2 LOG [nM] of Trametinib AFURESERTIB (nM) AFURESERTIB (nM) DMSO pmTOR 289 kDa 289 kDa 32 kDa 32 kDa 37 kDa 60 kDa 60 kDa 37 kDa 60 kDa 60 kDa 37 kDa 289 kDa 60 kDa 60 kDa 60 kDa 60 kDa 32 kDa 32 kDa 37 kDa Total mTOR pS6 Rb prot. Total S6 Rb prot. GAPDH pAKT T308 Total AKT GAPDH pmTOR DMSO 200 600 pAKT S473 Total AKT Total AKT pS6 Rb prot. Total S6 Rb prot. pAKT T308 GAPDH pAKT S473 Total AKT GAPDH ICpPDX-35 RMS-ZH004_XC SENSITIVE RESISTANT 200 600 3 4 SJRHB012_XC SJRHB012_YC IC-pPDX-35_XC SJRHB013759_X1C SJRHB010463_X16C SJRHB13758_X1C SJRHB13758_X2C N870_XC IC-pPDX-35_XC SJRHB010463_X16C SJRHB13758_X1C SJRHB13758_X2C RMS-ZH004_XC
cell viability (% of control)
100 80 60 40 20 0
cell viability (% of control)
140 120 100 80 60 40 20 0 0 1 2 LOG [nM] of Afuresertib 3 4 5 0 1 2 LOG [nM] of Afuresertib 3 4 5 Sur viv a l (%) 100 80 60 40 20 0 T u mor v o lume (mm 3) 800 VEHICLE AFURESERTIB p=0.001799 VEHICLE AFURESERTIB p=0.002 600 400 200 T u mor v o lume (mm 3) 1000 1200 800 600 400 200 0 80 90 100 Days 110 120 0 20 40 60 Days 80 –10 0 10 20 Days Sur viv a l (%) 100 80 60 40 20 0 –10 0 10 20 30 Days VEHICLE AFURESERTIB NS VEHICLE AFURESERTIB NS Rel. tumor v o lume [% of star t] 1000 1200 800 600 400 200 0 10 20 Days VEHICLE AFURESERTIB (20 mg/kg/day) AFURESERTIB + TRAMETINIB TRAMETINIB (0.5 mg/kg/day) p=0.00000000068
Our culture screen revealed a general difficulty to propagate
primary RMS cells in serum-containing media, consistent with
the low rate of success to establish cancer cell lines in the past
with standard culture protocols
18. Similar results have been
documented for primary glioblastoma, neuroblastoma and
ovar-ian cancer cells, suggesting that this might be a more general
phenomenon
19–21. We speculate that the multitude of
compo-nents of the serum might not properly recapitulate the
fluid that
cells are exposed to in their natural milieu
22. Accordingly, two out
of three serum-tolerant cultures in our cohort were associated
with a clonal outgrowth reminiscent of cell cultures undergoing
crisis before re-gaining a proliferative status
19,23. The selection
pressure imposed by this culture condition resulted in the
emergence of additional genetic aberrations and, in one case, even
limited the tumorigenic potential of the cultured cells. This
occurrence resembles the loss of tumorigenicity observed in
pri-mary glioblastoma cells exposed to serum
19. While future
experiments would be needed to unravel individual inhibitory
factors in serum and clarify the mechanisms of stress-induced
growth arrest, recent studies have suggested that both senescence
and differentiation can be observed
20,24.
However, apart from these similarities in cell growth, a main
finding of our study is the heterogeneity among RMS PPCs at
different levels including inherent differentiation potential, cell
culture condition demands and drug response. Regarding
dif-ferentiation potential, we found that especially the two
PAX7-FOXO1-positive PPCs, but to a lesser extent also some other
PPCs, exhibited a high myogenic differentiation potential when
cultured under appropriate conditions. This suggests that
pro-differentiation strategies might be a promising therapeutic route
in these tumors. Our data also strongly suggest that specific
culture parameters have to be developed for different sarcoma
types or even subgroups within these entities. In case of two
FP-RMS, one FN-RMS and multiple osteosarcoma, none of the 18
different conditions initially tested supported growth of cells
in vitro. Interestingly, in the three RMS cases, TGFβ pathway and
ROCK inhibition allowed in vitro propagation of the cells.
Ori-ginally, ROCK inhibitors have been found to promote survival of
stem cells in in vitro cultures
25and have become part of standard
cell culture protocols for stem cells as well as cells from
ecto-dermal origin including normal epithelia and carcinoma
26–28. At
this point it remains unclear whether culture dependencies reflect
cell/lineage of origin of tumors, a question that warrants further
investigations.
A second striking example of heterogeneity in culture
condi-tions was the influence of bFGF on proliferation of PPCs. While
it strongly induced proliferation of FP-RMS as anticipated,
unexpectedly half of the FN-RMS were strongly inhibited. A
similar observation has been described for Ewing cell lines where
it involved cell death after sustained activation of p38MAPK
29,30.
In RMS, importance of FGFR signaling for tumorigenicity has
been described in several previous studies. In FP-RMS, FGFR4 is
a target gene of the fusion proteins and therefore highly
over-expressed, while in a subset of FN-RMS the same receptor is
activated by mutation and/or amplification
31–33. Especially
mutant FGFR4 might represent a potential therapeutic target
34.
Strikingly, two of the FN-RMS samples inhibited in our cohort
(diagnostic and relapse samples from the same patient) expressed
amutant FGFR4, suggesting that the signaling downstream of
the FGFRs in RMS cells is more complex than previously
appreciated and might have anti-proliferative effects under some
circumstances.
A further level of heterogeneity was detected when analyzing
drug response. Only few drugs had a general toxic effect among
PPCs, including different proteasome inhibitors or the survivin
inhibitor YM155. For many other classes of agents however, we
detected heterogeneous patterns of responses across our set of
PPCs. This resembles very well the heterogeneity of responses
seen in the clinics towards
first-line therapies. Importantly, we
could demonstrate that drug sensitivities obtained from the
pri-mary 2D cultures accurately predict in vivo response. In this
context it is not surprising that we could not detect major
dif-ferences in drug response between monolayer and spheroid
cul-tures in vitro. It seems that the bulk of the cells responds similarly
in all three model systems (in vivo, in vitro in 2D and 3D). This
might be surprising taking into account the large efforts that are
undertaken to develop 3D model systems for drug screenings,
especially for carcinoma. However, they are in agreement with
similar 2D screening approaches, which have resulted in
identi-fication of cancer specific vulnerabilities in adult cancers
8.
Additional work will be necessary to evaluate whether 3D models
offer an additional benefit measuring drug responses in specific
cellular subpopulations, such as the tumor promoting
compart-ment in FN-RMS tumors
35–37. Taken together, heterogeneity at
Fig. 6 In vitro and in vivo validation of afuresertib and trametinib for RMS treatment. a Comparative analysis of afuresertib (AKTi, blue) and BI-847325 (MEKi, red) effects on cell viability. Data were computed from the drug screen experiments. Gray and white areas indicate the range below and above 50 percent inhibition of cell viability, respectively, which were chosen as range of high and low drug response (Mean;n = 2 biological replicates). b BLISS synergy scores from the combination treatment of indicated cells treated with a combination matrix of afuresertib and trametinib (Mean with range;n = 2 biological replicates). Scores were determined with the synergyfinder webtool. c Cell viability of indicated PPCs treated for 72 h with increasing concentrations of the MEK inhibitor trametinib.RAS mutant samples are depicted in colors, RAS wild type samples are in gray. (Mean; n = 2 biological replicates).d Cell viability of indicated PPCs treated for 72 h with increasing concentrations of the AKT inhibitors afuresertib (left panel) and GSK690693 (right panel). (RMS-ZH004_XC and IC-pPDX-35_XC, mean ± range,n = 2 biological replicates; SJRHB13758_X2C, SJRHB010463_X16C and
SJRHB013759_X1C, mean ± sd,n = 3 biological replicates). e Western blot analysis showing expression and phosporylation status of indicated proteins from PPCs treated for 2.5 h with afuresertib at 200 nM and 600 nM or DMSO as control. Both an afuresertib-sensitive (IC-pPDX-35_XC) and -resistant (RMS-ZH004_XC) case is presented. GAPDH was used as loading control. The displayed blots are representative ofn = 2 independent experiments. f, upper left panel Tumor growth of IC-pPDX-35 PDX (sensitive) treated with 100 mg/kg per day of afuresertib (green line) or vehicle control (black line). Gray color depicts treatment time frame (5 days) for four consecutive treatment cycles. (Mean ± sem;n = 6 mice; two-way ANOVA). d, Upper right panel, Kaplan–Mayer curves of mice from left panel. (Log rank (Mantel-Cox) test). f, Lower left panel, Tumor growth of RMS-ZH004 PDX (resistant) following the same treatment schedule as in the upper panel but for three consecutive cycles. (Mean ± sem;n = 6 mice; two-way ANOVA; NS, not significant). (Lower right panel) Survival curve of mice from left panel. (Log rank (Mantel-Cox) test; NS, not significant). g Tumor growth of IC-pPDX-35_XC PDX treated with vehicle controls (black line), 20 mg/kg per day of afuresertib (red line), 0.5 mg/kg per day of trametinib (dark blue line) or the combination of the two drugs (light blue line). Gray color depicts treatment time frame (5 days) for three consecutive treatment cycles. (Mean ± sem; control and afuresertib,n = 5 mice; trametinib, n = 4 mice; combination, n = 3 mice; two-way ANOVA with Tukey’s multiple comparisons test). Source data are provided as source datafile.
different levels strongly argues for a functional precision medicine
approach and might be taken into account in screening programs
using a
fixed number of models
38. Importantly,
experimental-designs using one mouse per tumor have been proposed as
approach to test a large number of different tumors in vivo in
parallel
39.
Among the most interesting drug sensitivities were
extra-ordinary patient-specific sensitivities towards AKTi and MEKi
that could not be predicted by genomic data. AKTi are currently
developed in phase I/II clinical trials for adult malignancies
40.
Despite some evidence suggesting that AKT phosphorylation
(AKT Ser473) predicts poor overall survival in RMS, little
attention has been drawn on blockade of the AKT/mTOR axis so
far
41. Our search for potential biomarkers of these drug
sensi-tivities failed to identify a close relationship between genomic
features and drug responses. Instead, our
findings indicate that
in vitro drug profiling on PPCs is predictive of the response of the
parental PDX and therefore is a suitable approach to pre-select
RMS sub-groups who may benefit from anti-AKT therapies.
Finally, we also demonstrated that the optimized culture
con-ditions allow culture of cells directly isolated from patient tumors.
Circumventing the PDX generation has the advantage that the
procedure is potentially significantly accelerated. Time until drug
profiling is of vital importance, especially in the relapse situation
when standard therapies are not effective anymore. Amount and
quality of material available for isolation of the cells is an
important parameter for this approach.
Overall, our
findings provide important groundwork for a
clinically used drug screening platform for sarcoma with the aim
to offer drug response profiling as tool for therapeutic decisions
for individual patients in the clinics.
Methods
Patient consent and sample collection. All patients gave written informed consent at the participating institutions. This includes general informed consent from TATA Memorial Hospital and patient consents from University Children’s Hospital Zurich, Emma Children’s Hospital Amsterdam and Institut Curie Paris. Orthothopic PDX models from St Jude Children’s Hospital were obtained through Childhood Solid Tumor Network42, for which patient consent has been published previously6. Fresh biopsy material from human tumors was frozen in DMEM supplemented with 10% FBS and 10% DMSO at−80 °C in a cell freezing container before shipment to the the site of transplantation took place.
PDX transplantation. For tumor amplification, pieces with a size of ~10–30 mm3
from fresh human tumor biopsis or established PDX tumors were transplanted subcutaneously into theflank of 6–10 weeks old, sex-matched NOD scid gamma (NSG) mice. Engraftment of tumors was monitored by tumor size measurements three times a week using a caliper. Tumors were isolated when they reached a size of ~1000 mm3.
For in vivo drug treatment, a single cell suspension of dissociated PDX tumors containing 0.7–5 × 10⁶cells was injected subcutaneously into theflank of sex
matched, 6–10 weeks old NSG mice. A description of the PDX lines used in this study can be found in Supplementary Fig. 1A.
Isolation of PDX cells. PDX tumors freshly isolated from mice werefirst minced using two scalpels and then incubated in a dissociation buffer composed of 200μg/ ml liberase DH (Roche, 5401054001), 0.1 mg/ml DNase I (StemCell, #07900) and 1 mM MgCl2in 1x HBSS buffer (Sigma, H6648) for 30–60 min at 37 °C. When the tumor cell suspension was pipettable through a 1 ml tip, digestion was stopped with serum containing medium and remaining tumor pieces were removed byfiltration through a 70μm cell strainer. Cell suspensions were then washed with PBS and either directly used for cell culture or frozen in freezing medium (CryoStor CS10, StemCell, #07930) for future use.
Culture of PDX cells. Media used for culture of PDX cells included DMEM (Sigma, D5671) or F10 (Life technologies, 11550-043) both supplemented with 10% heat inactivated FBS (Thermofisher Scientific), NB medium (Thermofisher Scien-tific, 21103049), supplemented with 2xB-27 (Thermofisher ScienScien-tific, 17504044), and Advanced DMEM/F12 (Thermofisher Scientific,12634010), supplemented with 1× or 2× (for drug screening) B-27, 1.25 mM N-acetyl-L-cysteine (Sigma-Aldrich, A9165), 5μM A83-01 (Tocris Bioscience, 2939), and 10 μM Y-27632 (Abmole Bioscience, M1817). All media were further supplemented with 100 U/ml
penicillin/streptomycin and 2 mM glutamax (Life technologies, 35050-061). When indicated, media were further supplemented with 20 ng/ml bFGF (PeproTech, AF-100-18B) and 20 ng/ml EGF (PeproTech, AF-100-15). Three times per week, 75% of medium was replaced with fresh one. When reaching confluency, cells were detached using Accutase (Sigma-Aldrich, A6964) and splitted in a ratio of 1:2 to 1:3.
For Matrigel-coating, Matrigel (Corning, 354234) was diluted 1:10 in NB medium and left on the dish for 30–60 min at RT. Before cell-plating, excess Matrigel solution was removed. For Gelatin-coating, a 2% solution of Gelatin (Sigma-Aldrich, G9391) in water was left on the dish for 2 h at 37 °C. The solution was then removed and the plates were dried at RT for 30–60 min.
For spheroid culture, 5000 (SJRHB13758_X2C) or 10‘000 (IC-pPDX-35_XC) cells were plated per 96 well in round bottom cell repellent plates (Greiner Bio-One, 650970) in NB medium supplemented with Matrigel (1:50). Half of the medium was changed three times a week.
Culture condition optimization. 30‘000 cells freshly isolated from PDX tumors were plated per 96 well in the different test media. When cells reached confluency in one well, representative phase contrast pictures were taken from each condition, before cell viability was measured by WST-1 assay. The same plate was then used for immunofluorescence detection of myosin heavy chain (MHC) and quantifi-cation of mouse stroma cells by DAPI staining.
Quantification of mouse cells. For quantification of mouse stroma cells con-taminating PPC cultures, cells isolated from PDX and grown under different conditions in 96 well plates were stained with DAPI. Mouse cells were then identified on microscopic images by the punctate DAPI-staining pattern of their nuclei. Relative numbers of human and mouse cells were determined on micro-scopic images containing at least 200 cells of possible.
Immunofluorescence. Immunofluorescence was performed in 96 well plates. Cells werefirst fixed with 4% paraformaldehyde for 15 min, followed by quenching with 0.1 M glycine in PBS for 5 min and permeabilization with 0.1% Triton-X 100 in PBS for 15 min. After blocking with 4% horse serum in 0.1 % Triton-X 100 in PBS, cells were incubated with primary antibody diluted in the same buffer at 4 °C over night in a humid chamber. After three washings with PBS for 5 min, cells were incubated with secondary antibody diluted in PBS with 4% horse serum for 1 h. A monoclonal anti-MHC antibody (MF 20; Developmental Studies Hybridoma Bank, Iowa) (1:500) and an Alexa 594-labeled donkey anti-mouse secondary Ab (Ther-mofisher Scientific, A11032) (1:500) were used. For nuclear staining, cells were covered with PBS containing 10μg/ml DAPI and analyzed by fluorescence microscopy.
Immunohistochemical staining of spheroids and tumor sections. 2μm sections of formalin-fixed, paraffin-embedded (FFPE) spheroids or tumor tissues were stained on the Bond automated staining system (Leica). For epitope retrievel, slides werefirst either enzymatically predigested with Ventana protease 1 for 10 min (Desmin) or heated in Epitope retrieval solution from Leica Bond system (PH9) to 100 °C for 20 min (Myogenin), 30 min (AP2b and Glu-1) or 45 min (cleaved Caspase-3). The sections were then incubated for 30 min with primary antibodies against Desmin (Novocastra Laboratories Ltd, NCL-L-DES-DERII) (1:200), Myo-genin (Cell Marque Lifescreen 296M-14Ltd) (1:100), AP2b (Santa Cruz, H-87) (1:400), cleaved Caspase-3 (Cell Signaling Technology, #9661) (1:500) and Glut-1 (Cell Marque Lifescreen Ltd., CMC35511020) (1:300). Visualization of the anti-bodies was performed with a Bond refine detection system, Leica. All sections were counterstained with haematoxylin.
Measurement of long-term proliferation of cells. Cells were cultured in parallel under optimal conditions as determined by condition screening and in conven-tional DMEM supplemented with FBS. Cell numbers were counted at each passage. Drug profiling. For drug profiling, 3000–20,000 PPCs in NB medium in most cases supplemented with bFGF and EGF were plated per 384 well coated with Matrigel or Gelatin. Only the GF-sensitive PPC (SJRHB012_YC, SJRHB012_ZC, SJRHB011_XC and SJRHB011_YC) were cultured in absence of bFGF and EGF. For drug screen in cell lines, 2000-4000 cells were seeded in NB medium supple-mented with bFGF and EGF and in absence of any substratum. The next day, medium was changed and cells were incubated with a drug library containing 204 different drugs (Selleckchem) in a concentration of 500 nM in duplicate wells for 72 h. 12 wells treated with DMSO on each plate served as controls. Cell viability was then determined by WST-1 assay (Roche, 11644807001). A list of compounds employed in this study is provided in Supplementary table 2.
Drug response curves. For IC50determination in 2D cultures, 3000–20,000 PDX cells were plated in NB medium supplemented with bFGF and EGF per 384 well (unless otherwise specified) coated with Matrigel or Gelatin. The next day, medium was changed and cells were incubated with drug in a logarithmic concentration range between 0.006–10 μM using a digital dispenser (HP D300). After 72 h cell