HAL Id: insu-00797428
https://hal-insu.archives-ouvertes.fr/insu-00797428
Submitted on 4 Mar 2021
HAL is a multi-disciplinary open access
archive for the deposit and dissemination of
sci-entific research documents, whether they are
pub-lished or not. The documents may come from
teaching and research institutions in France or
abroad, or from public or private research centers.
L’archive ouverte pluridisciplinaire HAL, est
destinée au dépôt et à la diffusion de documents
scientifiques de niveau recherche, publiés ou non,
émanant des établissements d’enseignement et de
recherche français ou étrangers, des laboratoires
publics ou privés.
Blueschist-facies metapelites from the Malpica-Tui Unit
(NW Iberian Massif): phase equilibria modelling and
H2O and Fe2O3 influence in high-pressure assemblages
A. Lopez-Carmona, Pavel Pitra, J. Abati
To cite this version:
A. Lopez-Carmona, Pavel Pitra, J. Abati.
Blueschist-facies metapelites from the Malpica-Tui
Unit (NW Iberian Massif): phase equilibria modelling and H2O and Fe2O3 influence in
high-pressure assemblages. Journal of Metamorphic Geology, Wiley-Blackwell, 2013, 31 (3), pp.263-280.
�10.1111/jmg.12018�. �insu-00797428�
Blueschist-facies metapelites from the Malpica-Tui Unit
(NW
Iberian Massif): phase equilibria modelling and H20 and Fe203
influence in high-pressure assemblages
A. LOPEZ-CARMONA, P. PITRA AND I. ABATI
ABSTRACT The Malpica-Tui Unit (Galicia, NW Spain) records eclogite- and blueschist-facies metamorphism
during the onset of the Variscan orogeny in Europe. Petrological analysis involving pseudo sections
calculated using THERMOCALC shows that the Upper Sheet of this unit, the Cean Schists, recorded a three
stage metamorphic evolution involving (i) Early subduction-related medium-pressure/low-temperature metamorphism (M!) constrained at �350-380 cC, 12-14 kbar, which is only recorded in the basal part (lower metapelites, LM) of the Cean Schists. (ii) Subduction-related blueschist facies prograde metamorphism (M,) going from �19 kbar, 420 cC to 21 kbar, 460 cC in the LM, and from 16 kbar 430 cC to 21-22 kbar, 520 cC in the structurally upper metapelites (UM). (iii) Exhumation-related metamorphism (M3) is characterized by a decompression to 8-10 kbar, 470-490 cC in the LM. This decompression is also recorded in the UM, but it was not possible to estimate precise P-T conditions. The calculations indicate that (i) the prograde evolution in subduction zones may occur in fluid undersaturated conditions due to the crystallization of lawsonite, even in metapelitic rocks. This significantly influences phase equilibria and hence the P-T estimates. (ii) The proportion of ferric iron also has a strong influence on phase equilibria, even in metapelites. However, the analysed values of Fe203 may not reflect the oxidation state during the main metamorphic evolution and are probably easily modified by superficial alteration even in apparently fresh samples. The use of P-T-X(Fe203) pseudo sections together with petrographic 0 bservations is then necessary to estimate the real oxidation
state of the rocks and correctly evaluate the P-T conditions.
Key words: blueschist-facies metapelites, H20 content, Iberian Massif, MnNCKFMASHTO, Variscan subduction
INTRODUCTION
Sinking of cold, dense lithosphere in subduction zones is the principal plate-driving force, causing orogenesis along continental margins. The descent of a relatively cold crustal slab to mantle depths leads to the fonnation of high-pressure (HP) and low-(L 1) to medium-temperature (MT) metamorphic rocks, like blueschists and eclogites, frequently found in the suture zones of orogenic belts
(e.g. Miyashiro, 1961; Ernst, 1971; Maruyama et al.,
1996). Blueschist- and eclogite-facies assemblages, as markers of fossil and active subduction zones, store much infonnation concerning processes at convergent plate boundaries, and provide important clues to the understanding of the thermal history of the evolving Earth (e.g. Ernst, 1973, 2001; Platt, 1993; Stern, 2005).
Data about the metamorphic evolution of subducted terranes, obtained through petrological analysis and thermodynamic modelling, are fundamental to geo
dynamic models and palaeogeographical reconstruc tions of the lithospheric plates. In this context, the northwest section of the Iberian Massif provides
infonnation that helps to understand the evolution of the European Variscan belt. This region comprises exotic terranes forming a huge and complex allochth onous sheet emplaced upon the sequences deposited on the passive margin of north Gondwana (Martinez
Catalin et al., 2009). They include a HP and LT MT
belt that can be discontinuously traced throughout the Variscan belt, located below several rock units with ophiolitic associations, probably having originated in
the Rheic Ocean. This HP belt is a coherent piece of
continental crust fonned by different rock units known in the NW Iberian Massif as the Basal Units (Fig. 1). The goal of this work is to analyse phase equilibria of blueschist-facies metapelites (Cean Schists) from the upper sequence of the westernmost basal unit, the Malpica Tui Unit (MTU; Fig. 1), with particular attention to the effects of H20 and Fe203' This lithology preserves the chloritoid glaucophane para
genesis (L6pez-Carmona et al., 2010), which is one
of the classic HP indicators in metapelites (e.g. Kienast
& Triboulet, 1972; Katagas, 1980; Chopin, 1981;
(a) NW 1 Km (b)
A
?'-11 Parauthocthon
Variscan granitoiGis Allochthonous ComplexesIII
Upper UnitsIII
Ophiolitic Units Basal UnitsIII Upper Sheet
Lower SheetORDENE5(2)
SE Upper Sheet (Pazo55ynform) Cean Schists_
Campre Amphiboliteso
Mylonites Lower Sheeto
orthogneisses{;J
Sample locationC
0'.00CA'm'GAL(3)
.
�
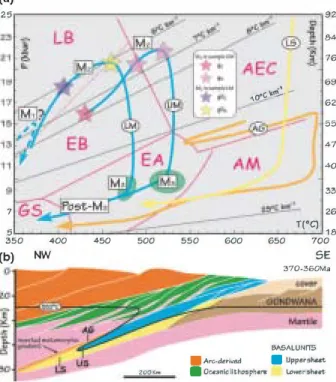
---ZY ESE 25 KmFigure 1. (a) Cross-section for the Upper Sheet (pazos Synfonn) of the Malpica Till Unit. The gradation of colours indicates the decrease in the metamorphic grade. Sample locations are indicated. Modified from Diez Fernandez (2011). (b) Geological map of the Allochthonous Complexes of the NW Iberian Massif. A B and B C correspond to cross-sections along the different units. US, upper sheet; LS, lower sheet; AG, Agualada Unit. Modified from Martinez Catahin et al. (2009).
Phase equilibria of pelitic rocks at high pressures do not attract as much attention as metabasic rocks, probably because the mineral associations are less spectacular. Yet, metapelitic rocks are common in HP terranes (e.g. Bosse et al., 2002; Wei & Pow ell, 2003 and references therein), and are suitable for con straining P T evolution. However, similar to metabasic rocks, the assemblages are sensitive to the amount of
available H20 and Fe203 (cf. Korhonen et al., 2012).
HIGH-PRESSURE ROCKS IN THE BASAL UNITS OF NW IBERIA
Pods and relicts of HP rocks, well preserved in the NW Iberian massif, with widespread distribution along the so-called Basal Units, are the best record of the Vari scan subduction of the north Gondwana margin dur ing the Late Devonian. Their petrological and structural study has constrained the P T paths and the kinematics of the subduction (e.g. Martinez Catalin
et al., 1996; Arenas et al., 1997; L6pez-Carmona et al.,
2010; Diez Fernindez et al., 2011), concluding that
Basal Units formed part of a subducting slab buried beneath Laurussia at the onset of the Variscan colli
sion (Arenas et al., 1995, 1997; Santos Zalduegui et al.,
1995; Rodriguez Aller et al., 2003; Abati et al., 2010).
They were rapidly exhumed by crustal-scale thrusting accompanied by recumbent folding and tectonic
denudation (Martinez Catalin et al., 1996, 1997; Diez
Fernandez & Martinez Catal<in, 2009; Diez Fernandez
et al., 2011). The original polarity of the subducting slab was reconstructed on the basis of the palaeo-pressures inferred from metamorphic parageneses, indicating that the subduction had a significant westward com ponent in present coordinates (Martinez Catal<in
et al., 1996). Kinematic indicators in HP fabrics are in agreement with this reconstruction, indicating top to
the northwest movement (Diez Fernandez et al.,
2012).
According to their metamorphism and tectonostra tigraphy, the Basal Units can be separated into two
sheets (Fig.
I).
In the MTU: (i) a Lower Sheet ofcontinental affinity, where felsic orthogneisses and turbiditic metasedimentary rocks predominate; and (ii) an Upper Sheet that represents a volcano-sedimentary sequence viewed as a more distal part of the same continental margin, extremely attenuated and transi tional to an oceanic domain (Rodriguez Aller, 2005). The Upper Sheet is preserved in a small synformal structure (the Pazos Synform) and is formed by a basal layer of finely foliated amphibolites and greenschists with N-MORB chemistry (Cambre Amphibolites), and an overlying sequence of pelitic schists (Cein Schists) with minor intercalations of bituminous schist, cherts and carbonates. The mafic rocks are strongly retro gressed blueschists that locally preserve lawsonite pesudomorphs dominated by epidote/clinozoisite and
paragonite (Rodriguez Aller et al., 2003; L6pez-Car
mona et al., 2010). The contact between the Upper and
the Lower Sheets is marked by a several metres thick layer of mylonites and ultramylonites located at the base of the Cambre Amphibolites (Diez Fernindez, 2011). Another layer of mylonites occurs in the middle of the Upper Sheet, within the Cein Schists, separating them in a lower and an upper part (Fig. la).
Peak metamorphic conditions in the Lower Sheet of the MTU are in the intermediate temperature eclogite
facies (Rodriguez et al., 2005), with a progressive
transition to the blueschist facies in the eastern sections of the same units in the remaining allochthonous
complexes (Martinez Catalin et al., 1996; Rubio
Pascual et al., 2002). The Upper Sheet can be consid
ered as a highly condensed metamorphic sequence with a lower part in the blueschist facies and an uppermost part without HP relicts (Fig. la). The significant dif ference in metamorphic grade between the Upper and the Lower Sheets, and between the upper and lower part of the Upper Sheet suggests that the mylonites that mark the contacts are related to extensional
deformation (L6pez-Carmona et al., 2007; Fig.
I).
Previous P-T estimates
The metamorphic evolution of the Cein Schists has been previously studied by conventional thermobarometric techniques, multiequilibrium thermobarometry (THER
MOCALC average P T) and thermodynamic modelling,
usmg pseudosections m the KFMASH and
MnNCKFMASH chemical systems (L6pez-Carmona
et al., 2010). Conventional thermobarometry calcula tions using micro inclusion compositions indicate peak conditions of � 19 22 kbar and 500°C. The same cal culations using the matrix minerals yield approximate values of 16 20 kbar and 440 515°C. P T values ob tained with the average P T multiequilibrium ther mobarometry are compatible with the conventional thermobarometry results, but show significantly lower pressures for the matrix foliation (13 14 kbar and 495 500°C). Petrological modelling in the MnNCKF MASH system provided a minimum pressure limit for the paragenesis chloritoid + glaucophane at � 17 kbar, confirming the HP stability of this assemblage.
SAMPLE DESCRIPTION AND MINERAL CHEMISTRY
The deformation in the Cein Schists is relatively het erogeneous, with irregular development of foliations and deformation phases in different domains. Their deformation history includes several compressive, extensional and strike-slip phases (Diez Fernandez
et al., 2011). However, only three of the deformation phases have a direct link with relevant metamorphic associations. Two blueschist facies defonnation phases have been identified (Dj D2), followed by the devel opment of the main foliation in blueschist-amphibolite facies conditions (D3) and an amphibolite greenschist facies overprint (POSt-D3) (Fig. 2). The fabric from the
(a) (lM)lon"lonl S,/D, SdD,is,/D, Post- (b) (UM)lon"lonl SdD, S,/D,
P,st-deformation phase , SlID, deformation phase
1;:;;==,
__+"5,,
"
,,D'-I
'
Inclusion Inclusion: tri tri
1,',c�sl°,n
matnl< matril<petrographic setting
In91 In92
, ma I< ma I< petrographic setting1-"':::"-::-:+--:-:--;---1
metamorphic eventMl: M2
:
M3
!Post-M, metamorphic eventM
2
:
M
3
!Post-M,Epidote Titanite Garnet Rutile _1� i-3-i Chloritoid -_2� ... 3"'l
_g1-+-,
g2CIR+-,
III Glaucophane"�
Lawsonite"
�
_1.... -..3
-.,
:::::::: Garnetg2
C
•
R
illl
!
, IIII! Rutile
�IIII
;
Glaucophane 'I"
l-!
Muscovite�
3�Lawsonite" II"� Paragonite _2 ... 3�
Chlori"toid
�
Imeni"te ""� Muscovite Chlorite Imenite Paragonite Biotite Na·CaAmph rur, Ap Ca-Amph Alblte '1,,;"'2'-'-3�:
: : Chlorite �3""317. ,_ Fe-oxides :: 1....-: .1"',_2...,..., 3�, 317_ ;-II�Q�u�a�rt� z�=r ==������====�
: IIII�II'�"
Ir=
! ... , , (c) rmesulodelling ts
fc:-m
LowerM-,
'
C:
M
7
�
eta=-
'
·-
=
pe-m
I=-
/W-:T:
""
:II"
UpP'" Metape-Ilte,:
(
"
.
m
"c
7
"
"
=:-
)
=
:c1
:ll1
::
r '----i
_: :11-�.-T::':::':--1F::::":=:C::::::'F::::":=:C:::=j
m��
Ml
g+chl"+ep+gl· .... +Iaw· +ru+sph g+ctd+ehl+gl +Iaw' +ru+ilm g+ctd+ehl+pa +gl" +Iaw· +ru... !:o
...
.
.
. o,:..
....:
:
�
:
::llf
6er, 6tp, carb, sui
�
Quartz +ru+ilm+l>i+pa +pa+ilm+ru
Figure 2. Diagram showing the crystalliza tion deformation relations of the Cean Schists in the lower (a) and upper metapel ites (b). (c) Summary of the modelling results showing the mineral assemblages predicted in the metamorphic events. *Inferred phases that have not been observed petrographi cally.
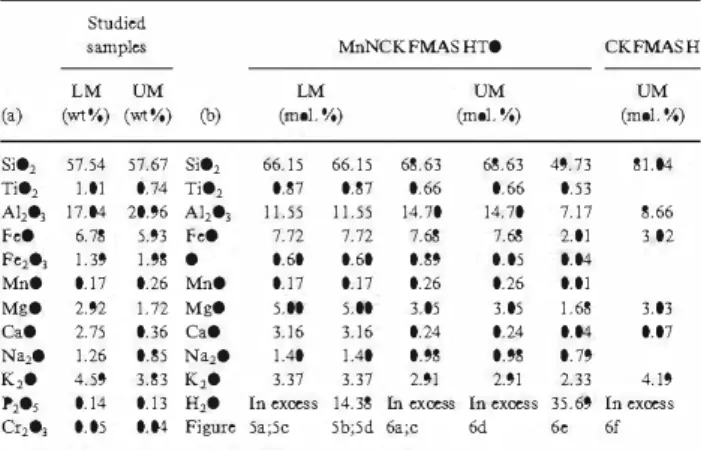
Table 1. (a) Bulk-rock composition from XRF analyses of samples LM and UM expressed in wt%. (b) Bulk-rock compo-sitions normalized with THERMOCALC expressed in mol. %. F e203(T) was measured by the XRF and F eO by wet chemical
titration. The amount Fe203 is calculated stoichiometrically as: [total iron/I.43 (FeO/l . 286)' 1.43].
Studied
samples MnNCKFMASHTO CKFMASH
tectonics. The effects of POSt-S3 defonnations associ ated with vertical folding are particularly evident in the core of the synformal structure, where an axial planar foliation S4 is usually developed, In these areas, the schists are highly altered and the main foliation consists of alternations of quartz and phyllosilicate rich layers,
LM UM LM UM UM
(.) (wt%) (wt%) (b) (mo1.%) (mo1.%) (mo1.%) Si01 57.54 57.67 Si01 66.15 66.15 68.63 68.63 49.73 81.04 Ti01 1.01 0.74 Ti01 0.87 0.87 0.66 0.66 0.53 A110j 17.04 20.96 A110j 11.55 11.55 14.70 14.70 7.17 S.66 POO 6.78 5.93 POO 7.72 7.72 7.68 7.68 2.01 3 02 Fe10j 1.39 1.98 ° 0.60 0.60 0.89 0.05 0.04 MnO 0.17 0.26 MnO 0.17 0.17 0.26 0.26 0.01 MsO 2.92 1.72 MSO 5.00 5.00 3.05 3.05 1.68 3.03 C.O 2.75 0.36 C.O 3.16 3.16 0.24 0.24 0.04 0.07 N:J.l0 1.26 0.85 N:J.l0 1.40 1.40 0.98 0.98 0.79 K,O 4.59 3.83 K,O 3.37 3.37 2.91 2.91 2.33 4.19 P105 0.14 0.13 H,O In excess 14.38 lnu= In excess 35.69 In excess
Cr10j 0.05 OC>! Figure 5a;5c 5b;5d 6a;c 6d 6. 6f
earliest deformational event (SI) is preserved exclu sively as inclusion trails in a first generation of garnet porphyroblasts. S2 is preserved in a second generation of garnet and chloritoid porphyroblasts, The matrix foliation (S3) usually obliterates the previous fabric, resulting in a composite foliation S2 + S3 and includes the pervasive development of spaced extensional shear bands and mesa-scale folds, related with a first
extensional event (Diez Fernindez et ai., 2011), Sub
sequent deformations are associated with the devel opment of late-Variscan folds (such as Pazos Synfonn, Fig, 1) and to a final superposed dextral strike-slip
The dominant rock type of the Cean series is a
typical pelite (e,g, Atherton & Brotherton, 1982),
However, to the base of the sequence, metapelitic rocks are interbedded with the Cambre Amphibolites and most samples show compositions that move away from the field of pure pelites in the direction of N-MORB, indicating either some mixing between both lithologies during primary volcano-sedimentary processes, or mechanical assimilation during the deformation. The different whole-rock chemistry between the samples selected for this study results in slightly different mineral associations (Table 1),
The Cein Schists show a medium-grained por phyro lepidoblastic texture and a well-developed pla nar to planar linear fabric (Fig, 3), White mica and quartz constitute > 50%, and locally up to 80%, of the modal proportion of each sample, The alternation of both minerals defines a banding preserved between extensional shear bands, The foliation is defined by the shape preferred orientation of phengitic muscovite, paragonite and chlorite, and is parallel to the banding, Quartz grains commonly show undulate extinction, subgrain boundaries and recrystallization to smaller grain aggregates (Fig, 3),
Two representative samples of the Cean Schists from the Upper Sheet of the MTU (Fig, 1) were studied, Sample 106340, referred to hereafter as LM
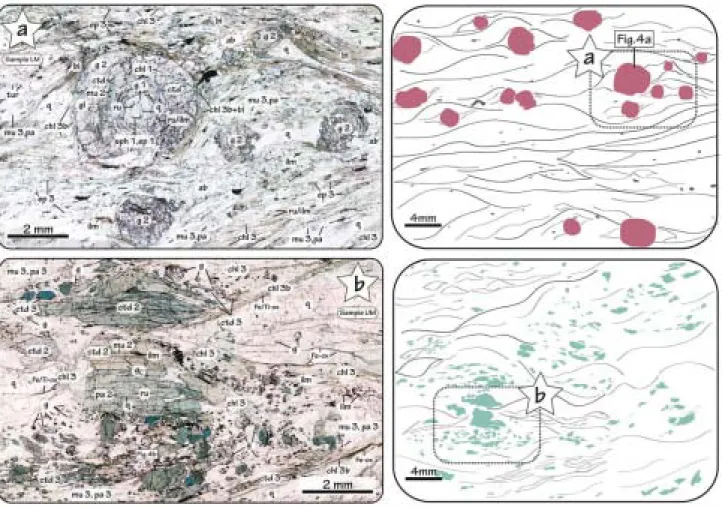
Figure 3. Microphotographs of the Cean Schists. Photomontages of thin-section images displaying the porphyro
lepidoblastic texture and the highly deformed fabrics. (a) Sample LM showing garnet porphyroblasts filled with concentric inclusions. (b) Sample UM cluster of highly pleochroic chloritoid porphyroblasts and numerous small garnets. Sample locations are indicated in Fig. 1. Mineral abbreviations are after Holland & Powell (1998). Other abbreviations: tur, tourmaline; Fe/Ti-ox, Fe/Ti-bearing oxides.
(for lower metapelites), is located at the base of the synformal structure, and interbedded within the Cambre Amphibolites. The presence of numerous garnet porphyroblasts rich in Sj and S2 inclusions makes this sample ideal to study the first subduction related deformation phases. Sample 108289, referred to hereafter as UM (for upper metapelites), is located structurally above the sample 106340, in the middle part of the synformal structure, in an upper structural domain separated from the first by a mylonitic band (Fig. la).
Mineral analyses and elemental X-ray maps have been performed with a JEOL-Superprobe JXA-8900M microprobe equipped with five spectrometers at the lCTS-National Electronic Microscopy Centre at the Complutense University of Madrid (Spain; http://
www.cnme.es). The operating parameters for punctual
analyses were 15 kV accelerating voltage, 20 nA beam
current, between 1 and 5 !ffi1 beam diameter (1 !ffi1 for
the microinclusions) and 10 s counting time. X-ray
maps were operated at 20 kV and 150 nA. Represen
tative analyses of selected minerals are listed in
Tables 2 and 3. Mineral abbreviations are those used
by THERMOCALC (Holland & Powell, 1998): albite (ab),
biotite (bi), chlorite (chI), chloritoid (ctd), clinozoisite (cz), epidote (ep), garnet (g), glaucophane (gl), ilmenite (ihn), jadeite (id), lawsonite (law), muscovite (mu),
omphacite
(0),
paragonite (pa), plagioclase (PI), quartz(q), rutile (ru) and titanite (sph). Other abbreviations: apatite (ap), barroisite (bar), carbonates (carb), Fe/Ti bearing oxides (FelTi-ox), hornblende (hb), sericite (ser), stilpnomelane (stp), sulphides (suI), tschermakite
(ts), tourmaline (tur
)
and winchite (win). Other symbols: XFJ � Fe + /(Fe2 + + Mg); XFd + �
Fe3 + /(Fe + + Al 2) (epidote); XFd + � Fe3 + /(Fe3 +
+ AI) (amphibole) XNa � Na/(Na + K) (white
mica); XNa � Na/(Na + Ca) (amphibole); AIm �
-Fe/(Fe + Mg + Ca + Mn), Prp �
Mg/(Fe + Mg + Ca + Mn), Grs � Ca/(Fe + Mg
+ Ca + Mn), Sps � Mn/(Fe + Mg + Ca + Mn);
per formula unit (pfu); weight per cent (wt%); , --7 '
denotes core-to-rim evolution, and ,*, indicates phases inferred from the petrological modelling that have not been identified petrographically.
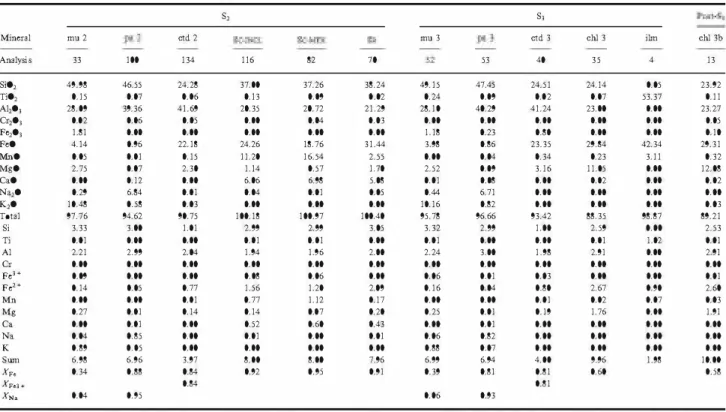
Table 2. Representative microprobe analyses from sample LM.
S, S, S,
Mineral ep 1 sph 1 g le g 1R ctd mu 2 ch1 2 g2e g2R ilm ep 3 mu 3 hi pa ch] 3 sph 3 win bar ch] 3b hb
Analysis 2 196 2 160 43 179 183 lS 18 4 13 67 11 26 17 24 85 Si01 38.13 30.46 36.98 37.36 56.79 23.81 51.29 25.93 37.47 37.92 0.05 38.04 50.92 36.54 46.70 24.61 30.16 53.96 46.75 24.52 44.94 47.23 67.25 Ti01 0.04 35.81 0.31 0.05 0.03 0.02 0.15 0.07 0.12 0.09 53.38 0.15 0.19 1.55 0.07 0.06 35.51 0.14 0.10 0.09 0.26 0.23 0.00 A110J 26.26 1.41 20.81 22.08 11.78 39.06 24.73 21.23 22.16 22.01 0.34 26.68 27.44 16.71 39.38 23.15 1.83 13.28 9.43 22.50 12.74 10.40 19.87 Cr10J 0.11 0.03 0.01 0.05 0.01 0.05 0.06 0.04 0.00 0.03 0.08 0.09 0.05 0.10 0.00 0.00 0.00 0.04 0.00 0.01 0.04 0.12 0.00 Fe10J 11.07 0.00 0.82 0.00 0.98 1.97 1.19 0.00 0.00 0.00 0.00 9.75 0.00 0.00 0.08 0.00 0.00 3.61 6.05 0.00 5.61 4.51 0.03 FeO 0.10 0.76 22.46 27.51 11.86 22.27 3.17 21.82 23.61 27.06 42.24 0.09 3.51 18.36 1.09 29.14 1.23 14.01 11.99 27.72 11.63 11.93 0.00 MnO 0.19 0.18 7.95 2.46 0.04 0.36 0.00 0.15 4.55 1.66 3.75 0.08 0.03 0.18 0.01 0.41 0.32 0.47 0.42 0.26 0.45 0.51 0.03 MgO 0.00 0.00 0.54 0.88 10.04 3.20 3.33 16.44 0.56 0.80 0.00 0.04 2.35 11.57 0.25 10.84 0.00 7.32 11.29 12.00 10.74 11.20 0.00 CaO 22.21 30.06 10.03 8.37 0.41 0.01 0.03 0.04 10.24 9.36 0.00 23.20 0.00 0.00 0.08 0.00 29.40 6.14 8.88 0.08 10.19 9.80 0.06 Na10 0.00 0.02 0.05 0.03 6.43 0.03 0.22 0.03 0.00 0.03 0.00 0.Q2 0.28 0.02 6.02 0.01 0.04 1.63 2.40 0.01 1.59 1.77 10.92 K10 0.00 0.02 0.00 0.00 0.Q2 0.00 9.73 0.02 0.00 0.01 0.01 0.Q2 10.20 9.79 2.23 0.01 0.00 0.62 0.25 0.06 0.37 0.30 0.03 Total 98.11 98.75 99.96 98.8 98.39 90.78 93.90 85.77 98.71 98.97 99.85 98.16 94.97 94.82 95.91 88.23 98.49 101.2 97.56 87.25 98.56 98.00 98.19 Si 2.99 1.01 2.97 3.00 7.81 1.00 3.48 2.74 3.00 3.03 0.00 2.98 3.42 2.79 2.99 2.63 1.25 7.42 6.88 2.63 6.54 6.88 2.98 Ti 0.00 0.90 0.02 0.00 0.00 0.00 0.01 0.01 0.01 0.01 1.01 0.01 0.01 0.09 0.00 0.00 0.00 0.01 0.01 0.01 0.03 0.03 0.00 A1 2.43 0.06 1.97 2.09 1.91 1.94 1.98 2.64 2.09 2.07 0.01 2.46 2.17 1.50 2.97 2.91 0.84 2.15 1.62 2.85 2.19 1.79 1.04 Cr 0.01 0.00 0.00 0.00 0.00 0.00 0.00 0.00 0.00 0.00 0.00 0.00 0.00 0.00 0.00 0.00 0.00 0.00 0.00 0.00 0.00 0.01 0.00 FeH Fe1'" Mu MS C. N. K S= Xc, XN. XFeJ ... 0.65 0.01 0.01 0.00 1.87 0.00 0.00 0.00 0.05 0.02 1.51 0.01 0.54 0.00 0.06 1.07 0.86 0.00 0.01 0.00 0.00 0.00 0.10 1.85 1.37 0.17 0.01 0.11 2.06 0.72 0.06 0.01 1.72 0.00 0.00 0.06 0.78 0.01 0.20 0.00 0.00 0.00 0.06 0.00 0.18 1.93 0.00 0.01 0.34 2.59 0.00 0.01 0.03 0.01 0.84 0.00 0.00 1.58 0.31 0.07 0.88 0.00 0.00 0.00 1.81 0.11 0.10 0.80 0.01 0.00 7.97 3.06 8.00 7.95 15.04 3.99 6.92 9.94 7.94 7.93 0.96 0.95 0.40 0.80 0.35 0.43 0.96 0.95 0.97 0.03 0.60 0.05 0.03 0.00 0.89 0.08 0.00 0.00 0.00 0.00 0.57 0.01 0.01 0.00 1.95 0.00 0.00 0.00 0.19 0.00 0.23 0.00 ON 0.87 0.00 1.17 0.01 1.32 0.00 0.00 0.95 0.00 0.00 0.06 2.60 0.00 0.04 0.02 1.72 0.00 0.00 0.75 0.00 0.18 0.00 0.89 0.00 0.05 O.rB 0.20 0.00 0.00 1.99 7.99 6.93 7.83 6.97 9.90 3.33 0.55 0.45 0.47 0.75 0.60 0.04 0.81 0.37 0.67 1.61 1.4S 0.06 0.05 1.50 2.45 0.91 1.38 0.44 0.68 0.11 0.05 14.58 15.26 0.52 0.38 0.32 0.33 0.15 0.29 0.00 2.49 002 192 0.01 0.00 0.01 0.61 0.49 1.42 1.45 0.06 0.06 2.33 2.43 1.59 1.52 0.45 0.50 0.Q7 0.06 0.00 0.00 0.00 0.00 0.00 0.94 0.00 9.94 15.29 15.22 4.96 0.56 0.38 0.37 0.22 0.25 0.22 0.21
C, core; R, rim. Data C:J.lcu1ated using AXsoftware (Holland &Powell, 2000 inPowell & Holland 2002 http:jwww.esc.cam.ac.ukjresearchjresearch·groupsjhollandjax). The amount of ferrlc iron was calculated from stolchiometric constraints using the programme AX (powell & Holland, 2002). For amphibole, the Fe3 + content corresponds to the average from minimum and maximum constraints (Holland & Blundy, 1994).
Table 3. Representative microprobe analyses from sample UM.
Mineral Analysis Si01 Ti01 A110J Cr10J Fe10J hO MuD MSO C.O Na10 K,O Total Si Ti A1 C, FeH Fe1'" Mu MS C. N. K S= Xc, XFeJ ... XN• mu 2 33 49.98 0.15 28.09 0.Q2 1.81 4.14 0.05 2.75 0.00 0.29 10.48 97.76 3.33 0.01 2.21 0.00 0.09 0.14 0.00 0.27 0.00 0.04 0.89 6.98 0.34 0.04 100 46.55 0.07 39.36 0.06 0.00 0.96 0.01 0.07 0.12 6.84 0.58 94.62 3.00 0.00 2.99 0.00 0.00 0.05 0.00 0.01 0.01 0.85 0.05 6.96 0.88 0.95 ctd2 134 24.28 0.06 41.69 0.05 0.00 22.18 0.15 2.30 0.00 0.01 0.03 90.75 1.01 0.00 2.04 0.00 0.00 0.77 0.01 0.14 0.00 0.00 0.00 3.97 0.84 0.84 S, 116 37.00 0.13 20.35 0.00 0.00 24.26 11.20 1.14 6.06 0.04 0.00 100.18 2.99 0.01 194 0.00 0.08 1.56 0.77 0.14 0.52 0.01 0.00 S.OO 0.92 82 37.26 0.09 20.72 0.04 0.00 18.76 16.54 0.57 6.98 0.01 0.00 100.97 2.99 0.01 1.% 0.00 0.06 1.20 1.12 0.Q7 0.60 0.00 0.00 8.00 0.95 70 38.24 002 21.29 0.03 0.00 31.44 2.55 1.70 5.08 0.05 0.00 100.40 3.05 0.00 2.00 0.00 0.00 2.CB 0.17 0.20 0.43 0.01 0.00 7.% 0.91 mu 3 49.15 0.24 28.10 0.00 1.18 3.98 0.00 2.52 0.01 044 10.16 95.78 3.32 0.01 2.24 0.00 0.06 0.16 0.00 0.25 0.00 0.06 0.88 6.99 0.39 0.06 53 47.45 O.rB 40.29 0.00 0.23 0.86 0.04 O.rB 0.08 6.71 0.82 96.66 2.99 0.00 3.00 0.00 0.01 0.04 0.00 0.01 0.01 0.82 0.07 6.94 0.81 0.93 S, ctd 3 40 24.51 0.Q2 41.24 0.00 0.80 23.35 0.34 3.16 0.00 0.00 0.00 93.42 1.00 0.00 1.98 0.00 0.03 0.80 0.01 0.19 0.00 0.00 0.00 4.00 0.81 0.81 chl 3 3 5 24.14 0.07 23.00 0.00 0.00 29.84 0.23 11.05 0.02 0.00 0.00 88.35 2.59 0.01 2.91 0.00 0.00 2.67 0.02 1.76 0.00 0.00 0.00 9.96 0.60 iOO 4 0.05 53.37 0.00 0.00 0.00 42.34 3.11 0.00 0.00 0.00 0.00 98.87 0.00 102 0.00 0.00 0.00 0.90 0.07 0.00 0.00 0.00 0.00 1.98 chl 3b 13 23.92 0.11 23.27 0.05 0.10 29.31 0.32 12.08 0.02 0.00 0.03 89.21 2.53 0.01 2.91 0.00 0.01 2.60 0.03 1.91 0.00 0.00 0.00 10.00 0.58
C, core; R, rim; INCL, inclusion in ctd 2; MTX, matrix. Data C:J.lcu1ated using AX software (Holland &Powell, 2000 in Powell & Holland 2002 http:jwww.esc.C:J.m.ac.ukjresearchjresearch· groups}hollandjax). The amount of ferrlc iron was calculated from stolchiometric constraints using the programme AX (Powell & Holland, 2002). For amphibole, the Fe3 + content corresponds to the average from minimum and maximum constraints (Holland & Blundy, 1994).
Structurally lower metapelites
Sample LM is a micaschist that contains a main foli ation (S3) defined by white mica (type 3 phengite with 3.40-3.45 Si pfu, XNa � 0.04 and paragonite, XNa � 0.81), biotite (XF' � 0.47), epidote (type 3; XF,3 + � 0.55), minor chlorite (type 3; XF, � 0.60) and quartz. The dominant Ti-bearing minerals in the
matrix are Mn-rich ilmenite (MnO = 3.7 wt%, i.e.
�9'10 pyrophanite) and titanite (type 3), which con tains up to 1.8 wt% A1203, up to 1.2 wt% FeO and up to 0.4 wt% F. S3 parageneses also include minor pro portions of bluish Ca Na amphiboles such as winchite (Si � 7.4 pfu; XNa � 0.30 0.32; XF, � 0.51 0.52)
and barroisite (Si � 6.9 pfu; XNa � 0.33 0.36;
XF, � 0.45 0.5), and relatively abundant small crys tals of dravite-rich tourmaline and apatite (Fig. 3a; Table 2).
This foliation wraps around subhedral crystals of garnet (0.5 4 mm) concentrated in the micaceous do mains of the matrix, and locally included in albite porphyroblasts. Garnet is rich in inclusions, which commonly display a concentric arrangement (Figs 3a & 4a). Locally, however, they define curved or sig moidal patterns or, more rarely, markedly rotational paths arranged as spirals (snowball garnet). Large garnet crystals display an optical zoning. The cores, referred to as garnet 1 (g
I),
usually lack fractures and contain very fine-grained inclusions « 0.06 mm) of epidote (typeI,
XF,3 + � 0.60), titanite (typeI),
rutile needles and quartz (Fig. 3a; Table 2). In general, the inclusions define a very fine foliation, SI. The outer parts of large garnet, referred to as garnet 2 (g2), are commonly fractured and rich in coarser-grained (up to 0.7 mm) inclusions of glaucophane (Si � 7.8 pfu; XNa � 0.97; XF'�O.4; XF,3 + � 0.05 0.1), chloritoid (XF' � 0.80), phengitic muscovite (type 2, Si up to 3.5 pfu) that is locally also included in chloritoid (aninclusion m an inclusion), chlorite (type 2,
XF, � 0.43), rutile (locally partly replaced by ilmen ite), ilmenite and quartz (Fig. 3a; Table 2). In most cases, these inclusions define a curved or sigmoidal foliation (S2) discordant with the external foliation, S3. The optical zoning can be correlated with the chemical zoning (Fig. 4a). Type 1 garnet core displays zoning characterized by an increase in almandine and pyrope (Alm51 --760, Prp2 --7 3) and a decrease in spessartine (Spsl8 --7 9). XF, remains constant (XF' � 0.96) and the proportion of grossular varies irregularly between 28 and 31 %. The apparent absence of zoning in garnet
I
core in Fig. 4a is caused by the profile runningslightly off the centre of the crystal; the core values were obtained by point analysis (Table 2). The garnet
I
zoned rim (Fig. 4a; profileI)
is characterized byan increase in the amount of both grossular and spessartine, compensated by the decrease of the pro portion of almandine (Grs28 --7 32, Sps9 --7 11, Ahn61 --7 55). In type 2 garnet, the rimward evolution is characterized by a decrease in grossular, spessartine
and XF, (Grs31 --7 19, Sps11 --7
I,
XF, � 0.96 --70.93), accompanied by an increase in ahnandine and pyrope (Ahn55 --7 73, Prp3 --7 6).
Finally, post-S3 minerals are locally present around garnet and are commonly composed by inter growths of chlorite (type 3b), albite and quartz. Garnet rim is nearby replaced by chlorite flakes (type 3b; XF, � 0.56). Rare bluish-green Ca-amphibole such as Fe/Mg-hornblende (Si � 6.5 6.8 pfu; XNa � 0.17 0.22; XF, � 0.51 0.38; XFd+ � 0.07 0.22) and
tschermakite (Si � 6.9 pfu; XNa � 0.24 0.25;
XF, � 0.36 0.37; XF,3 + � 0.21) grow in optical continuity on the rims of the Na Ca amphibole. Lo cally, hornblende develops large crystals (> 0.3 mm long), which are arranged parallel to type 3b chlorite (Fig. 3a; Table 2). Minor proportions of sericite, stil pnomelane, carbonates and sulphides are commonly concentrated along the extensional shear planes and in some samples a pervasive growth of albite porphyro blasts occurs.
In summary, three metamorphic stages (Ml M3) can be distinguished in the evolution of this sample (Fig. 2). Evidence for Ml is recorded by aligned inclusions (ep, ru, sph, q) in the cores of large garnet (gl) (Fig. 3a). M2 is characterized by the inclusions of ctd, chI, gl, ru, ilm, mu, q preserved in garnet 2. The third stage (M3) is recorded by the matrix foliation (S3), comprising the assemblage chl-ep-mu-pa-bi
rulihn-sph-q ± g ±winlbar (Figs 2a & 3a). Finally,
post-M3 crystallization includes post-S3 phases such as chI, hb/ts, ab, ser, stp, carb, suI.
Structurally upper metapelites
Sample UM consists essentially of quartz, white mica, chloritoid porphyroblasts and garnet. It displays layers dominated by quartz and white mica respectively. Chloritoid and garnet are concentrated in the mica ceous domains. The matrix foliation (S3) is parallel to the layering and contains quartz, muscovite (type 3, 3.06 3.08 Si pfu, XNa � 0.06), paragonite (type 3; XNa � 0.93), chlorite (type 3; XF, � 0.60), garnet
(0.1 0.4 mm in average, locally up to
I
mm), ilmenite(MnO � 3.11 wt%, i.e. �9'10 pyrophanite) and rare
elongated crystals of chloritoid (type 3; 0.5
I
mm long,XF, � 0.81 0.82). It is not clear whether these chloritoid crystals really belong to the foliation or represent reoriented crystals of an older generation of chloritoid (type 2). Small crystals of tourmaline are relatively widespread in the foliation. The foliation wraps around clusters containing abundant large stubby crystals of chloritoid (type 2; up to 4 mm long, XF, � 0.80 0.84), commonly lacking a preferred ori entation. Garnet, white mica and minor chlorite, quartz, rutile and ilmenite are also present in these clusters. Chloritoid porphyroblasts contain numerous tiny inclusions of tourmaline, rutile, phengitic musco vite (type 2; Si � 3.33 3.34 pfu, XNa � 0.04), parag onite (type 2; XNa � 0.95), garnet and locally ilmenite
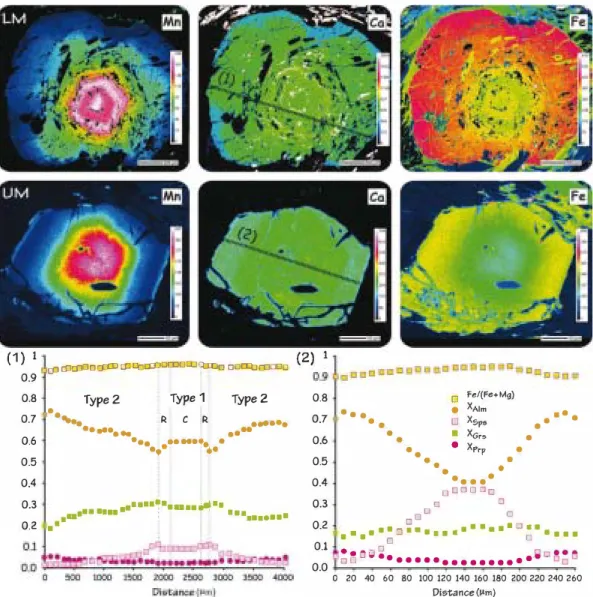
(1)
1dJ I:PDJDoca:o cPI:QcDJDCCOQJctI.oc OOCQJroODo
0.9
0.8
Type
2Type 1
Type
20.7 ... R C R ... ... . ... 0.6 0.5 0.4 -.. . ... . .. - .-0.3 ••••• • � ... . ... ' ... . 0.2 • • -"
(2)
1 0.8 o Fe/(Fe+Mg} • XA1m • •• 0.1 •• o XSPII •• • •• 0.6 0.5 0.4 0.3 0.2 •• •• • XGrto • XPrp -.. . ••••• DODODD C C o 0 • • CO • ••• 0 • •• • •••••••• 0 •••••• • • (] 0 0.1 . 0 .O�. �D··O 0.0 DD •••••••••••••••• DD o 20 40 60 80 100 120 140 160 180 ZOO 220 240 260 Distance (Ilm)Figure 4. X-Ray maps and chemical profiles illustrating zoning of garnet porphyroblasts from the Cean Schists. (a) Types 1 2 garnet from the lower metapelites (profile 1). (b) Garnet from the upper metapelites (profile 2). Tbick dashed lines on the X-ray maps indicate the position of the profiles. The location of each garnet is indicated in Fig. 3.
that define an internal foliation, S2' Garnet inclusions are euhedral and significantly smaller (0.02 0.06 mm) than the matrix crystals (Fig. 3b). Chemical zoning of garnet (Fig. 4; profile 2) is characterized, from core to rim, by a decrease in spessartine (Sps38 --7 5), balanced by an increase in ahnandine (Ahn41 --773) and pyrope
(Prp2 --7 9). XPe decreases regularly from 0.96 to 0.93.
The grossular content varies irregularly between Grs20 and Grs16, with a tendency to decrease towards the rim. Finally, an increase in spessartine (Sps5 --7 7) and
XPe (0.90 --7 0.93) is observed in the outermost rim,
together with an inversion of the general zoning pat
tern of pyrope (Prp9 --7 8) and ahnandine
(Alm73 --7 70). Garnet inclusions in chloritoid display the same type of zoning. However, the rims lack the reversal in spessartine zoning and their composition (Alm61 Prp4 Grsl8 20 Spsl8) suggests that they cor respond to the matrix crystals, the growth of which
was arrested by the inclusion in the chloritoid (type 2). Finally, post-S3 phases include tiny crystals of chlorite
(type 3b; XPe � 0.58) and Fe Ti-bearing oxides and
hydroxides concentrated along the shear planes (Figs 2b & 3b).
In summary, it is inferred that the preserved mineral assemblages correspond to the sequence of two meta morphic stages, named M2 and M3, according to their textural position. The Ml event (recorded in the LM) was not identified as inclusions in garnet cores in sample UM. This event represents the early stages of subduction, and it is not possible to infer if it was not preserved in these rocks, or if they never recorded it. Evidence for M2 is achieved by the assemblage g-ctd mu-pa-ru ± ilm. These minerals occur preserved as inclusions in garnet and in chloritoid porphyroblasts (type 2), and define the internal fabric S2. M3 corre sponds to the matrix foliation S3 and is composed of
g-chl-mu-pa-ru-ilm-q ± ctd. The post-M3 event in cludes post-S3 phases such as chlorite and Fe/Ti-oxide.
P-T ESTIMATES
Pseudosections were calculated for the P T domain of interest, between 350 and 600°C and 5 25 kbar. The diagrams have been computed using THERMOCALC
3.33 3.35 (Powell & Holland, 1988) and the internally consistent thermodynamic data set 5.5 (Holland &
Powell, 1998; updated Nov. 2003). References of the mixing models for solid solutions of the phases con sidered in the calculations are amphibole (Diener et al.,
2007), clinopyroxene (Green et al., 2007), chloritoid (Mahar et al., 1997; White et ai., 2000), chlorite (Le Bayon et al., 2006; based on Holland et al., 1998), white mica (Coggon & Holland, 2002), plagioclase (Holland & Powell, 2003), epidote (Holland & Powell, 1998), magnetite (White et al., 2002), garnet, biotite, ilmenite and hematite (White et al., 2005).
The rock slab of each sample used to make the thin section was crushed and analysed by XRF to obtain the
bulk composition. FeO
(v.
Fe203) was analysed by wetchemical titration. Phase relations were modelled in the chemical system MnO Na20 CaO K20 FeO MgO Al203 Si02 H20 Ti02 Fe203 (MnNCKFMASHTO). The original compositions of the studied rocks were simplified to fit this system (Table 1). Bulk-rock com positions indicated in brackets in figure captions are
those recalculated using THERMOCALC. The fluid phase
was fixed as pure H20, initially in excess. The diagrams are shown in Figs 5 & 6. Thick lines indicate the stability field of diagnostic phases, and the thickest semitrans parent lines represent the proposed P T paths. White fields are divariant and increasing variance is shown with progressively darker shades. Mineral abbreviations are those used by THERMOCALC (see above).
Lower metapelites
A PT pseudosection calculated in the system MnNCKFMASHTO for the analysed bulk composi tion with H20 considered in excess is presented in Fig. Sa. The stability domains corresponding to the observed relicts of mineral assemblages Ml (g, ep, sph, ru, q) and M2 (g, ctd, chI, gl, nI, ilm, mu, q) are
modelled in the HP and LT part of the pseudosec tion. However, most assemblages containing these phases are predicted to also contain lawsonite, which has not been observed either as inclusions in garnet or in the matrix. This hydrous mineral is stable over a wide P T range in the LT blueschist facies, but rarely preserved. Pseudo morphs of this mineral can be found in the interbedded mafic rocks, so it seems possible that some of the abundant crystals of epidote present in the matrix of the schists could be the product of destabilization of lawsonite, although unquestionable pseudomorphs of this mineral were not found.
The ctd + gl paragenesis, preserved in the second generation of garnet (g2), and characteristic of this lithology, is present in the uppermost part of the dia gram between 20 and 22 kbar, and 400 and 500°C. However, in this field, the calculated composition of garnet does not correspond to that observed in g2. The isopleth values corresponding to type 2 garnet cores
(g2c) (Grs � 28 32% and Sps � 5 11 %) intersect in
the lower pressure chloritoid-absent field (at 18 kbar and 470°C; see shaded star
(I)
in Fig. Sa). The isop leths that represent the garnet rim (g2R) (Grs � 28 19% and Sps � 5 1 %) intersect in the same field at higher pressures (�20 kbar and 490°C; see shaded star (2) in Fig. Sa). Therefore, it is not possible to infer a reasonable P T evolution for this sample because garnet zoning does not fit with the petrographic observations.Although considering water in excess for the petro logical modelling is a good approximation in most metapelites along the prograde path, crystallization of strongly hydrous minerals, like lawsonite, at high pressures and low temperatures may lead to H20-undersaturation as metamorphism progresses (e.g. Guiraud et al., 2001; Ballevre et al., 2003; Clarke
et al., 2006). The available amount of H20 also has an influence on the position of the compositional isopleths. To estimate the amount of H20 available in the system at peak conditions, a P X(H20) pseudosection has been calculated at 480°C (Fig. 5b). The temperature corresponds to that estimated for the peak conditions from pseudosection approach (Fig. 5). However, other temperature values have been tested and the exact value does not have a significant effect on the result. The assemblage corresponding to the crystallization of the second generation of garnet (g-ctd-chl-gl-law*-ru ihn +mu,q) is stable between 21 and 23 kbar under H20-saturated conditions, but extends to slightly lower pressures (down to 20.5 kbar) with the decreas ing amount of H20. In this four-variant field, the isopleths corresponding to the composition of the outer part of garnet 2 (g2IJ (Grs � 28 19%, Sps
� 5 1 %) intersect between XH,00f 13.75 and 15%. Therefore, the available amount of H20 was set to 14.375 mol. % (�14.4 mol. %), corresponding to the average of these values (see shaded area in Fig. 5b). In addition, with the estimated amount of water (14.4 mol. %), a P X (Fe203) pseudosection at 480°C has been calculated to explore the effect of varying the Fe203 content for sample LM (Fig. Se). According to this diagram, the isopleths of interest intersect in a wide area between the Fe203 values analysed and the double of it (see shaded area in Fig. Se). Therefore, this diagram yields no constraints on the amount of Fe203 present in the rock, although it excludes values sig nificantly lower than the analysed one. A new P T pseudosection has been computed m the
MnNCKFMASHTO system for the analysed bulk composition and the amount of H20 fixed at 14.4% (Fig. 5d; Table 1 b). The diagram shows that the rock
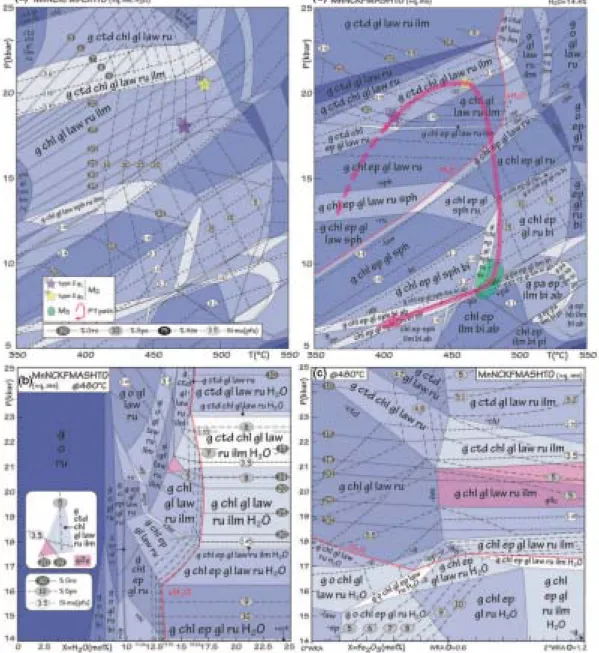
Figure 5. Sample LM [Si02:66. 1 5; Ti02:O.87; AI203: 1 1 . 55; FeO:7.72; 0:0.60; MnO:O. 17; MgO:5.00; CaO:3.16; Na20:1 .40; K20:3.37]. (a) P Tpseudosection with H20 in excess. (b) P X(H20) pseudosection calculated at 480°C. White box in the left shows a detail of the area of interest. (c) P Tpseudosection with H20 = 14.4%. (d) P X(Fe203) pseudosection calculated at 480 QC with H20 = 14.4%.
WRA original whole-rock analysis from XRF. See text and Table 1 for details.
is water saturated at LPs and HTs, but fluid absent under HP LT conditions. The HP part of the diagram (> 18 kbar) is characterized by the presence of gl + ctd and the absence of epidote (stable at
< 18 kbar). Titanite is present at pressures lower than
� 15 kbar and temperatures lower than 480°C. Rutile is stable at pressures higher than �12 kbar or tem peratures in excess of 470 QC. Biotite is stable in the LP, HT part of the diagram. The stability of parago nite is modelled only at > 470°C and < 11 kbar
(Fig. 5d).
The type 1 garnet inclusions (ep, sph, ru, q) are in ferred to represent relicts of the former full assemblage
g-chl*-ep-gl*-law*-ru-sph-mu*-q, suggesting that the rock passed through the corresponding stability field at 350 380°C, 12 14 kbar. Garnet 2 cores equilibrated then in the field g-ctd-chl-gl-Iaw*-ru-ihn +mu,q. This area is a relatively wide field at �360 480°C, 18 22 kbar. P T conditions corresponding to the growth of garnet 2 have been refined based on the intersection between different isopleths. The isopleths correspond ing to the composition of type 2 garnet core (g2c) (Sps5-11, Grs28-32) and muscovite inclusions (mu2, Si � 3.45 3.50 pfu) intersect between �18 and 19 kbar, and �400 and 420°C (shaded star
(I)
in Fig. 5d). Continuous decrease in grossular and spessartinetowards garnet 2 rims (g20 (Grs28 ---7 19; SpsS ---7 1) suggests further heating at increasing pressure up to �460 QC, 21 kbar (shaded star (2) in Fig. Sd). The matrix foliation (M3) assemblage is defined by the occurrence of muscovite, paragonite, biotite, chlorite, epidote, Na Ca amphibole, ilmenite and titanite, and the absence of chloritoid. The appearance of epidote indicates < 18 kbar for the M3 event. Biotite is stable
at < 16 kbar, ihnenite and paragonite at < 11 kbar.
The presence of paragonite suggests temperatures higher than 470°C, whereas titanite is stable at
< 480°C. Although all these phases are not stable
together in a single field of the pseudo section, their stability domains are extremely close in the region '""'-'8 10 kbar, 470 490°C, which is inferred to represent the approximate conditions of development of the main foliation S3 (green ellipse in Fig. Sd). This point is further discussed below. In any case, this suggests significant subisothennal decompression between M2 and M3. Finally, the late crystallization of albite (post M3) indicates pressures lower than �8 kbar and a probable further evolution towards lower P T (Fig. Sd). Although this pseudosection accounts quite well for the petrographic evolution of sample LM in general terms, the modelled composition of amphibole along the post-M2 path does not agree with that of the observed Na Ca amphiboles. This issue will also be discussed below.
Upper metapelites
A PT pseudosection has been calculated in the MnNCKFMASHTO model system for the bulk com position obtained by XRF and the amount of FeO
(v.
Fe203) obtained by titration (Fig. 6). To check that the bulk composition does not reach H20-undersaturated conditions during the pro grade evolution, the amount of H20 was set so that the rock is just fluid saturated in the HP part of the field ctd-chl-pa-ep-ilm-ru + q,ms, along the LP stability limit of lawsonite. This field corresponds to a PT domain through which the rock would pass, when following a hypothetical, but prob able P T path, before entering the stability domain of lawsonite. Indeed, as discussed above (see also Ballevreet al., 2003; Clarke et al., 2006), the formation of lawsonite commonly leads to H20 undersaturation. However, in this low-Ca metapelite, the modelled modal amount of lawsonite is very low. As a result, using this approach, the assemblages are H20 under saturated at low pressures and temperatures, with aqueous fluid stabilized at higher conditions (Fig. 6b). Consequently, the entire prograde evolution of this rock occurs under H20-saturated conditions and water is considered in excess in the following calculations.
In this P T pseudosection (Fig. 6a), garnet is stable at > 500°C, epidote is stable at < 520°C and
< 18 kbar and glaucophane is predicted to be stable
from 15 to 21 kbar, at < 590°C. Epidote and glau
cophane have not been found either as inclusions or in
the matrix. Therefore, based on the petrographic observations the four-variant field g-ctd-chl-pa-ihn ru+q,ms located between 12 and 15 kbar and at > 510 QC reflects the paragenesis corresponding to the matrix foliation. However, this pseudosection cannot be used to infer the equilibration conditions of the garnet core, as the observed amount of spessartine in the garnet core (Sps38-40; Fig. 4b) is not modelled anywhere in the diagram. The maximum values pre dicted in the diagram are SpslS. One reason may be the relatively high amount of Fe203 analysed in this sample, uncommon in typical pelites. Although sample UM does not appear to be altered in hand specimen or in thin section, the concentration of Fe-bearing oxides/hydroxides along shear planes (Fig. 3b) sug gests that the Fe203 proportion in the original rock may have been significantly lower compared with the result of the analysed bulk composition, possibly due to the circulation of oxidizing fluids. A series of pseudosections was recalculated with progressively lower amounts of Fe203 ('0' in the bulk composition), with significant changes only being observed when the amount of Fe203 was close to zero. The highest values predicted in the diagram for the spessartine and gros sular isopleths calculated for the garnet core compo sition intersect at � 16 kbar in the three-variant field g-ctd-pa-ep-gl-ihn-ru + q,ms (shaded star in Fig. 6a). Therefore, this domain seemed the most suitable for obtaining spessartine values closer to the observed ones by modifying the amount of Fe203 in the bulk composition. Trying to estimate a reliable amount of Fe203 for this sample, a T X(Fe203) pseudosection was calculated at 16 kbar (Fig. 6c). This diagram shows that the isopleths corresponding to the compo sition of the garnet core intersect between 425 and 440°C in the four-variant field g-ctd-chl-pa-gl-law ru + q,ms for Fe203 � 0.05 (shaded star in Fig. 6c). Consequently, a PT pseudosection has been recalcu lated with this value, 0 � 0.05 (Fig. 6d; Table 1 b).
Compared with the original diagram, in this P T pseudosection, garnet stability increases notably towards lower temperatures (from 510 to 420°C) and glaucophane is stable at pressures higher than 11 kbar. The syn-S3 matrix assemblage, g-ctd-chl-pa-ihn ru + mU,q is modelled in the relatively LP and HT part of the diagram. The analysed composition of muscovite (Si < 3.1 pfu) is compatible with the equilibration of
the matrix in the LP part « 11 kbar) of this field. The isopleths corresponding to the proportions of grossular and spessartine in the garnet cores (18 20 and 38 40% respectively) intersect in the four-variant field g-ctd
chl-pa-gl-law-ru + q,ms at � 15 16 kbar, 430°C
(shaded star (1) in Fig. 6d). One of the principal characteristics of the garnet zoning observed in the sample is a continuous decrease of spessartine, whereas the grossular content remains at an approximately stable value. This evolution may only be explained if a
Ca-rich phase like epidote or lawsonite coexists
"-'�����
--
����-r--
, 2.-. (b) 5������--
���---
, MnNCKFMASHTO ( ... 'l> mu) 20 ctdogllawilmru 19 ctd �9I I[a��wQ�nm['B"�.;,::::::51i'J',§ 18 g ctd pagl lawilmru ctd pa gl law ilm ru L , .... ... ,.., ... -,.�,c n:I :.�"'''' .fI_'''''',o .J:::io :1."",..,.."',...
",0 6 4.
.... <*1,..,."....
",0 Q..'
... ,..,."..., .... ",,0 ... ,. ... ".0 ... " ... ",0 21 �...
tI .... H"O 90...
"''',020 ctd 0 gl law ilm ru H,O
19 ct<:IpaogllawilmruH 0 16 1 7
�
;-;:�
�
��
..u
, 1.1' 15 17�
�
�
��
�
�
�
�
�
�
�
�
"�
�:
::
�":
'�'":.�N�
'" 16 .� 9 ctd chi pa ilm ru H20 1. 13 13 12 12 11 11 10400 420 440 460 480 500�
��
��
�;:
�;:�!C
�
�����
540 ����
500 520 540 T(°C) 5M 600Figure 6. Sample UM [Si02:68.63; Ti02:O.66; AI203:14.70; FeO: 7.68; 0:0.89; MnO:0.26; MgO:3.05; CaO:0.24; Na20:0.98; K20:2.91] (a) P Tpseudosection with H20 in excess. (b) P Tpseudosection calculated for the analysed bulk-rock composition showing dehydration along the stability limit of lawsonite. (c) T X(Fe203) pseudosection calculated at 16 kbar between 420 and 520 QC; WRA
original whole-rock analysis from XRF. (d) P Tpseudosection with Fe203 = 0.05 mol. %. The star (2)* is inferred from Fig. 6e. (e)
P T pseudosection calculated for the bulk-rock composition after fractionation of garnet and chloritoid. (t) P T pseudosection calculated in the CKFMASH system for the bulk-rock composition after fractionation. The star (2)* is inferred from (e). See text and Table 1 for details.
isopleths become nearly parallel and a decrease in spessartine is accompanied by a decrease in grossular, which is not observed in the sample. However, at the lawsonite-out line of the field g-ctd-pa-gl-law
ill + q,ms, for grossular contents between 15 and 20%,
corresponding to those observed in the sample, the spessartine content is '""'-' 15%, whereas the value ob served in the garnet rim is �3'10 (Fig. 4b).
As Mn is mostly stored in garnet cores during pro grade metamorphism, this inconsistency could be re lated to the fractionation of whole-rock composition due to the garnet growth. However, progressive re moval of even all crystallizing garnet from the bulk composition does not reproduce the observed garnet rim compositions. Although much poorer in Mn than garnet, chloritoid does contain Mn and is present in significant quantities in the sample (and the model pseudo section). Furthermore, clusters of large chlori toid crystals in the sample appear shielded from the deformation associated with the development of the main foliation and could be effectively inert during the recrystallization of the rock matrix (and the crystalli zation of the rims of matrix garnet). Progressive frac tionation of garnet and the removal of 95% of chloritoid at the point when the modelled crystallizing garnet has the composition of the rims of the garnet inclusions in chloritoid results in a Mn-poor bulk
composition (Table 1 b) and a corresponding P T
pseudo section depicted in Fig. 6e. This model repro duces the observed garnet zoning, with the garnet rims crystallizing at the lawsonite-out limit of the field g-ctd-pa-gl-law-ru + q,mu at �21.5 kbar, 510 520°C.
The composition of muscovite (Si �3.3 pfu) mod elled along the path iuferred for the garnet growth is compatible with the values observed in the muscovite inclusions in the chloritoid porphyro blasts. Conse quently, the preserved garnet zoning constrains the prograde P T evolution of the sample from � 16 kbar and 430°C to �21 kbar and 510°C.
The lack of further garnet growth suggests that the subsequent evolution must have occurred at constant or decreasing garnet mode. Indeed, partial garnet resorp tion is suggested by the local increase of spessartine at the very rim of the matrix crystals (Fig. 4). The isop leths of garnet mode (not represented) are essentially parallel to the isopleths of the spessartine content. Their position suggests an evolution dominated by decom pression at approximately constant or decreasing tem perature. Nevertheless, in Fig. 6e, such an evolution systematically passes through fields containing glauco phane, which is not present in sample UM. Glauco phane disappears from the model mineral assemblages at pressures lower than 8 kbar (not represented). But, all fields at pressures lower than 10 13 kbar contain biotite, which is not present in the sample either (Fig. 6e). However, it cannot actually be excluded that the rock passed although biotite-bearing fields because during cooling rocks become dry and diffusion ineffi cient (e.g. Guiraud et al., 2001). Consequently, it is not
possible to interpret the formation of the matrix assemblage using this pseudosection.
Trying to overcome these problems, the chemical system was simplified to CKFMASH using the fol lowing assumptions based on the petrographic obser vations. Sodium was removed from the bulk composition in the form of paragonite (which is the only Na-bearing mineral in the matrix), MnO was subtracted in the form of ihnenite containing 10% pyrophanite and the remaining Ti02 was removed as 40% rutile and 60% ihnenite (according to the modal proportions observed in thin section). These minerals are therefore considered de facto in excess. The resulting P T pseudo section (Fig. 61) has chloritoid in the HP LT corner of the diagram, whereas biotite is stable in the LP HT part. The stability field that ap proaches best the observed matrix assemblage is g-chl (+mu-q; +pa-ilm-ru), stable at temperatures between
460 and 560°C and 13 < P < 23 kbar. The P T
conditions of the formation of the matrix remain therefore largely unconstrained.
DISCUSSION
The two samples representative, respectively, of the lower and upper level of the Cein Schists in the Upper Sheet of the MTU have recorded similar P T evolu tions characterized by a prograde P T path in blues chist facies conditions, peaking at 21 22 kbar. The temperatures recorded in the UM are slightly higher than those from the LM (Fig. 7a). Both samples could have experienced a slightly different evolution due to their different position in the orogenic wedge (Fig. 7b). In the LM, the blueschist facies assemblages were overprinted by the regional foliation developed at significantly lower pressures (8 10kbar, 470 490°C). Whereas the calculated phase diagrams and the proposed metamorphic evolution account reason ably well for the first-order petrographic observations, and are in agreement with the mineral chemistry in both the LM and the UM, several details need to be discussed.
Phase diagrams
For both rock types, the first step was to calculate a P T pseudosection using the water-saturated analysed bulk composition. Coufronted with the lack of com patibility between the observations and the modelling results, various compositional parameters that may significantly modify the appearance of the pseudo sec tion have been investigated (calculating parts of P T
or PIT X pseudo sections), to obtain coherent results.
For the LM, the H20 content appeared to be the critical factor. Fe3 + appeared to play the major role for UM, whereas the low mode of lawsonite in this low-Ca pelite did not lead to H20-depletion and the rock remained H20 saturated during the prograde evolution.
(a) 25 7
GS
W
:.r"=
5 350 400 (b) NW 450 500 550 92�
..@ !
04 � 76 •AEC
2-• • • .. o"G�;'- 62 .,.@V'
�
55 47 A M 40 600 650 33 26 T{"C) 1 6 700 SE :370-360Ma MSAlUNtTS .An<-d.!nv...! • Upp"rMot.n.200 � • Ocank: IIthoeplo_ I..owcr MIut
Figure 7. (a) P T diagram showing the metamorphic paths of the Cean Scmsts (LM and UM). The P T paths for the Lower Sheet of the Malpica Till Unit (unpublished data) and for the Agualada Unit (Arenas et aI., 1997) are also included. Meta morphic facies field abbreviations: as, greenschist facies; EA, epidote, amphibolite facies; AM, amphibolite facies; LB, laws onite bluescmst facies; EB, epidote bluescmst facies and AEC, amphibole eclogite facies (Evans, 1990 (dashed line); Maruyama
et aI., 1996). (b) Schematic cross-section of the subduction zone
operating in the NW Iberian Massif at 370 360 Ma. US, upper sheet; LS, lower sheet; AG, Agualada Unit. Based on Martinez Catalim et al. (1996).
In both samples, the modelling accounts quite well for the observed paragenetic sequence. It can be ob jected that all the phases inferred to be stable during
the prograde part of the P T evolution, in particular lawsonite and glaucophane, are not observed in the thin sections (with the exception of the M2 glauco phane inclusion in garnet of the LM). However, inclusions typically only represent remnants of the initial full assemblages. In more detail, in the LM, the absence of lawsonite has already been discussed above and can be explained by the classic replacement by epidote during decompression. In the UM, the mod elled proportion of both lawsonite and glaucophane is very low (max. 0.9 and 3 5% respectively) making their preservation improbable.
In the LM, no stability field can account for the presence of all the M3 minerals in the S3 foliation. The stability domains of the M3 minerals, in particular paragonite, chlorite and titanite are extremely close to one another in the topologically complex region at around 8 kbar, 470°C, but do not overlap. Never theless, it can be argued that along a P T path crossing
this region, a rock could develop these minerals sequentially, giving the impression of an equilibrium assemblage. Alternatively, minor changes in the parameters of the mixing models for solid solutions could change the topology sufficiently to obtain the observed assemblage in one field in this P T domain .
Similarly, only small and scattered crystals of chemically heterogeneous Na Ca amphibole are ob served in the matrix foliation. However, the amphibole predicted in the pseudosection has systematically a high-glaucophane content and is relatively abundant (18 14 moL%) down to pressures of �8 kbar, when albite becomes stable. When reaching the field g-chl ep-gl-sph-bi-ab + q,ms at 7 kbar, an abrupt decrease in the mode of amphibole (from 14 to 3 moL %) coincides with an increase of the proportion of hornblende. This increase is compatible with the presence of Ca amphiboles, such as hornblende and tschermakite, observed in the post-S3 textural position. Although the amphibole chemical composition along the proposed
P T path never coincides with the analysed composi tions, this qualitative evolution is compatible with the crystallization of the post-S3 phases under relatively LP conditions, of the order of 7 8 kbar, < 480°C.
In sample UM, it is difficult to estimate reliably the equilibration conditions of the matrix foliation (S3). In the P Tpseudosection calculated for the analysed bulk composition (Fig. 6a,b), the syn-S3 matrix assemblage, g-ctd-chl-pa-ilm-ru + q,ms and the composition of the matrix muscovite (Si < 3.1 pfu) suggest equilibration of the matrix in the LP and HT part of the diagram « 11 kbar, > 480°C). However, this diagram does not account for the observed garnet zoning. This can only be explained if significant fractionation of garnet and chloritoid takes place (Fig. 6e). Then, however, any reasonable P T evolution systematically passes through fields containing glaucophane, which is not present in the sample, unless paragonite is forced in excess in a model system reduced effectively to CKF MASH (Fig. 61).
The first reason for this can be a problem with the solid-solution models. Unfortunately, even using the most recent glaucophane (Diener & Powell, 2012) and white mica (Smye et ai., 2010) models only results in minor differences in the pseudosection and does not solve the problem. It appears that glaucophane is 'too stable', in particular with respect to paragonite. A second reason may be related to problems with the identification of the effective bulk composition. This can be related to the deformation-enhanced fraction ation of the bulk composition in a layered rock. In certain layers, the initial bulk composition undergoes fractionation during the growth of garnet and chlori toid porphyroblasts. During the subsequent defonna tion, a certain proportion of these porphyroblasts is preserved in undeformed domains, forming the ob served chloritoid + garnet-rich clusters (Fig. 3b). Other layers and a part of the garnet chloritoid clus ters recrystallize during the fonnation of the S3 foliation.
![Figure 6. Sample UM [Si02:68.63; Ti02:O.66; AI203:14.70; FeO: 7.68; 0:0.89; MnO:0.26; MgO:3.05; CaO:0.24; Na20:0.98; K20:2.91]](https://thumb-eu.123doks.com/thumbv2/123doknet/14797004.604294/13.893.174.752.19.861/figure-sample-um-si-feo-mno-mgo-cao.webp)