HAL Id: hal-00316625
https://hal.archives-ouvertes.fr/hal-00316625
Submitted on 1 Jan 2000
HAL is a multi-disciplinary open access
archive for the deposit and dissemination of sci-entific research documents, whether they are pub-lished or not. The documents may come from teaching and research institutions in France or abroad, or from public or private research centers.
L’archive ouverte pluridisciplinaire HAL, est destinée au dépôt et à la diffusion de documents scientifiques de niveau recherche, publiés ou non, émanant des établissements d’enseignement et de recherche français ou étrangers, des laboratoires publics ou privés.
A statistical survey of dayside pulsed ionospheric flows
as seen by the CUTLASS Finland HF radar
K. A. Mcwilliams, T. K. Yeoman, G. Provan
To cite this version:
K. A. Mcwilliams, T. K. Yeoman, G. Provan. A statistical survey of dayside pulsed ionospheric flows as seen by the CUTLASS Finland HF radar. Annales Geophysicae, European Geosciences Union, 2000, 18 (4), pp.445-453. �hal-00316625�
A statistical survey of dayside pulsed ionospheric ¯ows
as seen by the CUTLASS Finland HF radar
K. A. McWilliams, T. K. Yeoman, G. Provan
Department of Physics and Astronomy, Leicester University, University Road, Leicester LE1 7RH, UK Received: 10 September 1999 / Revised: 3 December 1999 / Accepted: 6 December 1999
Abstract. Nearly two years of 2-min resolution data and 7- to 21-s resolution data from the CUTLASS Finland HF radar have undergone Fourier analysis in order to study statistically the occurrence rates and repetition frequencies of pulsed ionospheric ¯ows in the noon-sector high-latitude ionosphere. Pulsed iono-spheric ¯ow bursts are believed to be the ionoiono-spheric footprint of newly reconnected geomagnetic ®eld lines, which occur during episodes of magnetic ¯ux transfer to the terrestrial magnetosphere ± ¯ux transfer events or FTEs. The distribution of pulsed ionospheric ¯ows were found to be well grouped in the radar ®eld of view, and to be in the vicinity of the radar signature of the cusp footprint. Two thirds of the pulsed iono-spheric ¯ow intervals included in the statistical study occurred when the interplanetary magnetic ®eld had a southward component, supporting the hypothesis that pulsed ionospheric ¯ows are a reconnection-related phenomenon. The occurrence rate of the pulsed iono-spheric ¯ow ¯uctuation period was independent of the radar scan mode. The statistical results obtained from the radar data are compared to occurrence rates and repetition frequencies of FTEs derived from spacecraft data near the magnetopause reconnection region, and to ground-based optical measurements of poleward moving auroral forms. The distributions obtained by the various instruments in dierent regions of the magnetosphere were remarkably similar. The radar, therefore, appears to give an unbiased sample of magnetopause activity in its routine observations of the cusp footprint.
Key words: Magnetospheric physics (magnetosphere-ionosphere interactions; plasma convection; solar wind-magnetosphere interactions)
1 Introduction
Magnetic reconnection is a fundamental process in the dynamics of the magnetosphere. The merging of the interplanetary magnetic ®eld (IMF) and the geomag-netic ®eld on the dayside provides the primary mecha-nism for energy input to the cyclic system (Dungey, 1961). Understanding the nature of this reconnection process is a key to revealing the true nature of the solar wind-magnetosphere-ionosphere interaction.
The ®rst published observations consistent with episodic bursts of reconnection at the magnetopause were made at the magnetopause on board the Heos 2 satellite by Haerendel et al. (1978), who discussed a number of potential physical mechanisms of mass and momentum transfer from the solar wind to the magne-tosphere. Evidence of pulsed reconnection at the mag-netopause has been reported as a bipolar signature in the magnetic ®eld component normal to the magneto-pause (Haerendel et al., 1978; Russell and Elphic, 1978, 1979; Lockwood and Wild, 1993; Kuo et al., 1995).
Ground-based evidence of magnetopause reconnec-tion followed when Goertz et al. (1985) used the STARE radar (Greenwald et al., 1978) to detect anti-sunward ¯ow poleward of the convection reversal boundary with an occasional signi®cant north-south component, as well as sporadic ¯ow across the convec-tion reversal boundary with scale sizes of 50 to 300 km and repetition rates of the order of minutes. These types of ¯ows are consistent with the predicted response of the ionosphere to reconnection events at the magnetopause. Simultaneous spacecraft and ground-based observations of the reconnection region and its footprint, which are dicult to achieve, have since shown that the ionosphere does respond to FTEs and that the response is detect-able as periodic anti-sunward ionospheric convective ¯ow bursts (Elphic et al., 1990; Moen et al., 1995; Yeoman et al., 1997; Neudegg et al., 1999).
Since the relationship between magnetopause recon-nection and its ionospheric response was established,
Correspondence to: K. A. McWilliams e-mail: [email protected]
many low-altitude studies have examined the nature of the ionospheric response to reconnection, and from this have attempted to make inferences about the nature of reconnection itself. Pulsed ionospheric ¯ows (PIFs) have been observed in several frequency bands of radar data: UHF (Van Eyken et al., 1984), VHF (Goertz et al., 1985), and HF (Pinnock et al., 1995; Provan et al., 1998, 1999). Provan et al. (1999) produced a statistical study of the location and extent of PIFs seen by an HF radar. They found that the change in the ionospheric convec-tion due to magnetic reconnecconvec-tion, periodic high-veloc-ity anti-sunward bursts along the throat of the convection pattern, was in accordance with the average east-west IMF controlled tilt of the throat ¯ow. Series of poleward moving auroral forms (PMAFs) at the polar cap boundary are believed to be the optical manifesta-tion in the ionosphere of magnetospheric FTEs (Vor-objev et al., 1975; Sandholt et al., 1990, 1992; Fasel, 1995; éieroset et al., 1997). Karlson et al. (1996) found an asymmetric prenoon-postnoon occurrence distribu-tion of PMAFs which was highly dependent on the IMF By component. Data from an HF radar, an all-sky
camera, photometers, and an HF riometer have been compared and good agreement has been found between the various ground-based signatures of FTEs (Rodger et al., 1995).
Theoretical considerations of FTEs have resulted in suggestions for the possible cause of episodic bursts of reconnection at the magnetopause and in a description of their behaviour, both at the reconnection site and at their ionospheric footprint (Cowley, 1984; Siscoe and Huang, 1985; Cowley et al., 1991, 1992; Cowley and Lockwood, 1992; Lockwood, 1993; Lockwood et al., 1995; Lockwood and Hapgood, 1998). Hypotheses regarding the triggering mechanism, which predict separation times for FTEs from several to a few tens of minutes, include IMF Bz ¯uctuations (Lockwood
et al., 1989), spontaneous FTEs (Lockwood and Wild, 1993), and intrinsic magnetospheric system control (Kuo et al., 1995).
In general, low-altitude measurements have shown that, on a case-by-case basis, dayside ionospheric processes can be related directly to reconnection at the magnetopause. In situ studies of reconnection are, by de®nition, dicult to achieve. HF radars oer routine observations and excellent coverage of the ionospheric footprint of the reconnection region, but do ionospheric measurements oer an unbiased sample of magneto-pause reconnection? The aim of the current research is to examine quantitatively a large sample of PIFs seen by an HF radar in the magnetic local noon sector. A technique based on Fourier analysis has been employed to determine the time between successive PIFS, and the resulting distribution is compared with results obtained from in situ measurements of FTEs and with ground-based measurements of PMAFs. This com-parison enables a determination of whether PIFs ob-served by HF radars in the noon-sector high-latitude ionosphere are representative of magnetopause activity. If this is so, the PIFS, which are measured routinely by HF radars and oer routine, large-scale observations of the
projection of the reconnection region, can be used to study the phenomenon of dayside magnetic reconnection. 2 Observations
The velocity data used in this study were obtained from the Co-operative UK Twin Located Auroral Sounding System (CUTLASS) (Milan et al., 1997), a pair of pulsed monostatic HF radars located in Iceland and Finland. The radars are a part of the international Super Dual Auroral Radar Network (SuperDARN) (Green-wald et al., 1995), which covers a large portion of the northern and southern auroral zones and polar caps. The SuperDARN radars measure high latitude plasma convection in the Northern and Southern Hemispheres at E-region and F-region altitudes.
During the common mode of operation the radars step through a series of 16 consecutive beam positions. The beam is produced by an array of sixteen log-periodic antennas and an electronically controlled phasing ma-trix, which steers the radar beam through its 16-position scan. The transmission sequence for the radars is a multi-pulse pattern. In standard operations the radars have a range resolution of 45 km. In normal operations the radars run between 9 and 14 MHz (measuring iono-spheric irregularities between 10 and 17 m), often changing their frequency between day and night depend-ing on the ionisation of the F region, givdepend-ing a typical angular resolution of 4° or a half-power beam width of about 100 km at the half-range mark of 1500 km. The multi-pulse sequence used in the SuperDARN common mode of operation consists of seven pulses sent out during a 100 ms transmission window. The dwell time for each beam is 7 s, resulting in a 2-min scan time for the entire ®eld of view. In high-time resolution mode fewer beams are scanned more frequently, or the dwell time is reduced, or both. This makes it possible to reduce the time resolution for a beam to one second. In the high-time resolution data used in the current study, the temporal resolution along a beam has been reduced from 2 min to 7±21 s, depending on the scan mode.
3 Data analysis
Studies of pulsed ionospheric ¯ows have generally relied on visual event-by-event analysis of hand-picked data. For this study, an attempt was made to devise an objective, quantitative method to analyse PIFs. The technique utilises the Fourier transform to determine the dominant repetition frequencies in the noon-sector ionospheric convection.
3.1 Selecting the PIF intervals
PIFs are most easily identi®ed in the CUTLASS radar line-of-sight (LOS) velocity data as periodic high velocity stripes moving away from the radar into the polar cap, often at speeds of the order of 1 km s)1. The
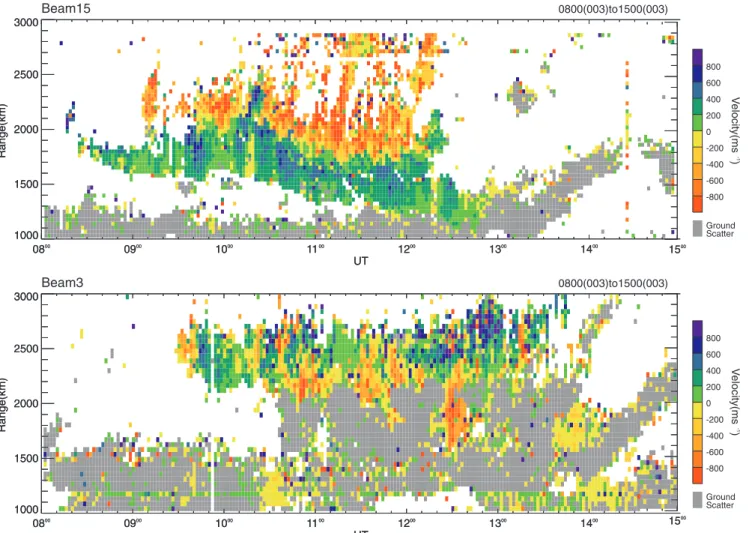
top panel in Fig. 1 is a typical example of periodic anti-sunward ¯ow bursts seen in HF radar data. These data were measured by beam 15 (the easternmost beam) of the CUTLASS Finland radar between 08:00 and 15:00 UT on 3 January, 1996, one of the intervals included in the statistical study. In this range-time-velocity plot ground scatter is coloured grey, while the ionospheric scatter is represented by the colour scale on the right. Negative velocities (the yellow and red portion of the colour bar) signify plasma motion away from the radar. The identi®cation of high-speed ¯ow bursts such as these has been the most commonly used method to identify pulsed cusp footprint signatures in the radar data in previous studies of the ionospheric footprint of the magnetospheric cusp (e.g. Pinnock et al., 1995; Rodger and Pinnock, 1997; Provan et al., 1998; Neud-egg et al., 1999).
The measured signal of the poleward-moving ¯ow bursts depends on the direction of the plasma ¯ow with respect to the radar beam direction. The high-velocity stripes described are the signature of a strong, periodic ¯ow component away from the radar. As the plasma ¯ow direction becomes less beam-aligned the measured signature of the PIFs becomes less evident. This eect is
manifested in a decrease in the ¯ow velocity and range extent of the PIFs along the radar beam, and in less distinction between ¯ow pulses. The backscatter mea-surements made along beam 3, which is in the western portion of the CUTLASS Finland radar, are presented in the bottom panel of Fig. 1. These are the measure-ments taken at the same time as the high-velocity stripes are seen in the easternmost beam in the radar ®eld of view. Velocity perturbations are present in the data from beam 3, but they are not so visually obvious as those measured along beam 15. In order to study the extent of the PIF, it is therefore necessary to devise a quantitative method for ®nding periodicities in the plasma ¯ow that may not look like the typical high-velocity ¯ow bursts seen moving away from the radar.
The intervals selected for this statistical survey of PIFs were taken from CUTLASS Finland data measured between March 1995 and September 1996, inclusive. The ¯ows occurred in the dayside ionosphere within several hours of magnetic local noon. Both high time resolution data (7 to 21 s dwell time per beam, depending on the scan pattern) and common mode (2 min resolution) data were studied, since both scan-ning modes have high enough resolution to detect PIFs
0800 0900 1000 1100 1200 1300 1400 1500 UT 1000 1500 2000 2500 3000 Range(km) 0800 0900 1000 1100 1200 1300 1400 1500 UT 1000 1500 2000 2500 3000 Range(km)
Beam15
0800(003)to1500(003) -800 -600 -400 -200 0 200 400 600 800 Velocity(ms -1 ) Ground Scatter 0800 0900 1000 1100 1200 1300 1400 1500 UT 1000 1500 2000 2500 3000 Range(km) 0800 0900 1000 1100 1200 1300 1400 1500 UT 1000 1500 2000 2500 3000 Range(km)Beam3
0800(003)to1500(003) -800 -600 -400 -200 0 200 400 600 800 Velocity(ms -1 ) Ground ScatterFig. 1. Line-of-sight velocity data measured by CUTLASS Fin-land radar beams 15 and 3 between 08:00 and 15:00 UT on 3 January, 1996. Poleward-moving ¯ow bursts are evident as the red
stripes seen in the data from beam 15 (top). Periodic velocity ¯uctuations also exist in the beam 3 data (bottom), but they are not so visually obvious
(Provan and Yeoman, 1999). LOS velocity data were selected by an initial visual inspection of dayside measurements from all radar beams. This preliminary survey revealed 239 intervals with visually apparent variable ¯ows on at least one radar beam. The high-time resolution data, selected in the same manner included 60 intervals, comprising 149 hours of radar data.
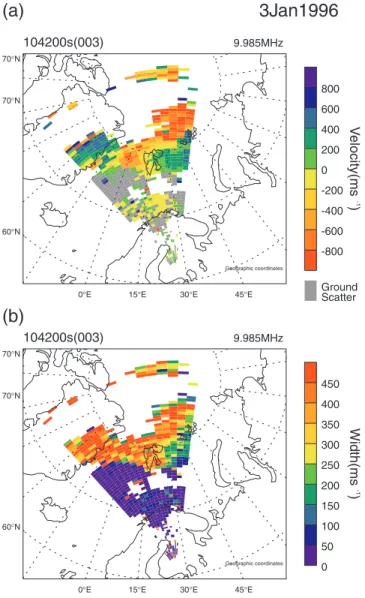
Once an interval was identi®ed based on the PIF signatures in the LOS data, it was necessary to check that the data was measured in the vicinity of the cusp footprint. The geographic projection of a single radar scan measured between 10:42 and 10:44 UT on 3 January, 1996 is presented in Fig. 2. The line of sight velocity is plotted in Fig. 2a and the spectral width in Fig. 2b. The line-of-sight velocity plot has the same colour scale as the range-time-velocity plot in Fig. 1, where negative velocities denote ¯ow away from the
radar. The ¯ow components toward the radar in the west and away from the radar in the east are consistent with eastward ¯ow across the radar ®eld of view. The high-latitude red stripes that were evident in the top panel of Fig. 1 correspond to the red patches originating in the centre of the ®eld of view and extending to far ranges in the easternmost beams. The IMF for this interval had a Bzcomponent of about )2 nT (GSM) and
a By component of about )4 nT (GSM), measured by
the WIND spacecraft magnetic ®eld instrument (Lep-ping et al., 1995). WIND was located approximately 170 Earth radii upstream. The strong duskward ¯ows away from the radar are consistent with the negative By
component. The spectral width of the CUTLASS measurements can be used to estimate the location of the ionospheric footprint of the magnetospheric cusp. In the radar data the cusp footprint is identi®ed as having a complex Doppler spectrum and a broad spectral width distribution (Baker et al., 1995). The high spectral widths (above 400 m s)1) are found above
approximate-ly 75° in Fig. 2b. The ¯ow toward the radar at medium ranges in the east coincides with a region of narrow spectral widths. This is consistent with the lower latitude sunward return ¯ow on closed ®eld lines. The ground scatter at lower latitudes is also characterised by narrow spectral widths.
3.2 Fourier analysis
To quantify the periodic ¯uctuations in the hand picked data, a Fourier transform (FFT) was applied to the time series for each range cell in the radar ®eld of view. The Fourier analysis of the time series required some pre-transform processing: linear trends in the velocity data were removed, the time series were shifted in order to have a zero mean value, and the ends of the time series were tapered using a cosine bell curve.
Figure 3a is the LOS velocity time series measured at range 52 of beam 15 between 9:30 and 12:30 UT on 3 January, 1996. Strong bursts of ¯ow away from the radar (negative Doppler shifts) are evident. Figure 3b is the resulting Fourier spectrum of the time series in Fig. 3a. The spectrum has been normalised to the peak value, which occurs at approximately 0.09 mHz. The equivalent period for this frequency is about 189 min and corresponds to the duration of the time series. In an attempt to ensure a good velocity sample with few data gaps, an FFT was calculated only if more than 20% of the possible data points in the time series existed. This value was chosen in order to accommodate the geomet-ric eects of the large-scale radar measurements. As the radar rotates into the noon sector, the eastern beams measure the PIFs ®rst while the western beams generally measure no backscatter. The reverse occurs as the radar moves out of the noon sector. The repetition frequencies in the Fourier spectrum were considered to be signi®cant when their power exceeded ®ve percent of the maximum power. The equivalent periods that are above the 5% minimum power threshold in Fig. 3b occur at about 189, 41, 12, 9, 8, and 5 min. Geographic coordinates
104200s(003)
9.985MHz 60°N 70°N 70°N 0°E 15°E 30°E 45°E -800 -600 -400 -200 0 200 400 600 800Velocity(ms
-1)
Ground Scatter Geographic coordinates104200s(003)
9.985MHz 60°N 70°N 70°N 0°E 15°E 30°E 45°E 0 50 100 150 200 250 300 350 400 450Wid
th(ms
-1)
3Jan1996
(a)
(b)
Fig. 2. a The single-scan line-of-sight velocity data measured by the CUTLASS Finland radar between 10:42 and 10:44 UT, 3 January, 1996. The co-ordinates are geographic and the colour scale is such that negative velocities (red-yellow) signify motion away from the radar. b The single-scan spectral width plot from 10:42 to 10:44 UT, 3 January, 1996
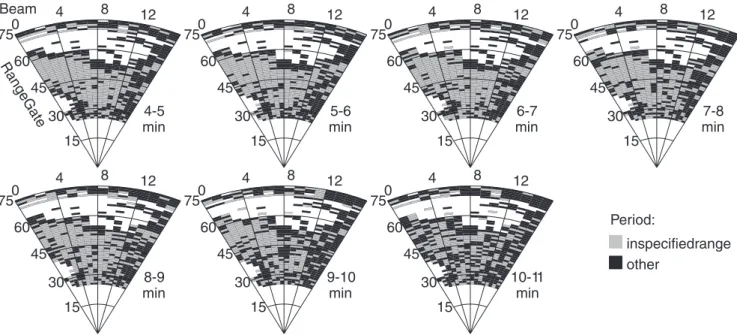
In order to facilitate comparison with other data sets (Lockwood and Wild, 1993; Kuo et al., 1995; Fasel, 1995), which have dealt with the time between successive FTEs or PMAFs, the oscillation frequencies from the FFT analysis of the time series were converted to repetition periods, in minutes. The distribution within the radar ®eld of view of the resulting repetition periods for each interval were then investigated. Figure 4 presents an example of the distribution of the ¯uctua-tion period over the radar ®eld of view. These have been deduced from the FFT of the 09:30±14:00 UT time series on 3 January, 1996. Each plot represents the spatial
distribution of signi®cant ¯uctuations, as de®ned al-ready, within a 1 min interval. For example, the top left plot shows the range cells where such periodicities, T, were found in the ®eld of view such that 4.0 min £ T < 5.0 min. The plot to its right shows where 5.0 min £ T < 6.0 min, and so on. The grey range cells are where the FFT analysis has found signi®cant periodicities within the speci®ed one-minute interval, as de®ned above. Range cells where the FFT spectrum is calculable but there are no signi®cant spectral peaks within the stated range are coloured black. In Fig. 4 there is a very clear grouping of range cells with similar
Fig. 3. a The CUTLASS velocity time series from beam 15, range 52 on 3 January, 1996, between 09:30 and 12:30 UT. b The Fourier spectrum of CUTLASS velocity time series in a normalised to the peak power. Fluctuations above the 5% mini-mum normalised power threshold occur at approximately 189, 41, 12, 9, 8, and 5 min
15
30
45
60
750
Beam
4
8
12
RangeGate
4-5
min
Period:
inspecifiedrange
other
5-6
min
15
30
45
60
750
4
8
12
6-7
min
15
30
45
60
750
4
8
12
7-8
min
15
30
45
60
750
4
8
12
8-9
min
15
30
45
60
750
4
8
12
9-10
min
15
30
45
60
750
4
8
12
10-11
min
15
30
45
60
750
4
8
12
Fig. 4. Occurrence of velocity ¯uctuation period T, such that 4.0 min £ T < 5.0 min, 5.0 min £ T < 6.0 min, 6.0 min £ T < 7.0 min, and so on for the 09:00±13:00 UT interval on 3 January, 1996. Range cells where the FFT spectrum is calculable but there are no periods within the stated range above the
minimum power threshold are coloured black. The grey range cells are where the FFT analysis has found periods within the speci®ed one-minute interval. A clear grouping of range cells with similar periods can be seen between range gates 30 and 60 and extending across beams 0 to 12
periods in the centre of the radar ®eld of view between range gates 30 and 60 that extend across beams 0 to 12. The grouping tended to become less obvious for higher T. Comparison of these plots with the LOS velocity data in Fig. 2a reveals that the grouped periodicities are found in the poleward-moving PIFs. Some intervals included in the statistical study have also shown well grouped periods in the part of the ®eld of view believed to be sunward return ¯ow on closed ®eld lines. The most poleward region of PIFs in the eastern part of the ®eld of view was not well suited to the FFT analysis. The time series in this region consisted of high speed ¯ow bursts separated by data gaps.
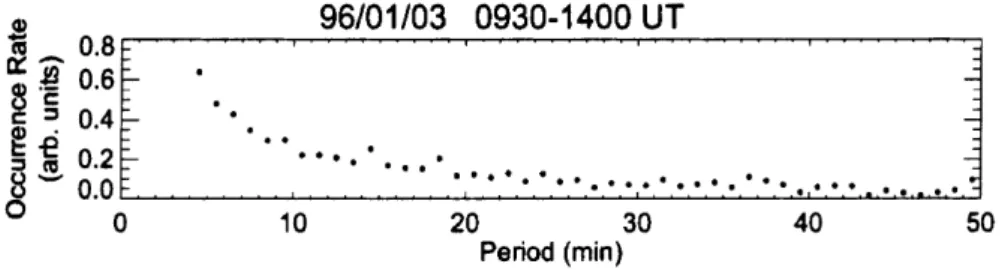
For each one-minute period interval (each panel in Fig. 4), the normalised power of the signi®cant peaks of the Fourier spectra across the ®eld of view were added together. This gave, for each panel in Fig. 4, a quanti-tative estimate of the contribution of that velocity repetition period to the ionospheric convection over the whole radar ®eld of view. For example, for beam 15, range 52 (see Fig. 3b) there were no Fourier spectral peaks with periods between 4 and 5 min, so the total contribution for this range cell in the 4±5 min interval was zero. Between 5 and 6 min, there were two Fourier spectral peaks above the 5% minimum power threshold. Therefore the total normalised power for the 5±6 min interval is roughly 0.15. The totals in each one-minute interval were then summed over the entire ®eld of view. For example, contributions from all range cells for the 4±5 min interval were summed and the total was approximately 0.65. The resulting distribution of veloc-ity ¯uctuations with periods between 0 and 50 min is plotted in Fig. 5. In general, this distribution with a high occurrence rate at low periods that decreased with increasing period was typical of the PIF intervals studied.
3.3 The statistics
In order to determine which intervals were suitable for the statistical study, it was necessary to devise a quanti®able method to select the data in which the periodicities were well grouped, like the data shown in Fig. 4. The result was a simple algorithm that compared the number of range cells where periodicities existed (the grey range cells in Fig. 4) to the number of their adjacent grey neighbours. The neighbouring cells included in the calculation are those which share a side with the range cell in question; therefore each range cell has a maximum of four neighbours. The ratio of the
total number of grey neighbours to the total number of grey points represents how well grouped the periodicities are within the ®eld of view. For example, for a statistically large distribution such that edge eects can be neglected, the maximum ratio that could be obtained is 4. Inspection showed that a ratio of 1.5 corresponds to substantial aggregation in the ®eld of view. An interval is considered therefore to be well grouped if it has at least two one-minute period intervals with a ratio greater than 1.5. Only data further away from the radar than range gate 25 is considered, as this is the minimum range where F-region ionospheric backscatter is observed in the LOS data. Of the original 239 PIF intervals selected by hand in the common mode data set, 139 intervals, comprising 456.25 h of observations, survived the Fourier analysis and were well enough grouped in the radar ®eld of view to be used in the statistical aggregation. Data from the 60 high-time resolution intervals (149 h of data) did not undergo this rigorous analysis of the grouping because usually only one beam was operating at the higher resolution. However, all high-time resolution events showed a tendency for clustering of the grey cells along the beam at the expected ranges.
4 Discussion
4.1 Occurrence rates and repetition frequencies
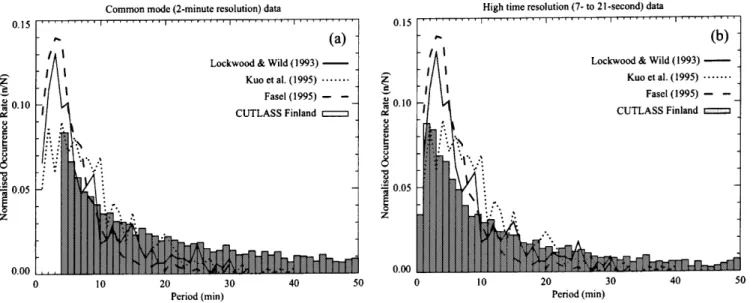
For each of the intervals the total contribution of each weighted periodicity in all range cells was calculated. Then a distribution over the one-minute periodicity intervals between 0 and 50 min was determined, like the one in Fig. 5. In order to account for the dierent interval durations, the occurrence rate for each distri-bution was multiplied by the length of the PIF interval. This periodicity histogram format was chosen to facilitate the comparison with results from in situ spacecraft and ground-based optical measurements. The results for all intervals in the statistical study were then combined to produce a histogram of the occurrence rate of the PIF period versus the period. The normalised histogram for the common mode data is coloured grey in Fig. 6a. There are no periods less than 4 min, since the sampling rate of the radar is 2 min, i.e. the Nyquist frequency is 4.2 mHz. The occurrence rate of the line of sight velocity ¯uctuation period decreases with increas-ing repetition period. The solid and dotted lines denote the normalised occurrence rate of the distributions of the inter-FTE intervals deduced from the ISEE spacecraft
Fig. 5. The distribution of the velocity ¯uctuation periods from Fig. 4 for the 09:00±13:00 UT interval on 3 January, 1996, for velocity ¯uctuations with periods between 0 and 50 min. The distribution has a high occurrence rate at low periods that decreases with increasing period, and is typical of the PIF intervals studied 450 K. A. McWilliams et al.: A statistical survey of dayside pulsed ionospheric ¯ows
near the magnetopause in the reconnection region by Lockwood and Wild (1993) and Kuo et al. (1995), respectively. The dashed line represents the normalised occurrence rate of the time between PMAFs in optical data (Fasel, 1995). The statistical distribution of the high-time resolution radar data intervals is shown in Fig. 6b. The distribution of the common mode and high-time resolution data sets are very similar, which con®rms statistically that the common mode of opera-tion is capable of detecting PIFs, as demonstrated by Provan and Yeoman (1999). Furthermore, the similarity between the radar data, the spacecraft data, and the optical data is striking, especially considering that the measurements were taken in dierent regions of the magnetosphere by dierent instruments and that vastly dierent analysis techniques were employed. Because the FFTs of the LOS velocity time series include all ¯uctuations measured in the ionospheric plasma ¯ows, more ¯uctuations may be included in the statistical distribution than just those associated with FTEs, such as longer period IMF variations or more rapidly varying ULF waves (Milan et al., 1999). 4.2 IMF distribution
A preliminary survey of the IMF conditions seen by the WIND magnetic ®eld instrument during the intervals of pulsed ionospheric ¯ows seen by the CUTLASS Finland radar reveals no dependence on the IMF Bycomponent
and a strong dependence on the IMF Bzcomponent (see
Fig. 7). Of the intervals 67% occurred during southward IMF conditions, which lends support to the hypothesis that PIFs are a reconnection-related phenomenon. The IMF orientation in this study is consistent with the statistical studies of FTEs by Rijnbeek et al. (1984) and
Berchem and Russell (1984) who found a strong dependence on IMF Bz. The lack of a dependence on
the IMF By component contrasts with the results of
Provan et al. (1998) who found a preponderance of positive IMF Byintervals in the radar data. A similar By
bias in PMAFs was reported by Sandholt et al. (1992) and was attributed to the ®eld-aligned current orienta-tion (Saunders, 1989). The PIF identi®caorienta-tion technique of Provan et al. (1998) relied on a visual inspection of data from only one or two radar beams in the ®eld of view. This may have introduced some radar geometry eects. This is in contrast to the automated, quantitative technique for PIF analysis presented here, whose
Fig. 6a, b. The occurrence rate of the line of sight velocity ¯uctuation period for a 2-min (common mode) and b high-time resolution (7 to 21 s) CUTLASS Finland radar data. The solid and dotted lines are the distributions of inter-FTE intervals from ISEE spacecraft data
measured in the vicinity of dayside reconnection by Lockwood and Wild (1993) and Kuo et al. (1995), respectively. The dashed line is the distribution of the time between ground-based optical measurements of poleward moving auroral forms (Fasel, 1995)
Bz
By 16%
17%
34% 33%
Fig. 7. The IMF Y and Z dependence for all PIF intervals with a clear IMF orientation that were used to deduce the occurrence rate of the transient ¯ow periodicities used to deduce the distribution in Fig. 6. There is a strong dependence on the Bzcomponent, with 67%
of the intervals occurring during southward IMF conditions. There is no dependence on the Bycomponent of the IMF
strength lies in the objective nature of the analysis of velocity ¯uctuations across the entire radar ®eld of view. 5 Summary
PIFs have been established as the ionospheric electric ®eld signature of FTEs (Goertz et al., 1985; Elphic et al., 1990; Moen et al., 1995; Yeoman et al., 1997; Neudegg et al., 1999). Two-minute and 7 to 21 s HF radar data measured between March 1995 and Septem-ber 1996 by the CUTLASS Finland radar were studied to determine the statistical distribution of the repetition frequencies of ionospheric electric ®eld ¯uctuations in the footprint of the dayside magnetic reconnection region in order to make a comparison with in situ measurements of reconnection. The analysis technique was based on the Fourier transform, which was used to select the dominant repetition rates of the periodic ¯ow bursts seen along the radar line-of-sight. The velocity ¯uctuations were well grouped within the ®eld-of-view, and they were found in both the bursty poleward ¯ow and in the sunward return ¯ow at lower latitudes. 67% of the well-grouped PIF intervals occurred during southward IMF conditions, a strong indication that they are a reconnection-related phenomenon. No such IMF Bybias was observed.
The statistical distributions of the PIF repetition periods seen by CUTLASS agreed with satellite obser-vations of the inter-FTE interval (Lockwood and Wild, 1993; Kuo et al., 1995) and optical observations of poleward moving auroral forms (Fasel, 1995). The radar, therefore, appears to give an unbiased sample of the ionospheric footprint of magnetopause activity. Caution must be used when interpreting pulsed iono-spheric ¯ows in radar, optical and other data sets in this manner, however, since other phenomena, such as ULF waves, may be responsible for the pulsed nature of the velocity data.
The statistical distributions of the PIFs seen by CUTLASS were found to be independent of the temporal resolution of the scan mode, con®rming that the common mode of operation is useful for detecting pulsed ¯ows in the cusp. High-time resolution data is preferable, however, for studying the evolution of ¯ows. The radars have the advantage of routine observations of the cusp footprint and are therefore an extremely useful tool in the study of magnetopause activity. The analysis technique will be applied to additional Super-DARN radars to explore instrument geometry, local time, and interhemispheric eects.
Acknowledgements CUTLASS is supported by the Particle Physics and Astronomy Research Council (PPARC grant PPA/R/R/1997/ 00256), UK, the Swedish Institute for Space Physics, Uppsala, and the Finnish Meteorological Institute, Helsinki. K. McWilliams would like to thank S.E. Milan for many helpful discussions. The authors would like to thank the principal investigators R.P. Lepping and K. Ogilvie for the use of key parameter data from the WIND MFI and SWE instruments, respectively. K. McWilliams gratefully acknowledges graduate research funding from the Association of Commonwealth Universities of the British Council. G. Provan is supported by PPARC grant PPA/G/O/1997/00254.
The Editor in chief thanks C.T. Russell and another referee for their help in evaluating this paper.
References
Baker, K. B., J. R. Dudeney, R. A. Greenwald, M. Pinnock, P. T. Newell, A. S. Rodger, N. Mattin, and C.-I. Meng, HF radar signatures of the cusp and low-latitude boundary layer, J. Geophys. Res., 100, 7671±7695, 1995.
Berchem, J., and C. T. Russell, Flux transfer events on the magnetopause: spatial distribution and controlling factors, J. Geophys. Res., 89, 6689±6703, 1984.
Cowley, S. W. H., Solar wind control of magnetospheric convec-tion, in Achievement of the international magnetospheric study, IMS, pp. 483, Noorwijk, Netherlands, 1984.
Cowley, S. W. H. and M. Lockwood, Excitation and decay of solar wind-driven ¯ows in the magnetosphere-ionosphere system, Ann. Geophysicae, 10, 103, 1992.
Cowley, S. W. H., M. P. Freeman, M. Lockwood, and M. F. Smith, The ionospheric signature of ¯ux transfer events, in Cluster-dayside polar cusp, ESA SP-330, pp. 105, 1991.
Cowley, S. W. H., J. P. Morelli, M. P. Freeman, M. Lockwood, and M. F. Smith, Excitation and decay of ¯ows in the magneto-sphere-ionosphere system due to magnetic reconnection at the dayside magnetopause and in the geomagnetic tail, in Proc. International Conference on substorms, ESA SP-335, pp. 117, 1992.
Dungey, J. W., Interplanetary magnetic ®eld and the auroral zones, Phys. Rev. Lett., 6, 47, 1961.
Elphic, R. C., M. Lockwood, S. W. H. Cowley, and P. E. Sandholt, Flux transfer events at the magnetopause and in the ionosphere, Geophys. Res. Lett., 17, 2241±2244, 1990.
Fasel, G. J., Dayside poleward moving auroral forms: a statistical study, J. Geophys. Res., 100, 11 891±11 905, 1995.
Goertz, C. K., E. Nielsen, A. Korth, K. -H. Glaûmeier, C. Haldoupis, P. Hoeg, and D. Hayward, Observations of a possible ground signature of ¯ux transfer events, J. Geophys. Res., 90, 4069± 4078, 1985.
Greenwald, R. A., W. Weiss, E. Nielsen, and N. R. Thomson, STARE: a new radar auroral backscatter experiment in northern Scandinavia, Radio Sci., 13, 1021±1039, 1978. Greenwald, R. A., K. B. Baker, J. R. Dudeney, M. Pinnock,
T. B. Jones, E. C. Thomas, J.-P. Villain, J.-C. Cerisier, C. Senior, C. Hanuise, R. D. Hunsucker, G. Sofko, J. Koehler, E. Nielsen, R. Pellinen, A. D. M. Walker, N. Sato, and H. Yamagishi, DARN/SuperDARN: a global view of the dynamics of high-latitude convection, Space Sci. Rev., 71, 761± 796, 1995.
Haerendel, G., G. Paschmann, N. Sckopke, H. Rosenbauer, and P. C. Hedgecock, The frontside boundary layer of the magnetopause and the problem of reconnection, J. Geophys. Res., 83, 3195, 1978.
Karlson, K. A., M. éieroset, J. Moen, and P. E. Sandholt, A statistical study of ¯ux transfer event signatures in the dayside aurora: the IMF By-related prenoon-postnoon asymmetry,
J. Geophys. Res., 101, 59±68, 1996.
Kuo, H., C. T. Russell, and G. Lee, Statistical studies of ¯ux transfer events, J. Geophys. Res., 100, 3513±3519, 1995. Lepping, R. P., M. H. AcunÄa, L. F. Burlaga, W. M. Farrell, J. A.
Slavin, K. H. Schatten, F. Mariani, N. F. Ness, F. M. Neubauer, Y. C. Whang, J. B. Byrnes, R. S. Kennon, P. V. Panetta, J. Scheifele, and E. M. Worley, The WIND magnetic ®eld investigation, Space Sci. Rev., 71, 207±229, 1995.
Lockwood, M., Modelling the high-latitude ionosphere for time-varying plasma convection, Proc. I.E.E. (H), 140, 2, 91±100, 1993.
Lockwood, M. and M. A. Hapgood, On the cause of a magneto-spheric ¯ux transfer event, J. Geophys. Res., 103, 26 453± 26 478, 1998.
Lockwood, M., and M. N. Wild, On the quasi-periodic nature of magnetopause ¯ux transfer events, J. Geophys. Res., 98, 5935± 5940, 1993.
Lockwood, M., P. E. Sandholt, S. W. H. Cowley, and T. Oguti, Interplanetary magnetic ®eld control of dayside auroral activity and the transfer of momentum across the dayside magneto-pause, Planet. Space Sci., 67, 1347±1365, 1989.
Lockwood, M., S. W. H. Cowley, M. F. Smith, R. P. Rijnbeek, and R. C. Elphic, The contribution of ¯ux transfer events to convection, Geophys. Res. Lett., 22, 1185±1188, 1995.
Milan, S. E., T. K. Yeoman, M. Lester, E. C. Thomas, and T. B. Jones, Initial backscatter occurrence statistics from the CUTLASS HF radars, Ann. Geophysicae, 15, 703, 1997. Milan, S. E., T. K. Yeoman, M. Lester, J. Moen, and P. E.
Sandholt, Post-noon two-minute period pulsating aurora and their relationship to the dayside convection pattern, Ann.Geo-physicae, 17, 877±891, 1999.
Moen, J., P. E. Sandholt, M. Lockwood, W. F. Denig, U. P. Lùvhaug, B. Lybekk, A. Egeland, D. Opsvik, and E. Friis-Christensen, Events of enhanced convection and related dayside auroral activity, J. Geophys. Res., 23, 917±934, 1995.
Neudegg, D. A., T. K. Yeoman, S. W. H. Cowley, G. Provan, G. Haerendel, W. Baumjohann, U. Auster, K. -H. Fornacon, E. Georgescu, and C. J. Owen, A ¯ux transfer event observed at the magnetopause by the Equator-S spacecraft and in the ionosphere by the CUTLASS HF radar, Ann. Geophysicae, 17, 707±711, 1999.
éieroset, M., P. E. Sandholt, H. LuÈhr, W. F. Denig, and T. Mor-etto, Auroral and geomagnetic events at cusp/mantle latitudes in the prenoon sector during positive IMF By conditions: signatures of pulsed magnetopause reconnection, J. Geophys. Res., 102, 7191±7205, 1997.
Pinnock, M., A. S. Rodger, J. R. Dudeney, F. Rich, and K. B. Baker, High spatial and temporal resolution observations of the ionospheric cusp, Ann. Geophysicale, 13, 919±925, 1995. Provan, G., and T. K. Yeoman, Statistical observations of the MLT,
latitude and size of the ionospheric signature of ¯ux transfer events with the CUTLASS Finland radar, Ann.Geophysicae, 17, 855, 1999.
Provan, G., T. K. Yeoman, and S. E. Milan, CUTLASS Finland radar observations of the ionospheric signatures of ¯ux transfer events and the resulting plasma ¯ows, Ann. Geophysicae, 16, 1411±1422, 1998.
Provan, G., T. K. Yeoman, and S. W. H. Cowley, The in¯uence of the IMF By component on the location of the pulsed ¯ows in the dayside ionosphere observed by an HF radar, Geophys. Res. Lett., 26, 521±524, 1999.
Rijnbeek, R. P., S. W. H. Cowley, D. J. Southwood, and C. T. Russell, A survey of dayside ¯ux transfer events observed by ISEE 1 and 2 magnetometers, J. Geophys. Res., 89, 786±800, 1984
Rodger, A. S., and M. Pinnock, The ionospheric response to ¯ux transfer events: the ®rst few minutes, Ann. Geophysicae, 15, 685± 691, 1997.
Rodger, A. S., S. B. Mende, T. J. Rosenberg, and K. B. Baker, Simultaneous optical and HF radar observations of the ionospheric cusp, Geophys. Res. Lett., 22, 2045±2048, 1995. Russell, C. T., and R. C. Elphic, Initial ISEE magnetometer results:
magnetopause observations, Space Sci. Rev., 22, 681±715, 1978. Russell, C. T., and R. C. Elphic, ISEE observations of ¯ux transfer events at the dayside magnetopause, Geophys. Res. Lett., 6, 33± 36, 1979.
Sandholt, P. E., M. Lockwood, T. Oguti, S. W. H. Cowley, K. S. C. Freeman, B. Lebekk, A. Egeland, and D. M. Willis, Midday auroral breakup events and related energy and momentum transfer from the magnetosheath, J. Geophys. Res., 95, 1039±1060, 1990.
Sandholt, P. E., J. Moen, and D. Opsvik, Periodic auroral events at the midday polar cap boundary: implications of solar wind-magnetosphere coupling, Geophys. Res. Lett., 19, 1223±1226, 1992.
Saunders, M. A., Origin of the cusp Birkeland current, Geophys. Res. Lett., 16, 151±154, 1989.
Siscoe, G. L., and T. S. Huang, Polar cap in¯ation and de¯ation, J. Geophys. Res., 90, 543±547, 1985.
Van Eyken, A. P., H. Rishbeth, D. M. Willis, and S. W. H. Cowley, Initial EISCAT observations of plasma convection at invariant latitudes 70°±77°, J. Atmos. Terr. Phys., 46, 635±641, 1984. Vorobjev, V. G., G. Gustafsson, G. V. Starkov, Y. I. Feldstein, and
N. F. Shevnina, Dynamics of day and night aurora during substorms, Planet. Space Sci., 23, 269±278, 1975.
Yeoman, T. K., M. Lester, S. W. H. Cowley, S. E. Milan, J. Moen, and P. E. Sandholt, Simultaneous observations of the cusp in optical, DMSP and HF radar data, Geophys. Res. Lett., 24(17), 2251±2254, 1997.