HAL Id: hal-00298185
https://hal.archives-ouvertes.fr/hal-00298185
Submitted on 10 May 2007HAL is a multi-disciplinary open access
archive for the deposit and dissemination of sci-entific research documents, whether they are pub-lished or not. The documents may come from teaching and research institutions in France or abroad, or from public or private research centers.
L’archive ouverte pluridisciplinaire HAL, est destinée au dépôt et à la diffusion de documents scientifiques de niveau recherche, publiés ou non, émanant des établissements d’enseignement et de recherche français ou étrangers, des laboratoires publics ou privés.
South Atlantic island record reveals a South Atlantic
response to the 8.2 kyr event
K. Ljung, Siwan Björck, H. Renssen, D. Hammarlund
To cite this version:
K. Ljung, Siwan Björck, H. Renssen, D. Hammarlund. South Atlantic island record reveals a South Atlantic response to the 8.2 kyr event. Climate of the Past Discussions, European Geosciences Union (EGU), 2007, 3 (3), pp.729-753. �hal-00298185�
CPD
3, 729–753, 2007South Atlantic 8.2 kyr event K. Ljung et al. Title Page Abstract Introduction Conclusions References Tables Figures ◭ ◮ ◭ ◮ Back Close
Full Screen / Esc
Printer-friendly Version Interactive Discussion
EGU
Clim. Past Discuss., 3, 729–753, 2007 www.clim-past-discuss.net/3/729/2007/ © Author(s) 2007. This work is licensed under a Creative Commons License.
Climate of the Past Discussions
Climate of the Past Discussions is the access reviewed discussion forum of Climate of the Past
South Atlantic island record reveals a
South Atlantic response to the 8.2 kyr
event
K. Ljung1, S. Bj ¨orck1, H. Renssen2, and D. Hammarlund1 1
Geobiosphere Science Centre, Department of Geology, Quaternary Sciences, Lund University, S ¨olvegatan 12, 223 62 Lund, Sweden
2
Faculty of Earth and Life Sciences, Vrije Universiteit Amsterdam, De Boelelaan 1085, 1081 HV Amsterdam, Netherlands
Received: 24 April 2007 – Accepted: 25 April 2007 – Published: 10 May 2007 Correspondence to: K. Ljung (karl.ljung@geol.lu.se)
CPD
3, 729–753, 2007South Atlantic 8.2 kyr event K. Ljung et al. Title Page Abstract Introduction Conclusions References Tables Figures ◭ ◮ ◭ ◮ Back Close
Full Screen / Esc
Printer-friendly Version Interactive Discussion
EGU
Abstract
One of the most distinct climate fluctuations during the Holocene is the short and rapid event centred around 8200 years ago, the 8.2 kyr event, which was most likely trig-gered by glacial melt-water forcing from the receding Laurentide ice-sheet. Evidence for this cooling has primarily been reported from sites around the North Atlantic, but an
5
increasing number of observations imply a more wide-spread occurrence. Palaeocli-mate archives from the Southern Hemisphere have hitherto failed to uncover a distinct climatic anomaly associated with the 8.2 kyr event. Here we present a lake sediment record from Nightingale Island in the central South Atlantic showing enhanced precip-itation between 8275 and 8025 cal. yrs BP, most likely as a consequence of increased
10
sea surface temperature (SST). We show that this is consistent with climate model pro-jections of a warming of the South Atlantic in response to reduced north-ward energy transport during the 8.2 kyr event.
1 Introduction
The cooling associated with the 8.2 kyr event (Alley et al., 1997) is commonly attributed
15
to a weakening of the North Atlantic Deep Water (NADW) formation by rapid discharge of melt-water from ice-dammed lakes to the North Atlantic Ocean from the margin of the Laurentide Ice Sheet (Barber et al., 1999). Evidence for this cooling has primarily been reported from sites around the North Atlantic, but an increasing number of obser-vations imply a more wide-spread occurrence (Alley and ´Ag ´ustsd ´ottir, 2005; Rohling
20
and P ¨alike, 2005; Wiersma and Renssen, 2006). Coupled atmosphere-ocean model results (Bauer et al., 2004; LeGrande et al., 2006; Renssen et al., 2002; Renssen et al., 2001) indicate that such freshening of the North Atlantic caused a significant de-crease in the north-ward heat transport, leading to a warming of the South Atlantic, and resulting in increased SST and precipitation in the South Atlantic as a response
25
in-CPD
3, 729–753, 2007South Atlantic 8.2 kyr event K. Ljung et al. Title Page Abstract Introduction Conclusions References Tables Figures ◭ ◮ ◭ ◮ Back Close
Full Screen / Esc
Printer-friendly Version Interactive Discussion
EGU
vestigating the climatic signature and extent of the 8.2 kyr event, for testing the climate models, and any Holocene anti-phase behavior of north and south (Crowley, 1992; Stocker et al., 1992), the so-called bipolar seesaw effect (Broecker, 1998; Stocker, 1998). Although a relationship between seesawing and ice-rafting (IRD) events in the North Atlantic has been hypothesized (Broecker et al., 1999), no records with a clear
5
anti-phase response to the 8.2 kyr event, or other IRD events, have been found (Morrill and Jacobsen, 2005). Marine records from the South Atlantic (Piotrowski et al., 2004) and Tropical Atlantic (Arz et al., 2001) imply a weakening of NADW formation around 8000 cal. yrs BP, without a seesaw effect, while other South Atlantic records show no changes during this time (Nielsen et al., 2004).
10
The Tristan da Cunha island group is located at 37◦S in the central South Atlantic
(Figs. 1a and b), in the path of the westerlies at the northern limit of the West Wind Drift, and has a climate sensitive to atmospheric and oceanographic changes. Mean annual temperature is 14◦C and annual precipitation close to sea level at The Settlement is ca.
1500 mm, while values three times higher have been indicated for the more elevated
15
parts of the island. Abundant peat and lake deposits on the islands provide targets for studies of past hydrological changes (Ljung et al., 2006).
We retrieved a 9.6 m long sediment sequence from the central part of an overgrown lake on the small (3.2 km2) Nightingale Island (Fig. 1c, Fig. 2). This fen, situated at ca. 180 m above sea level, is called 2nd Pond and has a size of ca. 1 ha. It is a
20
distinct basin with no in- or outlets. Scirpus sp. and Sphagnum sp. dominate the fen vegetation, while thick tussock-grass dominated by Spartina arundinaceae and
Poa flabellata cover most of the island. Trees (Phylica arborea) , tree ferns (Blechnum palmiforme) and associated shade-tolerant species (Nertera sp., Polypodiaceae) are
restricted to slopes and higher areas.
25
Here we present a palaeoclimatic reconstruction based on a multi-proxy study, in-cluding magnetic susceptibility, pollen analysis, and determination of total carbon (TC), nitrogen (TN) and sulphur (TS) content, of the lower part of this sequence, which cov-ers the time period 10 700 to 7000 cal. yrs BP (Figs. 2 and 3). The emphasis is on
CPD
3, 729–753, 2007South Atlantic 8.2 kyr event K. Ljung et al. Title Page Abstract Introduction Conclusions References Tables Figures ◭ ◮ ◭ ◮ Back Close
Full Screen / Esc
Printer-friendly Version Interactive Discussion
EGU
the 8.2 kyr event, which is distinctly expressed in the sequence, and its coupling to the Atlantic Ocean circulation. We compare our results with a simulation of the 8.2 kyr BP event performed with a coupled atmosphere-ocean climate model.
2 Methods
2.1 Coring, lithological descriptions and correlations
5
The sediment sequence was recovered with a 5 cm Russian chamber corer. All cores were visually described in the field and in detail in the laboratory. Special attention was paid to any signs of potential volcanic ash layers (tephras). Correlations between overlapping cores were carried out visually and with the aid of magnetic susceptibility measurements.
10
2.2 Radiocarbon dating
The chronology is based on 14C measurements performed at the Compact Carbon AMS laboratory in Poznan, Poland, and the Single Stage AMS laboratory in Lund, Sweden. The measurements were obtained on macroscopic plant remains and bulk sediment samples. Radiocarbon ages were converted to calibrated ages using the
15
program OxCal v3.10 (Bronk Ramsey, 1995, 2001) and the SHCal04 calibration data-set (McCormac et al., 2004). The age model was constructed by visually fitting lines through the calibrated radiocarbon dates, and adjusting sedimentation rate changes according to the lithology and lithologic changes displayed in the sequence.
2.3 Total carbon, nitrogen and sulphur measurements
20
Total carbon, nitrogen and sulphur were obtained on dried and homogenized samples using a Costech Instruments ECS 4010 elemental analyzer. Measurement accuracy
CPD
3, 729–753, 2007South Atlantic 8.2 kyr event K. Ljung et al. Title Page Abstract Introduction Conclusions References Tables Figures ◭ ◮ ◭ ◮ Back Close
Full Screen / Esc
Printer-friendly Version Interactive Discussion
EGU
is better than ±5% of the reported values based on replicated standard samples. C/N atomic ratios were obtained by multiplying by 1.67 (Bengtsson and Enell, 1986).
If no inorganic carbon, i.e. no carbonates, are present, TC and TN contents are directly related to organic matter content, and the C/N ratio can be used to asses the proportion of terrestrial versus aquatic organic matter in the sediments (Meyers and
5
Teranes, 2001).
2.4 Magnetic susceptibility measurements
Magnetic susceptibility was measured at 4 mm increments using a Bartington Instru-ments MS2EI magnetic susceptibility high-resolution surface scanning sensor cou-pled to a TAMISCAN automatic logging conveyor. Magnetic susceptibility reflects the
10
minerogenic content of the sediments and provides a proxy for in-wash from the catch-ment (Thompson and Oldfield, 1986).
2.5 Pollen analysis
Pollen samples of c. 1 cm3were processed following standard method A (Berglund and Ralska-Jasiewiczowa, 1986), with added Lycopodium spores. The counting was made
15
under a light microscope at magnifications of ×400 and ×1000. Pollen grains were identified by the help of published photos (Hafsten, 1960), standard pollen keys (Moore et al., 1991), and a small collection of type slides prepared by U. Hafsten and borrowed from the Botanical Museum in Bergen, Norway. Zonation of the pollen diagram is based on the variation of the major taxa and follows the result from the principal component
20
analysis.
2.6 Principal component analysis
Principal component analysis (PCA) was performed in MATLAB using the function prin-comp. Undetermined pollen grains were excluded from the analysis. The percentage
CPD
3, 729–753, 2007South Atlantic 8.2 kyr event K. Ljung et al. Title Page Abstract Introduction Conclusions References Tables Figures ◭ ◮ ◭ ◮ Back Close
Full Screen / Esc
Printer-friendly Version Interactive Discussion
EGU
data were normalized and standardized prior to analysis. PCA was used to extract the major variation from the total pollen percentage dataset.
2.7 Climate model and experimental design
We have performed the simulation of the 8.2 kyr event with version 2 of the ECBilt-CLIO coupled atmosphere-ocean model. The atmospheric component is ECBilt, an
at-5
mospheric model (T21 horizontal resolution, three layers) based on quasi-geostrophic equations (Opsteegh et al., 1998). As an extension to the quasi-geostrophic equations, an estimate of the neglected terms in the vorticity and thermodynamic equations is in-cluded as a temporally and spatially varying forcing. This forcing is calculated from the diagnostically derived vertical motion field and leads to a considerable improvement
10
of the simulation of the Hadley Cell circulation, resulting in a better representation of the strength and position of the jet stream and transient eddy activity. ECBilt resolves synoptic variability associated with weather patterns. ECBilt is coupled to CLIO, an oceanic general circulation model (3◦×3◦ latitude-longitude horizontal resolution, 19 layers in the vertical) coupled to a comprehensive dynamic-thermodynamic sea-ice
15
model (Goosse and Fichefet, 1999). The ECBilt-CLIO model reproduces the modern climate (Goosse et al., 2001; Renssen et al., 2002) reasonably well.
The simulation experiment on the 8.2 kyr event was designed as follows. First, start-ing from a modern quasi-equilibrium state, the model was run for 550 years with forc-ings for 8.5 kyr BP to obtain an early Holocene climate state (Renssen et al., 2002).
20
These forcings are orbital parameters (Berger, 1978), greenhouse gas concentrations (Raynaud et al., 2000), modified surface albedo in northern Africa to account for a “green” Sahara (Adams and Faur ´e, 1997), and modified surface albedo and surface elevation in North America to represent the remnant Laurentide Ice Sheet (Peltier, 1994). At the end of the 550 years, the trend in the global ocean temperature was
25
only –0.007◦C/century. Second, this 8.5 kyr BP early Holocene quasi-equilibrium state was perturbed by releasing a freshwater pulse in the Labrador Sea that represents the catastrophic drainage from Lakes Agassiz and Ojibway and the collapse of the
Lauren-CPD
3, 729–753, 2007South Atlantic 8.2 kyr event K. Ljung et al. Title Page Abstract Introduction Conclusions References Tables Figures ◭ ◮ ◭ ◮ Back Close
Full Screen / Esc
Printer-friendly Version Interactive Discussion
EGU
tide Ice Sheet Dome over the Hudson Bay. Different freshwater volumes and release rates were tested (Renssen et al., 2002). After the introduction of the freshwater per-turbations, the experiments were continued for at least 500 years. Here we present results from one particular experiment that produced a climate anomaly that was clos-est to what is suggclos-ested by proxy data on the 8.2 kyr event, both in terms of magnitude
5
and duration (Renssen et al., 2002; Wiersma and Renssen, 2006). In this experiment, we released a constant freshwater flux of 0.75 Sv (1 Sv = 1×10⁶m3/s) in the Labrador Sea during 20 years, implying a total volume of 4.67×10¹⁴m3. This freshwater volume is close to the highest estimate for the 8.2 kyr event based on geological data (Von Grafenstein et al., 1999).
10
3 Results
3.1 Chronology and climate reconstruction
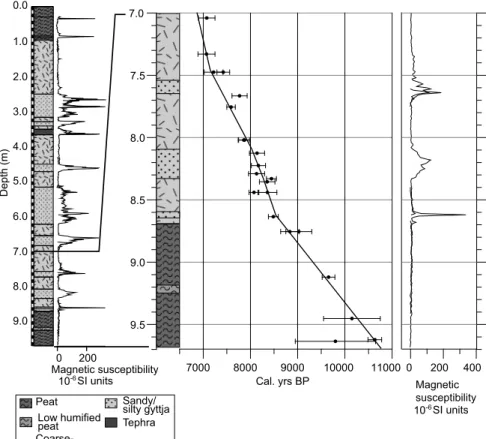
The depth-age relationship of the lowermost 2.5 m was determined by 22 14C mea-surements (Fig. 2, Table 1). The results from this part of the sequence, covering the time period from 10 750 to 7000 cal. yrs BP, are presented in Figs. 2 and 3. The
tem-15
poral resolution of the magnetic susceptibility data is ca. 10 years, equivalent to the geochemical data for the period 8300–7500 cal. yrs BP. The rest of the geochemical record has ca. 20 year resolution, although the pollen record is of lower resolution (30–60 years at 8600–7400 cal. yrs BP and 70–150 years in the oldest part of the sequence). We estimate that the age envelope of the age model is at least ±25 years.
20
The lower part of the sediment sequence consists of bog peat with a variable de-gree of humification (Fig. 2). The peat is overlain by lacustrine sediments (gyttja) with low minerogenic content, with this gradual transition at 8.7–8.6 m dated to 8800– 8600 cal. yrs BP. The highly organic gyttja is interspersed with distinct units of silty gyttja at 8.33–8.09 m and at 7.65–7.55 m. In this volcanic bedrock region the
minero-25
CPD
3, 729–753, 2007South Atlantic 8.2 kyr event K. Ljung et al. Title Page Abstract Introduction Conclusions References Tables Figures ◭ ◮ ◭ ◮ Back Close
Full Screen / Esc
Printer-friendly Version Interactive Discussion
EGU
closely follows the lithological changes. In the lowermost peat (9.7–8.7 m) the magnetic susceptibility is very low and remains low after the transition to gyttja. The exception is a temporary susceptibility increase at ca. 8550 cal. yrs BP (Fig. 3), which is likely re-lated to in-wash processes connected to the bog-to-lake transition. Within the two silty gyttja units at 8.33–8.09 m and 7.65–7.55 m (Fig. 3), magnetic susceptibility increases
5
markedly. The lower of these units was dated to 8275–8025 cal. yrs BP, making it syn-chronous with the Northern Hemisphere 8.2 kyr event (Alley et al., 1997). The upper silty gyttja unit is dated to 7500–7300 cal. yrs BP (Fig. 3).
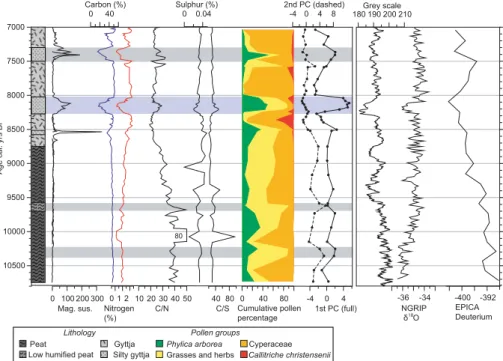
Total carbon content of the peat and the overlying gyttja ranges from 40 to 45%, which corresponds to at least 80–90% organic matter due to absence of inorganic
10
carbon (Fig. 3). During the increase in minerogenic matter at 8275–8025 cal. yrs BP, total carbon content drops to 16%, and at 7500–7300 cal. yrs BP a minimum of 15% is reached. TC/TN ratios of the fen peat generally exceed 40 with a maximum above 80, which indicates dominance of terrestrial organic matter (Meyers, 2003). TC/TN ratios in the range of 20–30 characterize the lacustrine part of the sequence, with higher
15
values at 8275–8025 and 7500–7300 cal. yrs BP.
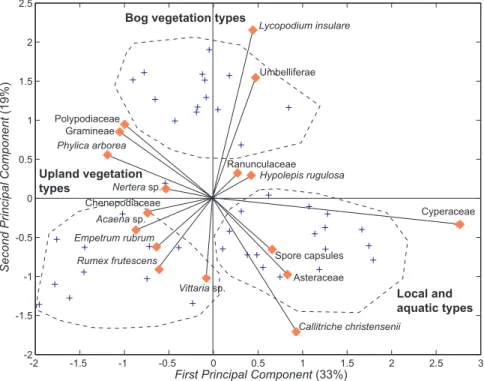
The pollen data show large variations which generally follow the lithological changes and variations in the other proxies (Fig. 4). Principal component analysis (PCA) was used to extract the major variation in the pollen percentage data (Fig. 5). The first two axes explain 33% and 19% of the total variance, respectively. The first axis values
20
are primarily determined by Cyperaceae, having the highest scores, and Phylica
ar-borea, Acaena sp., Polypodiaceae, Empetrum rubrum, Gramineae, Chenopodiaceae
and Rumex frutescens, which have the lowest (negative) scores. The second axis val-ues are primarily driven by the low negative scores of Callitriche christensenii and the high positive scores of Lycopodium insulare. These two PCA axes divide the pollen
25
assemblage into different habitat groups: the 1st axis separates local littoral vegetation (Cyperaceae and Callitriche christensenii), dominating pollen zones 2, 4 and 6, from more distal catchment taxa (Phylica arborea, Empetrum rubrum, Acaena sp., Rumex
CPD
3, 729–753, 2007South Atlantic 8.2 kyr event K. Ljung et al. Title Page Abstract Introduction Conclusions References Tables Figures ◭ ◮ ◭ ◮ Back Close
Full Screen / Esc
Printer-friendly Version Interactive Discussion
EGU
separates the typical bog species Lycopodium insulare , present in pollen zone 1, from the aquatic species Callitriche christensenii, present in pollen zones 2–6. The 1st axis sample scores are closely correlated with TC content (r=0.8, P <0.001), TN content (r=0.6, P <0.001) and magnetic susceptibility (r=0.8, p<0.001).
3.2 Model results
5
In our experiment of the 8.2 kyr event there is a clear increase in relative humidity over the SE Atlantic as a response to the North Atlantic THC weakening, as well as higher SST’s (Fig. 6). This is especially evident during August–October, which is the period with the largest increases in temperature and precipitation in the model. This confirms that in our model the precipitation increases are related to higher SST’s, following the
10
principle: warmer surface ocean, more evaporation, higher air humidity, more precipi-tation.
It should be noted that, when compared to comprehensive coupled GCMs, our model of intermediate complexity simulates a weak response of the hydrological cycle to a THC weakening. We have chosen to use a model of intermediate complexity for our
15
study on the 8.2 kyr event because this has enabled us to perform a range of multi-centennial runs to test different freshwater scenarios (Renssen et al., 2002). These experiments would not have been feasible with coupled GCMs. As presented in the recent model-intercomparison by Stouffer et al. (2006), coupled GCMs simulate a pro-nounced southward shift in the ITCZ over the South Atlantic as a response to a THC
20
perturbation, a response that is underestimated in our model. However, the GCM re-sults show that the precipitation increase that is associated with this southward ITCZ shift is restricted to the latitudinal band ranging from 0 to 30◦S, so considerably north of Nightingale Island (at about 37◦S). However, the coupled GCMs show a secondary
precipitation increase over the South Atlantic between 35 and 40◦S as a response to
25
the THC weakening. This secondary precipitation maximum is modest (about +11% in their 1 Sv perturbation runs) compared to the primary precipitation maximum as-sociated with the ITCZ shift (up to +100% in the 1 Sv perturbation runs). Stouffer et
CPD
3, 729–753, 2007South Atlantic 8.2 kyr event K. Ljung et al. Title Page Abstract Introduction Conclusions References Tables Figures ◭ ◮ ◭ ◮ Back Close
Full Screen / Esc
Printer-friendly Version Interactive Discussion
EGU
al. (2006) provide no explanation for this secondary precipitation maximum, but it is noteworthy that in the GCMs the ocean surface is considerably warmer at this latitude in the South Atlantic, so that it is likely that there is a link (higher precipitation due to higher SST) as is also seen in our model results.
4 Discussion
5
The pattern in most of our proxy records can be explained in terms of variations in effective humidity and precipitation. The basal peat indicates an at least 9 m lower wa-ter table than at present. The bog-to-lake transition must be the result of significantly increased effective humidity. This implies that a major change of the general circu-lation pattern took place around 8800 cal. yrs BP, likely reflecting the establishment
10
of the present-day circulation regime, due to a meridional shift of the regional fronts. In fact, marine studies in the Atlantic sector of the Southern Ocean (Nielsen et al., 2004) and land-based studies in South America imply that the westerlies intensified after 9000 cal. yrs BP (Mayr et al., 2007). Temperature reconstructions from Antarctic ice cores show that the Holocene thermal optimum came to an end at about this time
15
(Epica community members, 2004; Masson et al., 2000) (Fig. 3), which resulted in expanded sea ice cover and steeper meridional temperature gradient in the Southern Ocean. Model studies have shown that changes in sea ice extent also causes cor-responding changes in the position of the westerlies (Hudson and Hewitson, 2001). Thus, it is likely that the westerlies strengthened and shifted northwards in the South
20
Atlantic region at the end of the Antarctic thermal optimum around 9000–8500 cal. yrs BP, as a result of increased meridional temperature gradient and expanded sea ice. The change from peat growth to gyttja deposition and declining bog species and the appearance of aquatic species in the pollen diagram represented by lower values on the 2nd PCA axis (Fig. 3), are direct effects of this precipitation increase.
25
At 8275 cal. yrs BP we note enhanced influx of minerogenic and terrestrial organic matter, and increased deposition of pollen types from more remote parts of the
catch-CPD
3, 729–753, 2007South Atlantic 8.2 kyr event K. Ljung et al. Title Page Abstract Introduction Conclusions References Tables Figures ◭ ◮ ◭ ◮ Back Close
Full Screen / Esc
Printer-friendly Version Interactive Discussion
EGU
ment. We believe that these simultaneous changes in lithology, minerogenic content, TC/TN ratio and pollen content (Fig. 3) could only have been caused by increased sur-face run-off in response to increased precipitation. This led to increased catchment erosion and higher input of terrestrial detritus to the basin. This also explains the si-multaneous increase in pollen from taxa favoured by open ground, such as Rumex
5
frutescens , and closed forest species, such as Phylica arborea. It is unlikely that this
pollen assemblage change represents a true vegetation change since an expansion of forest would limit open ground taxa and vice versa. Therefore we conclude that the stratigraphic changes at 8275–8025 cal. yrs BP reflect a period of increased precipita-tion on Nightingale Island.
10
At present, stronger westerlies or higher SSTs, the latter generating increased air hu-midity, are the main agents behind enhanced precipitation in the study area. So, which of these possible mechanisms triggered the changes we see? Intensified westerlies are connected to higher wind speeds, resulting in increased concentrations of sea spray, with sea salt sulphates as one important marine aerosol component in coastal
15
areas. We note the low TS values (Fig. 3) at this time, which can be explained as both an effect of lower organic carbon content and lower sulphur concentrations in the aerosols. Furthermore, the higher TC/TS values show that the relative decline in TS content was larger than that of TC. This is a strong indication that concentrations of sea salt sulphates in the aerosols of Nightingale Island were not higher, but rather lower,
20
during the stratigraphic changes at 8275–8025 cal. yrs BP. We therefore hypothesize that the increase in evaporation was caused by higher SST’s.
The age of 8275–8025 cal. yrs BP for the inferred precipitation increase at 8.33– 8.09 m is firmly established by the radiocarbon dates and allows for detailed correlation with other climate archives. The onset of changes is coeval with the onset of the
25
8.2 kyr event in the new NGRIP ice core, where it is dated to 8260 cal. yrs BP (Ras-mussen et al., 2006), as well as with the shift in the Cariaco Basin grey scale record (Hughen et al., 2000), dated to 8290 cal. yrs BP (Fig. 3), and with the inferred decline in North Atlantic meridional overturning circulation at 8290 cal. yrs BP (Ellison et al.,
CPD
3, 729–753, 2007South Atlantic 8.2 kyr event K. Ljung et al. Title Page Abstract Introduction Conclusions References Tables Figures ◭ ◮ ◭ ◮ Back Close
Full Screen / Esc
Printer-friendly Version Interactive Discussion
EGU
2006). The inferred increase in precipitation at 8275–8025 cal. yrs BP is consistent with different model simulations of the 8.2 kyr event (Bauer et al., 2004; LeGrande et al., 2006; Renssen et al., 2002; Renssen et al., 2001). Our coupled atmosphere-ocean model simulations show statistically significant (at 95% level) increases in SST (by 0.2 to 0.5◦C in annual mean) and precipitation (by 10 to 60 mm/yr in annual mean) over the
5
South Atlantic in response to a freshwater-induced weakening of the THC (Wiersma and Renssen, 2006) (Fig. 6). In the model, the warming is related to reduced north-ward heat transport in the Atlantic Ocean, causing heat to accumulate in the South Atlantic, the so-called bipolar seesaw effect, and the warmer surface waters in turn stimulate precipitation in the study region. These model results support our hypothesis
10
that higher SSTs triggered the increased precipitation at our site. Furthermore, the increase in precipitation over Nightingale Island as a response of a warmer ocean was probably stronger than suggested by the model (Fig. 6), as the local topography of the
>300 m high island causes forced lifting of passing air masses, resulting in distinctly
higher precipitation than modeled. The model also shows that the westerlies were not
15
strengthened over the South Atlantic during the 8.2 kyr event. Thus the increase in precipitation at 8275–8025 cal. yrs BP is not only coeval with the 8.2 ka event but also shows the response predicted by our climate model (Fig. 6). We therefore conclude that this change is the South Atlantic expression of the 8.2 ka event.
Our data do not show any indication of a supposed general climate anomaly starting
20
at 8500 cal. yrs BP and lasting 500–700 years (Keigwin et al., 2005; Rohling and P ¨alike, 2005), but only register the more restricted 8.2 kyr event. The duration of the event in our record is approximately 250 years, which is longer than the 160–180 years of the 8.2 kyr event in the NGRIP (Rasmussen et al., 2006) and Cariaco Basin records (Hughen et al., 2000). If this anomaly is correct it may possibly be explained by the
25
thermal inertia of the ocean.
The very similar changes in proxy data at 7500–7300 cal. yrs BP compared to those at 8275–8025 kyr BP (Fig. 3) indicate that this period was also characterized by in-creased precipitation. This implies that these periods of inin-creased precipitation were
CPD
3, 729–753, 2007South Atlantic 8.2 kyr event K. Ljung et al. Title Page Abstract Introduction Conclusions References Tables Figures ◭ ◮ ◭ ◮ Back Close
Full Screen / Esc
Printer-friendly Version Interactive Discussion
EGU
not unique, but are part of a pattern of recurring Holocene events. It is therefore note-worthy that our event at 7500-7300 kyr BP coincides with one of the most distinct Holocene North Atlantic IRD peaks/14C production maxima (Bond et al., 2001). Fur-thermore, in spite of a different hydrological regime before 8800 cal. yrs BP, with peat accumulation instead of lake sedimentation, we note that our pollen data display two
5
peaks in the 2nd axis P C values (Fig. 3), which are caused by high frequencies of the bog species Lycopodium insulare . The uppermost of these peaks also coincides with a period of lower humified peat. Thus, these two periods represents wetter conditions at the bog. The two periods are separated by high Phylica arborea and Polypdiaceae frequencies, and high content of Blechnum palmiforme remains, which indicates a
10
drier tree covered bog surface. The two wetter periods are dated to 10 300–10 500 and 9600–9700 cal. yrs BP, respectively, and thus coincides with two cold phases in the Atlantic region (Bj ¨orck et al., 2001; Bond et al., 2001). We also note that several lithological changes similar to the ones at 8275–8025 and 7500–7300 cal. yrs BP oc-cur throughout the rest of the core. This implies that the 8.2 kyr event was not the
15
only period of increased precipitation on Nightingale Island during the Holocene, and it may suggest that changes in the meridional overturning circulation was a recurring phenomenon throughout the Holocene. This is in agreement with the variable Atlantic circulation inferred from marine sediment cores (Bond et al., 2001).
It has been shown that NADW formation and the strength of THC have varied
20
throughout the Holocene and that a weakened THC during the 8.2 kyr event was only one of several similar events (Hall et al., 2004; Oppo et al., 2003). This scenario is sup-ported by our data, although it may be difficult to comprehend why large-scale glacial lake drainage did not perturb the THC significantly more than at other periods of weak THC. One explanation may be that the 8.2 kyr event is an anomaly with a different
trig-25
gering mechanism, as compared to most of the other Holocene events, where solar forcing and related feedbacks have been invoked as major players (Bond et al., 2001).
CPD
3, 729–753, 2007South Atlantic 8.2 kyr event K. Ljung et al. Title Page Abstract Introduction Conclusions References Tables Figures ◭ ◮ ◭ ◮ Back Close
Full Screen / Esc
Printer-friendly Version Interactive Discussion
EGU
5 Conclusions
The results show that our island paleoclimate record from the central South Atlantic responded to the North Atlantic 8.2 kyr BP cooling with an increase in precipitation. This was most likely caused by increased SSTs in the surrounding ocean, which is also demonstrated by modelling the coupled atmosphere-ocean response to an 8.2 kyr
5
BP freshwater pulse into the North Atlantic. This is the first clear demonstration of a climatic response in the South Atlantic to the 8.2 kyr BP event, and it shows that the disruption of NADW formation caused by the drainage of the Laurentide ice-dammed lakes also affected the central South Atlantic.
Acknowledgements. This study was supported by the Swedish Research Council (VR) through
10
grants to SB’s ‘Atlantis’ project (G 5103-20005076/2000). HR is sponsored by the Nether-lands Organization for Scientific Research (N.W.O). We are grateful to the Botanical Museum in Bergen for borrowing Ulf Hafsten’s pollen type collection from the islands. We thank O. Ben-nike, J. Glass and M. Green for field work assistance and J. and F. Glass and several other Tristan islanders for general logistic support.
15
References
Adams, J. M. and Faur ´e, H.: Review and Atlas of Palaeovegetation: Preliminary land ecosys-tem maps of the world since the Last Glacial Maximum. Oak Ridge National Laboratory, TN, USA, 1997.
Alley, R. B. and ´Ag ´ustsd ´ottir, A. M.: The 8 k event: cause and consequences of a major 20
Holocene abrupt climate change, Quat. Sci. Rev. 24, 1123–1149, 2005.
Alley, R. B., Mayewski, P. A., Stuiver, M., Taylor, K. C., and Clark, P. U.: Holocene climatic instability: A prominent, widespread event 8200 yr ago, Geology, 25, 483–486, 2007. Arz, H. W., Gerhardt, S., P ¨atzold, J., and R ¨ohl, U.: Millennial-scale changes of surface- and
deep-water flow in the western tropical Atlantic linked to Northern Hemisphere high-latitude 25
climate during the Holocene, Geology, 29, 239–242, 2001.
Barber, D. C., Dyke, A., Hillaire-Marcel, C., Jennings, A. E., Andrews, J. T., Kerwin, M. W., Bilodeau, G., McNeely, R., Southon, J., Morehead, M. D., and Gagnon, J. M.: Forcing of
CPD
3, 729–753, 2007South Atlantic 8.2 kyr event K. Ljung et al. Title Page Abstract Introduction Conclusions References Tables Figures ◭ ◮ ◭ ◮ Back Close
Full Screen / Esc
Printer-friendly Version Interactive Discussion
EGU the cold event of 8200 years ago by catastrophic drainage of Laurentide lakes, Nature, 400,
344–348, 1999.
Bauer, E., Ganopolski, A., and Montoya, M.: Simulation of the cold climate event 8200 years ago by meltwater outburst from Lake Agassiz, Paleoceanography, 19, PA001030, doi:10.1029/2004PA001030, 2004.
5
Bengtsson, L. and Enell, M.: Chemical analysis, in: Handbook of Holocene Palaeoecology and Palaeohydrology, edited by: Berglund, B. E., Jhon Wiley & Sons Ldt, Chichester, 423–451, 1986.
Berger, A. L.: Long-term variations of daily insolation and Quaternary climatic changes, J. Atmos. Sci., 35, 2363–2367, 1978.
10
Berglund, B. E., and Ralska-Jasiewiczowa, M.: Pollen analysis and pollen diagrams, in: Hand-book of Holocene palaeoecology and palaeohydrology, edited by: Berglund, B. E., Wiley, Chichester, 455–484, 1986.
Bj ¨orck, S., Muscheler, R., Kromer, B., Andresen, C. S., Heinemeier, J., Johnsen, S. J., Conley, D., Koc¸, N., Spurk, M., and Veski, S.: High-resolution analyses of an early Holocene climate 15
event may imply decreased solar forcing as an important climate trigger, Geology, 29, 1107– 1110, 2001.
Bond, G., Kromer, B., Beer, J., Muscheler, R., Evans, M. N., Showers, W., Hoffman, S., Lotti-Bond, R., Hajdas, I., and Bonani, G.: Persistent solar influence on North Atlantic climate during the Holocene, Science, 294, 2130–2136, 2001.
20
Broecker, W. S.: Paleocean circulation during the last deglaciation: A bipolar seesaw?, Paleo-ceanography, 13, 119–121, 1998.
Broecker, W. S., Sutherland, S., and Tsung-Hung, P.: A possible 20th-century slowdown of southern ocean deep water formation, Science, 286, 1132–1135, 1999.
Bronk Ramsey, C.: Radiocarbon calibration and analysis of stratigraphy: The OxCal program, 25
Radiocarbon, 37, 425–430, 1995.
Bronk Ramsey, C.: Development of the radiocarbon program OxCal, Radiocarbon, 43, 381– 389, 2001.
Crowley, T. J.: North Atlantic deep water cools the Southern Hemisphere, Paleoceanography, 7, 489–497, 1992.
30
Ellison, C. R. W., Chapman, M. R., and Hall, I. R.: Surface and deep ocean interactions during the cold climate event 8200 years ago, Science, 312, 1929–1932, 2006.
CPD
3, 729–753, 2007South Atlantic 8.2 kyr event K. Ljung et al. Title Page Abstract Introduction Conclusions References Tables Figures ◭ ◮ ◭ ◮ Back Close
Full Screen / Esc
Printer-friendly Version Interactive Discussion
EGU 628, 2004.
Goosse, H. and Fichefet, T.: Importance of ice-ocean interactions for the global ocean circula-tion: a model study, J. Geophys. Res., 104, 23 337–23 355, 1999.
Goosse, H., Selten, F. M., Haarsma, R. J., and Opsteegh, J. D.: Decadal variability in high northern latitudes as simulated by an intermediate-complexity climate model, Ann. Glac., 5
33, 525–532, 2001.
Hafsten, U.: Pleistocene development of vegetation and climate in Tristan da Cunha and Gough Island. Arbok Univeristetet i Bergen, Mat.-Naturv. Serie. A, 20, 1–45, 1960.
Hall, I. R., Bianchi, G. G., and Evans, J. R.: Centennial to millennial scale Holocene climate-deep water linkage in the North Atlantic, Quat. Sci. Rev., 23, 1529–1536, 2004.
10
Haug, G. H., Hughen, K. A., Peterson, L. C., Sigman, D. M., and Rohl, U.: Southward migration of the Intertropical Convergence Zone through the Holocene, Science, 293, 1304–1308, 2001.
Hudson, D. A. and Hewitson, B. C.: The atmospheric response to a reduction in summer Antarctic sea-ice extent, Clim. Res., 16, 76–99, 2001.
15
Hughen, K. A., Southon, J. R., Lehman, S., and Overpeck, J.: Synchronous radiocarbon and climate shifts during the last deglaciation, Science, 290, 1951–1955, 2000.
Keigwin, L. D., Sachs, J. P., Rosenthal, Y., and Boyle, E. A.: The 8200 year B.P. event in the slope water system, western subpolar North Atlantic, Paleoceanography, 20, PA001074, doi:10.1029/2004PA001074, 2005.
20
LeGrande, A. N., Schmidt, G. A., Shindell, D. T., Field, C. V., Miller, R. L., Koch, D. M., Faluvegi, G., and Hoffman, G.: Consistent simulations of multiple proxy responses to an abrupt climate change event, Proc. Natl. Acad. Sci., 103, 837–842, 2006.
Ljung, K., Bj ¨orck, S., Hammarlund, D., and Barnekow, L.: Late Holocene multi-proxy records of environmental change on the South Atlantic island Tristan da Cunha, Palaeogeogr. Palaeo-25
clim. Palaeoecol., 241, 539–560, 2006.
Masson, V., Vimeux, F., Jouzel, J., Morgan, V., Delmotte, M., Ciais, P., Hammer, C., Johnsen, S., Lipenkov, V. Y., Mosley-Thompson, E., Petit, J.-R., Steig, E. J., Stievenard, M., and Vaik-mae, R.: Holocene Climate Variability in Antarctica Based on 11 Ice-Core Isotopic Records, Quat. Res. 54, 348–358, 2000.
30
Mayr, C., Wille, M., Haberzettl, T., Fey, M., Janssen, S., L ¨ucke, A., Ohlendorf, C., Oliva, G., Sch ¨abitz, F., Schleser, G. H., and Zolittschka, B.: Holocene variability of the Southern Hemi-sphere westerlies in Argentinean Patagonia (52S), Quat. Sci. Rev., 26, 579–584, 2007.
CPD
3, 729–753, 2007South Atlantic 8.2 kyr event K. Ljung et al. Title Page Abstract Introduction Conclusions References Tables Figures ◭ ◮ ◭ ◮ Back Close
Full Screen / Esc
Printer-friendly Version Interactive Discussion
EGU McCormac, F. G., Hogg, A. G., Blackwell, P. G., Buck, C. E., Higham, T. F. G., and Reimer, P. J.:
SHCal04 Southern Hemisphere Calibration, 0 - 11 kyr cal BP, Radiocarbon, 46, 1087–1092, 2004.
Meyers, P. A.: Applications of organic geochemistry to paleolimnological reconstructions: a summary of examples from the Laurentian Great Lakes, Org. Geochem., 34, 261–289, 2003. 5
Meyers, P. A. and Teranes, J. L.: Sediment organic matter, in: Tracking environmental cange using lake sediments, edited by: Last, W. M. and Smol, J. P., Kluwer Academic Publishers, Dordrecht, 239–269, 2001.
Moore, P. D., Webb, J. A., and Collinson, M. E.: Pollen analysis. Blackwell Scientific, Oxford, 1991.
10
Morrill, C. and Jacobsen, R. M.: How widespread were the climate anomalies 8200 years ago?, Geophys. Res. Lett., 32, L19701, doi:10.1029/2005GL023536, 2005.
Nielsen, S. H. H., Koc, N., and Crosta, X.: Holocene climate in the Atlantic sector of the South-ern Ocean: controlled by insolation or oceanic circulation?, Geology, 32, 317–320, 2004. Oppo, D. W., McManus, J. F., and Cullen, J. L.: Deepwater variability in the Holocene epoch, 15
Nature, 422, 277–279, 2003.
Opsteegh, J. D., Haarsma, R. J., Selten, F. M., and Kattenberg, A.: ECBILT: a dynamic alter-native to mixed boundary conditions in ocean models, Tellus 50A, 348–367, 1998.
Peltier, W. R.: Ice age paleotopography, Science, 265, 195–201, 1994.
Piotrowski, A. M., Goldstein, S. L., Hemming, S. R., and Fairbanks, R. G.: Intensification and 20
variability of ocean thermohaline circulation through the last deglaciation, Earth Planet. Sci. Lett., 225, 205–220, 2004.
Rasmussen, S. O., Andersen, K. K., Svensson, A. M., Steffensen, J. P., Vinther, B. M., Clausen, H. B., Siggaard-Andersen, M.-L., Johnsen, S. J., B., L. L., Dahl-Jensen, D., Bigler, M., R ¨othlisberger, R., Fischer, H., Goto-Azuma, K., Hansson, M. E., and Ruth, U.: A new Green-25
land ice core chronology for the last glacial termination, J. Geophys. Res., 111, D06102, doi:10.1029/2005JD006079, 2006.
Raynaud, D., Barnola, J.-M., Chappellaz, J., Blunier, T., Inderm ¨uhle, A., and Stauffer, B.: The ice record of greenhouse gases: a view in the context of future changes, Quat. Sci. Rev., 19, 9–17, 2000.
30
Renssen, H., Goosse, H., and Fichefet, T.: Modelling the effect of freshwater pulses on the early Holocene climate: the influence of high-frequency climate variability, Paleoceanography, 17, PA000649, doi:10.1029/2001PA000649, 2002.
CPD
3, 729–753, 2007South Atlantic 8.2 kyr event K. Ljung et al. Title Page Abstract Introduction Conclusions References Tables Figures ◭ ◮ ◭ ◮ Back Close
Full Screen / Esc
Printer-friendly Version Interactive Discussion
EGU Renssen, H., Goosse, H., Fichefet, T., and Campin, J.-M.: The 8.2 kyr event simulated by a
global atmosphere-sea-ice-ocean model, Geophys. Res. Lett., 28, 1567–1570, 2001. Rohling, E. J. and P ¨alike, H.: Centennial-scale climate cooling with a sudden cold event around
8200 years ago, Nature, 434, 975–979, 2005.
R ¨othlisberger, R., Mulvaney, R., Wolff, E. W., Hutterli, M. A., Bigler, M., Sommer, S., and Jouzel, 5
J.: Dust and sea-salt variability in central East Antarctica (Dome C) over the last 45 kyrs and its implications for southern high-latitude climate, Geophys. Res. Lett., 29, 1963, 2002. Stocker, T. F.. The seesaw effect, Science, 282, 61–62, 1998.
Stocker, T. F., Wright, D. G., and Mysak, L. A.: A zonally averaged, coupled ocean-atmosphere model for paleoclimate studies, J. Climate, 5, 773–797, 1992.
10
Stouffer, R. J.: Investigating the causes of the response of the thermohaline circulation to past and future climate changes, J. Climate, 19, 1365–1387, 2006.
Thompson, R. and Oldfield, F.: Environmental magnetism. Allen & Unwin, London, 1986. Wiersma, A. P. and Renssen, H.: Model-data comparison for the 8.2ka BP event: confirmation
of a forcing mechanism by catastrophic drainage of Laurentide Lakes, Quat. Sci. Rev., 25, 15
63–88, 2006.
Von Grafenstein, U., Erlenkeuser, H., Brauer, A., Jouzel, J., and Johnsen, S. J.: A mid-European decadal isotope-climate record from 15 500 to 5000 years BP, Science, 284, 1654– 1657, 1999.
CPD
3, 729–753, 2007South Atlantic 8.2 kyr event K. Ljung et al. Title Page Abstract Introduction Conclusions References Tables Figures ◭ ◮ ◭ ◮ Back Close
Full Screen / Esc
Printer-friendly Version Interactive Discussion
EGU
Table 1. Radiocarbon dates from the 2nd Pond sequence between 9.635 and 7.04 m below the
fen surface.
Lab. Nr Depth (cm) 14C Age Cal. yr BP (2σ) Dated material
LuS-5799 704 6220±50 7074.5±175 Bulk sediment
LuS-6688 733 6215±60 7069.5±180 Terrestrial macrofossils
LuS-5812 747.5 6365±50 7219.5±200 Terrestrial macrofossils
LuS-5800 747.5 6560±50 7424.5±135 Bulk sediment
LuS-6231 766.5 6950±60 7769.5±160 Terrestrial macrofossils
LuS-6689 775.5 6790±50 7589.5±90 Terrestrial macrofossils
LuS-5813 802 7105±50 7859.5±120 Terrestrial macrofossils
LuS-5801 802 7115±50 7874.5±125 Bulk sediment
LuS-6230 812.5 7360±50 8139.5±160 Terrestrial macrofossils
LuS-6229 822.5 7410±50 8169.5±150 Terrestrial macrofossils
LuS-6406 829 7350±60 8129.5±170 Terrestrial macrofossils
LuS-6228 833 7665±50 8444.5±105 Terrestrial macrofossils
LuS-6407 835.5 7620±60 8354.5±165 Terrestrial macrofossils
LuS-5814 844 7310±50 8074.5±105 Terrestrial macrofossils
LuS-5802 844 7605±100 8359.5±200 Bulk sediment
LuS-6690 863.5 7725±50 8484.5±105 Terrestrial macrofossils
LuS-5815 875.5 8080±50 8834.5±195 Terrestrial macrofossils
Lus-5803 875.5 8185±60 9024.5±275 Bulk sediment
Poz-4444 912 8720±50 9654.5±135 Terrestrial macrofossils
Poz-4488 945.25 9120±190 10149.5±600 Terrestrial macrofossils
Poz-4941 962.25 9460±50 10634.5±145 Terrestrial macrofossils
CPD
3, 729–753, 2007South Atlantic 8.2 kyr event K. Ljung et al. Title Page Abstract Introduction Conclusions References Tables Figures ◭ ◮ ◭ ◮ Back Close
Full Screen / Esc
Printer-friendly Version Interactive Discussion EGU 2nd Pond Coring site 0 0.5 1.0 km 12°28'W 37°24'S Nightingale Island Inaccessible Island Nightingale Island Tristan da Cunha 37º15'S 37°30'S 12°30'W 12°15'W Tristan da Cunha 40˚S 60˚S 20˚W 60˚W 40˚W 0˚ 20˚E
A
60˚S 40˚S 20˚SB
C
Fig. 1. (A) The position of the Tristan da Cunha island group in the South Atlantic. (B) The
three main islands of the group. (C) Nightingale Island and the position of the coring site, 2nd Pond.
CPD
3, 729–753, 2007South Atlantic 8.2 kyr event K. Ljung et al. Title Page Abstract Introduction Conclusions References Tables Figures ◭ ◮ ◭ ◮ Back Close
Full Screen / Esc
Printer-friendly Version Interactive Discussion EGU D e p th (m) 9.0 8.0 7.0 3.0 5.0 6.0 4.0 0.0 2.0 1.0 Tephra Coarse- detritus gyttja Sandy/ silty gyttja Peat Low humified peat 0 200 Magnetic susceptibility 10-6SI units 10-6SI units 0 200 400 9.5 9.0 8.5 8.0 7.5 7000 8000 9000 10000 11000 Cal. yrs BP 7.0 Magnetic susceptibility
Fig. 2. Graph of lithology and susceptibility of the full 2nd Pond sediment sequence (to the
left), with lithology, radiocarbon dates and magnetic susceptibility of the lowermost 2.68 m to the right. The assumed age-depth relationship is shown by the line through most of the dates and horizontal error bars denote the double standard deviation. Calendar ages are related to AD 1950.
CPD
3, 729–753, 2007South Atlantic 8.2 kyr event K. Ljung et al. Title Page Abstract Introduction Conclusions References Tables Figures ◭ ◮ ◭ ◮ Back Close
Full Screen / Esc
Printer-friendly Version Interactive Discussion EGU -4 0 4 1st PC (full) 10500 10000 9500 9000 8500 8000 7500 7000
Age cal. yrs BP
0 1 2 10 20 30 40 50 C/N 0 100 200 300
Mag. sus. Nitrogen (%) 0 40 80 Cumulative pollen percentage 40 80 C/S -36 -34 NGRIP δ O -400 -392 EPICA Deuterium 0 40 Carbon (%) 180 190 200 210 Cariaco Grey scale 0 0.04 Sulphur (%) -4 0 4 8 2nd PC (dashed) 80 18 Phylica arborea
Grasses and herbs
Cyperaceae
Callitriche christensenii
Peat Low humified peat
Gyttja Silty gyttja
Lithology Pollen groups
Fig. 3. Graph showing the magnetic susceptibility, content of total carbon (TC) (blue), total
nitrogen (TN) (red), total sulphur content (TS), TC/TN ratios, TC/TS ratios (black), cumulative pollen percentages of Phylica arborea (green), grasses and herbs (yellow), sedges (orange), and Callitriche christensenii (red), and the values of the first two PCA axes of the pollen data set accounting for 42% of the total variance. All data are related to the age model shown in Fig. 2. The 8.2 kyr event is marked by blue color, while the other two events discussed in the text are shown by grey shading. In addition to the 2nd Pond data, the updated grayscale record from the Cariaco Basin (Haug et al., 2001), the18O values from the NGRIP ice core (Rasmussen et al., 2006), and deuterium from the EPICA ice core (Epica community members, 2004; R ¨othlisberger et al., 2002). The latter three have independent chronologies based on varve years and ice years BP.
CPD
3, 729–753, 2007South Atlantic 8.2 kyr event K. Ljung et al. Title Page Abstract Introduction Conclusions References Tables Figures ◭ ◮ ◭ ◮ Back Close
Full Screen / Esc
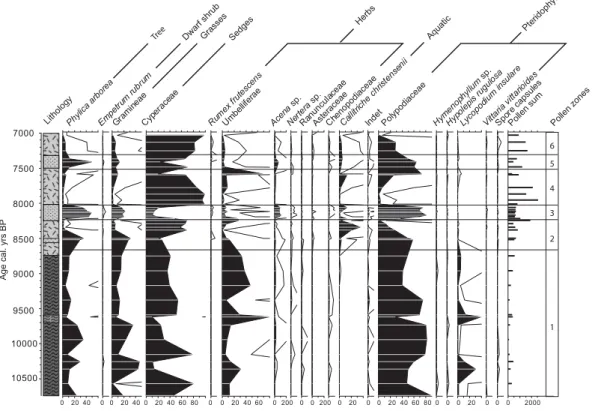
Printer-friendly Version Interactive Discussion EGU Phy lica ar bor ea Em pet rum rubr um Rum ex f rute sce ns Gram ineae Cype race ae Um bellif erae Acen a sp . Nerte ra sp . Ranunc ulac eae Ast erac eae Chenopodi aceae Cal litrich e ch risten seni i Indet Pol ypodi aceae Hym enop hyllum sp. Hyp olepi s rugul osa Lycopod ium ins ular e Vitt aria v ittar ioides Spo re c aps ules Pol len su m 7000 7500 8000 8500 9000 9500 10000 10500 0 20 40 00 20 40 0 20 40 60 80 0 0 20 40 60 0 200 0 0 200 0 20 0 0 20 40 60 80 0 0 0 20 0 0 0 2000 Tre e
Dwarf shrubGrasses Sedges
Herbs Aquatic Pteridophytes Pol len zones Lithology
Age cal. yrs BP
1 2 3 4 5 6
Fig. 4. Graph showing pollen percentages. Pollen percentages were calculated using all pollen
types, while Pteridophyte frequencies were calculated with a combined pollen and spore sum. Pollen zonation is based on the major variation in the full pollen percentage dataset which is clearly expressed in the 1st and 2nd PCA axes. The zonation concurs with major lithological changes shown to the left.
CPD
3, 729–753, 2007South Atlantic 8.2 kyr event K. Ljung et al. Title Page Abstract Introduction Conclusions References Tables Figures ◭ ◮ ◭ ◮ Back Close
Full Screen / Esc
Printer-friendly Version Interactive Discussion EGU -2 -1.5 -1 -0.5 0 0.5 1 1.5 2 2.5 3 -2 -1.5 -1 -0.5 0 0.5 1 1.5 2 2.5
First Principal Component (33%)
Se co n d Pri n ci p a l C o mp o n e n t (1 9 % ) Cyperaceae Lycopodium insulare Umbelliferae Polypodiaceae Gramineae Phylica arborea Nertera sp. Hypolepis rugulosa Ranunculaceae Spore capsules Asteraceae Callitriche christensenii Vittaria sp. Rumex frutescens Empetrum rubrum Acaena sp. Chenopodiaceae
Bog vegetation types
Local and aquatic types Upland vegetation
types
Fig. 5. Biplot of PCA variables (red diamonds), and sample scores (blue crosses). Note that
the scores are scaled. Dashed lines indicate the three major sample score groupings. The variable scores show that, the upper central group is influenced by Lycopodium insulare and Umbeliferae, which represent the bog vegetation assemblages. The two other groups repre-sent the period of gyttja deposition and separate between deposition of pollen from the local vegetation, samples in the lower right corner mainly influenced by Cyperaceae and Callitriche
christensenii , and deposition of pollen from more distal parts of the catchment during periods
of increased erosion, samples in the lower left corner mainly influenced by Phylica arborea , Polypodiaceae, Acaena sp., Rumex frutescens and Empetrum rubrum.
CPD
3, 729–753, 2007South Atlantic 8.2 kyr event K. Ljung et al. Title Page Abstract Introduction Conclusions References Tables Figures ◭ ◮ ◭ ◮ Back Close
Full Screen / Esc
Printer-friendly Version Interactive Discussion
EGU
Fig. 6. Simulation of the 8.2 kyr event over the Southeast Atlantic (20◦W–10◦E, 40◦S–20◦S), shown by the response in annual mean sea surface temperature (left axis) and precipitation (right axis) to a freshwater pulse (fw pulse) in the Labrador Sea (Alley and ´Ag ´ustsd ´ottir, 2005). Presented are the 30 year running mean anomalies relative to a reference climate in quasi-equilibrium with 8.5 kyr BP forcings (represented by the first 100 years). In the experiment, the THC of this 8.5 kyr state was perturbed by a 20 year long freshwater flux with a 0.75 Sv rate in the Labrador Sea, starting at year 100 (Alley and ´Ag ´ustsd ´ottir, 2005; Rohling and P ¨alike, 2005). The THC weakening ends at year 420, followed by a ∼100-year long “overshoot” during which the accumulated heat is released in the North Atlantic.