HAL Id: hal-03122724
https://hal.archives-ouvertes.fr/hal-03122724
Submitted on 28 Jan 2021
HAL is a multi-disciplinary open access
archive for the deposit and dissemination of
sci-entific research documents, whether they are
pub-lished or not. The documents may come from
teaching and research institutions in France or
abroad, or from public or private research centers.
L’archive ouverte pluridisciplinaire HAL, est
destinée au dépôt et à la diffusion de documents
scientifiques de niveau recherche, publiés ou non,
émanant des établissements d’enseignement et de
recherche français ou étrangers, des laboratoires
publics ou privés.
Transport of airborne lithogenic material down through
the water column in two contrasting regions of the
eastern subtropical North Atlantic Ocean
Aloys J.-M. Bory, Philip Newton
To cite this version:
Aloys J.-M. Bory, Philip Newton. Transport of airborne lithogenic material down through the water
column in two contrasting regions of the eastern subtropical North Atlantic Ocean. Global
Biogeo-chemical Cycles, American Geophysical Union, 2000, 14 (1), pp.297-315. �10.1029/1999GB900098�.
�hal-03122724�
GLOBAL BIOGEOCHE•C• CYCLES, VOL. 14, NO. 1, PAGES 297-315, MARCH 2000
Transport of airborne lithogenic material down through
the water column in two contrasting regions of
the eastern subtropical North Atlantic Ocean
Aloys
J.-M. Bory
• and
Philip
P. Newton
2
Laboratoire des Sciences du Climat et de l'Environnement, Gif-sur-Yvette, France
Abstract. Downward
particle
fluxes were measured
using deep-moored
sediment
traps deployed
in two regions
of contrasting
primary productivity
levels (mesotrophic
and oligotrophic)
of the
eastern
subtropical
North Atlantic Ocean. The high percentage
of lithogenic
material (~20-30% on
average)
in the particulate
matter collected
shows
the regional
significance
of the atmospheric
dust
inputs
originating
from West Africa. The magnitudes
of lithogenic
and biogenic
fluxes decrease
~5-6 and -•8-9 fold, respectively,
from near the African margin (mesotrophic
region) to the remote
open ocean
(oligotrophic
region).
These trophic
differences
seem
to give rise to differences
in the
characteristics
of the downward
transport
of lithogenic
material. At the oligotrophic
site, the rela-
tively low and slow export of biogenic matter apparently
limits and delays the removal of litho-
genic particles
delivered
to surface
waters
from the atmosphere.
In contrast,
the higher biological
activity in the mesotrophic
region seems
to provide persistent
conditions
for an efficient and faster
downward
transport
of the deposited
lithogenic
particles,
and the temporal
variability of lithogenic
fluxes largely reflects
that of the atmospheric
dust inputs.
Thus whether the temporal
variability of
the exported
lithogenic
flux in the water column follows that of the atmospheric
deposition
ap-
pears to depend
on the trophic status.
In the mesotrophic
region the oft-observed
linear relation-
ship between
lithogenic
and particulate
organic
matter (hereinafter
POM) fluxes breaks
down at
high POM fluxes. This observation
adds weight to the idea that linear relationships
between
POM
fluxes and some candidate
proxies
for POM transfer
cannot
be assumed
when POM export is large.
A high mesoscale
variability of biogenic,
but not lithogenic,
fluxes in the water column of the
mesotrophic
region
underscores
the relevance
of mesoscale
studies
for regional
estimates
of export
of biogenic material.
1. Introduction
Moored sediment traps have been used for several decades to investigate particulate matter transfer processes and fluxes in the ocean water column on scales varying from days to years (see Ittekkot et al. [1996] for review). While much of this ma- terial is autochthonous and of biogenic origin, in some re- gions there is a significant allochthonous lithogenic compo- nent. For example, the low-latitude North Atlantic Ocean is known to receive large atmospheric inputs of mineral particles (hereinafter dust)originating from the Sahara and Sahel (see Prospero [1996a, b] for review). In the absence of significant river discharge in the northwestern African margin, atmos- pheric inputs are unequivocally responsible for the high min- eral mass accumulation rates and patterns in bottom sediments off northwest Africa (see Rea [1994] for review).
•Now at Lamont-Doherty Earth Observatory of Columbia University,
Palisades, New York.
2Also at School of Biological and Molecular Sciences, Oxford
Brookes University, Headington, England.
Copyright 2000 by the American Geophysical Union. Paper number 1999GB900098.
0886-6236/00/1999GB900098512.00
A recent resurgence of interest in dust has occurred, mostly because of its potential role in both oceanic and climatic proc- esses. It has been proposed that dust inputs, by providing a source of dissolved iron to surface waters, could significantly increase biological productivity in iron-limited oceanic areas [Martin et al., 1990]. The potential of additional iron to affect productivity in this way has recently been confirmed [Behren- feld et al., 1996; Coale et al., 1996a, b], although the role of
dust in providing bioavailable iron has yet to be established. On the other hand, dust deposited in surface waters can take up some dissolved species by sorption processes [Krom et al., 1991; Zhuang and Duce, 1993], potentially removing essen- tial bioavailable nutrients. It has also been suggested that mineral particles could favor the export of organic carbon to the deep ocean by increasing the ballast of sinking particles [Ittekkot and Haake, 1990; lttekkot, 1993] or help the preser- vation of exported organic carbon by locking it into surface microstructures beyond the reach of chemical and biological oxidation processes [Keil et al., 1994]. Dust also enhance the productivity of land ecosystems [Swap et al., 1992], and their scattering properties in the atmosphere affect the radiative forcing of climate [Li et al., 1996; Tegen et al., 1996; Alpeft et al., 1998]. Moreover, on geological timescales, dust mass accumulation rates or grain sizes in bottom sediments and ice sheets can be used as paleoclimate proxies; the variability of both properties appears to be strongly influenced by the Mi- 297
298 BORY AND NEWTON: TRANSPORT OF AIRBORNE LITHOGENIC MATERIAL
lankovitch cycles of orbital variability, showing a close link between the dust cycle and global climate changes [Rea,
1994].
Lithogenic particles, being largely refractory, are also a good tracer of some aspects of the particulate matter cycle in the ocean; they can provide, for example, information on ver- tical transfer, resuspension, or lateral advection [Honjo, 1982; Honjo et al., 1982a, b; Neuer et al., 1997; Lampitt et al.,
1999]. Such particles
are too small to sink independently
[Lal,
1980] and are known to be transported by large sinking aggre- gates of biological origin, such as fecal pellets or marine
snow, into which they are incorporated within surface and hemipelagic waters [Dunbar and Berger, 1981; Krishnaswami et al., 1985; Fowler and Knauer, 1986, and references therein; Pilskaln and Honjo, 1987; Buat-Mdnard et al., 1989; Davies
andBuat-Mdnard, 1990]. Studies in the Sargasso and Mediter- ranean Seas have shown a close relationship between the re-
moval of lithogenic particles from surface waters and the bio-
logical activity leading to the export of particulate matter to the deep ocean [Deuser et al., 1983; Buat-Mdnard et al., 1989]. Such biological control has been shown to drive the temporal
variability of the lithogenic particle fluxes down through the water column of these open-ocean regions where the biologi- cal activity is rather low. A proportional relationship is gen- erally observed between A1 (as a proxy for lithogenic parti- cles) and particulate organic carbon (hereinafter POC) fluxes in the oligotrophic open-ocean water column [e.g., Deuser et al.,
1983; Jickells eta!., 1984; Jickells et al., 1990]. However, taking into account the large variability of pelagic biological activity in the world ocean, and the consequently large vari- ability of biogenic matter export, the characteristics of litho- genic particle transfer are likely to vary from one area to an- other. If lithogenic stocks and flux variability in the water column on short timescales (few days to years) are to be suc- cessfully interpreted in terms of water column processes and/or atmospheric inputs for instance, then it is important to better constrain the fate of mineral particles (i.e., their transfer in the water column) in the different biogeochemical provinces of the
ocean.
Sediment traps have been deployed within the Eumeli (France-Joint Global Ocean Flux Study (JGOFS))and the B io- geochemical Ocean Flux Study (BOFS, UK-JGOFS) pro-
30 ø
25 ø
20 ø
15 ø
10 ø
_40 ø
_35 ø
_30 ø
.25 ø
.20 ø
_40 ø
.35 ø
.30 ø
_25 ø
_20 ø
.15 ø
_10 ø
25 ø
20 ø
15 ø
10 ø
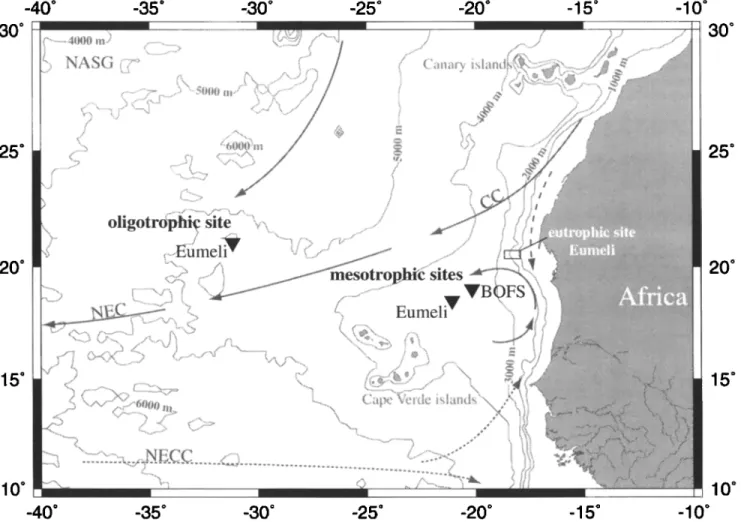
Figure 1. Mooring locations (solid triangles), bathymetry, and schematic near-surface circulation. Abre-
viations are CC, Canary Current; NEC, North Equatorial Current; NECC, North Equatorial Counter Current; NASG, approximate center of the North Atlantic Subtropical Gyre; BOFS, Biogeochemical Ocean Flux Study. Solid line, all year round; dashed line: fall, winter, and spring only; dotted line, summer and fall
BORY AND NEWTON: TRANSPORT OF AIRBORNE LrFHOGE•IC MATERIAL 2 99
grammes in adjacent regions of contrasting trophic status (mesotrophic and oligotrophic) under a major atmospheric route of dust transport. This configuration (Figure 1) presents
an opportunity to study the characteristics of the downward
transport of dust in the water column, depending on the bio- logical activity in the surface waters. The main objectives of this study are twofold. First, to compare, in the mesotrophic and oligotrophic regions the relationships between lithogenic
and biogenic particle fluxes, from which the mechanisms of dust transfer in the water column may be assessed. Second, to
discuss these results in comparing the lithogenic-particle flux variability in each ocean region and the seasonal variability of
the atmospheric inputs. This study encompasses an estimation
of particle flux mesoscale variability in the mesotrophic re- gion, exploiting the proximity of two of the moorings (~100
km apart). Combined with previously published data, the re- sults are put into the broader context of the regional variabil-
ity of dust fluxes in and over the eastern subtropical and tropi-
cal North Atlantic Ocean.
2. Regional Setting
The surface waters of the study region (Figure 1), are charac- terized by the Canary Current (hereinafter CC) flowing south-
ward along the African coast owing to the influence of the trade winds [Stramma and Siedler, 1988; Mittelstaedt, 1991]. The
CC largely leaves the continental margin, forming the wind-driven westward North Equatorial Current (hereinafter
NEC). The CC-NEC system shows a trade wind-driven seasonal
variability; it weakens and shifts northward by about 5 ø in summer, allowing part of the eastward flowing North Equato- rial Counter Current (NECC) to progress northeast toward the African coast (Figure 1). A cyclonic gyre between 15 ø and 21 øN
persists throughout the year. Below the surface waters is the
Cape Verde frontal zone (between ~150 and ~600 m), where
North Atlantic Central Water meets South Atlantic Central Wa-
ter [Zenk et al., 1991; Pierre et al., 1993]. Deeper still lies an-
other frontal zone (~22ø-24øN) between Mediterranean Water
and Antarctic Intermediate Water, the latter lying between ~800 and ~1000 m. Beneath this layer flows North Atlantic Deep Water (~1200-~4000 m), itself overlying Antarctic Bot-
tom Water.
Along the northwest African coast, the upwelling of nutri-
ent-rich waters
is driven
by the trade
winds blowing southerly
alongshore [Mittelstaedt, 1991]. Between 20 ø and 25øN, theupwelling is active all year round but is stronger in spring and late autumn; below 20øN the upwelling occurs only in winter and spring [Speth and Detlefsen, 1982]. Although its main
impact is in shelf slope waters within ~50-60 km of the coast,
its influence extends further offshore. Off Cape Blanc, for in- stance, giant "filaments" of cool, pigment-rich waters
reach several hundred kilometers beyond the shelf break [van
Camp et al., 1991; Berthon, 1992]. The upwelling system gives rise to a strong east-to-west decreasing gradient in pri- mary productivity; ~260 g organic C m-2 yr-1 in the mesotro-
phic region
and ~110 g organic
C m -2 yr -l in the oligotrophic
region [Morel, 1996], with much higher rates in eutrophic coastal waters (~535 g organic C m -2 yr-1 at the Eumeli' eutro-
phic site; see Figure 1).
The atmospheric mineral dust particles, ranging typically from 2 to 50 • diameter (see Greeley and Iversen [ 1985] for review), are transported from Saharan and Sahel regions across the tropical Atlantic during episodic outbreaks occurring all year round, within latitudinally shifting corridors depending on the position of the Intertropical Convergence Zone. These corridors also vary in their westward penetration and width [Swap et al., 1996; Moulin et al., 1997a]. Total dust deposi-
tion is estimated to be ~220 Tg yr -I in the North Atlantic Ocean, decreasing from the African margin (>30 mg m-2 d-l) to the western subtropical Atlantic (2-12 mg m -2 d -l) [Duce et al.,
1991; Jickells et al., 1998]. However, very few deposition flux measurements have been reported, and estimates are not well constrained. Maximum dust concentration in the air typi-
cally varies from 104 •g m -3 over the African coast to 102 •g m-3 over Barbados and French Guyana [Lepple and
Brine, 1976; Prospbro
and
Nees, 1977; $avoie
and Prospero,
1977]. The Cape Verde area has long been known as the "Dark Sea" because of the poor atmospheric visibility due to
airborne dust [Game, 1964]; it is also where dust falls on ships
have frequently been recorded [Darwin, 1846; Ehrenberg, 1862; Semmelhack, 1934; Kuenen, 1950]. Atmospheric dust concentrations at ground/sea level show a strong seasonal cy- cle, with higher values between November and April (e.g. at Sal, the northeastern island of the Cape Verde archipelago [Chiapello et al., 1995]). This cycle is driven by the lower at- mospheric transport occurring within the continental trade winds (Harmattan) in winter. In summer, the dust transport takes place in a higher atmospheric layer (the Saharan Air Layer (SAL)), above the trade winds inversion (they have a ma- rine origin at this time of the year); relatively low dust concen- tration is seen at ground level [Prospero and Carlson, 1972; Jaenicke and Schiitz, 1978; Chiapello et al., 1995].
3. Materials and Methods
Settling particles at the three sites (Figure 1) were collected
using conical sediment traps moored at several depths in the
water column ranging from 1000 to 3190 m. Time series were
obtained between 1990 and 1992 for 9 to 16 month periods (Table 1). Sampling intervals varied from 10 days (or even less
for few samples)for the Eumeli traps (synchronized at all depths and between the two moorings), to 21 or 28 days for the
BOFS traps (synchronized at all depths). All moorings carried current meters, which were 10 m below the traps and at ~250 m depth on the Eumeli moorings, and at 1900 m depth on the BOFS mooring. Detailed mooring configurations are described
elsewhere [Shimmield, 1990; Bournot et al., 1995].
Sediment trap sampling procedures were consistent with JGOFS protocols [Scientific Committee on Oceanic Research,
1990] and are fully detailed elsewhere [Newton et al., 1994;
Leblond et al., 1995]. Sampling cups were filled prior to de- ployment with deep seawater from the vicinity of the mooring
site mixed with a buffered formalin solution to a final concen- tration of 2% wt/vol formaldehyde (Eumeli and BOFS) and 5%0 excess salinity (BOFS only). After recovery a fraction of the supematant was removed, and buffered ~40% formaldehyde was
added to give a formaldehyde concentration supplement of
0.15-0.20%. Samples were refrigerated in the dark before ma-
300 BORY AND NEWTON: TRANSPORT OF AIRBORNE LITHOGENIC MATERIAL
BORY AND NEWTON: TRANSPORT OF AIRBORNE LITHOGENIC MATERIAL 301 ducted in filtered air environments using trace-metal-clean
procedures. Swimmers were identified and removed according to the criteria of Knauer and Asper [1989] and Michaels et al. [1990]; this step was preceded by sieving through a 1 mm ny- lon mesh for the Eumeli samples. Splitting into subsamples was carried out by established methods (Eumeli [Heussner et al., 1990] and BOFS [Honjo, 1978]).
Mass flux was obtained by weighing several subsamples fil- tered onto preweighed polycarbonate membrane filters (0.4 pm porosity), immediately rinsed with isotonic (0.56 N) ammo-
nium formate to remove salt and excess formalin, and dried at
~40øC (bar Eumeli subsamples analyzed for organic carbon and opal, which were rinsed in deionized water, centrifuged, and lyophilized). For elemental analyses the particle cake was re- moved from the filter by peeling.
Organic carbon content was determined by combustion and detection of liberated CO2 (for details, see Newton et al. [ 1994] for BOFS and Legeleux [1994] for Eumeli). Particulate organic matter (POM) content was calculated as twice the POC content. Opal content was measured for all BOFS samples [Jickells et al., 1996] and for one Eumeli time series [Ballouey, 1994] us- ing methods based on those of Mortlock and Froelich [1989].
A1, Ca, Ti, Fe, and Ba concentrations were measured by in- ductively coupled plasma - atomic emission spectrometry (ICP-AES). Between ~10 and ~100 mg of sediment trap mate- rial were totally dissolved using an ultrapure HNO3/HC1/HF (4.5/1.5/4) mixture in Teflon bombs using a microwave heat- ing system [Bory, 1997] and diluted with ~2% vol/vol HNO3 solution for analysis. Blanks were determined (at least one per five samples) to check for contamination during the prepara- tory and analytical procedures. The accuracy of the complete dissolution and analytical method was tested using analyses of a geological sediment standard (BCSS-1, National Research Council of Canada). Precision of the entire preparatory and analytical procedures was established by replicates.
Lithogenic content was estimated from A1 concentration, assuming that lithogenic material is 8.4% A1 [Turekian and Wedepohl, 1961]. In support of this approach, Ti and Fe, which are also crustal tracers [Taylor and McLennan, 1985], were linearly correlated to AI, and Ti/AI and Fe/A1 ratios (0.066+0.002 (lo) and 0.54+0.02, respectively) were similar to those of Vinogradov [1959] and Bowen [1966] for soils (0.065-0.070 and 0.53-0.54, respectively) [Bory, 1997]. Moreover, the Fe/A1 ratio was similar to that in atmospheric dust over the same region (0.514-0.542, depending on the source regions [Chiapello, 1996]). Carbonate content was cal- culated from Ca concentration in the samples as CaCO3; Mg-calcite is estimated to be negligible [Newton et al., 1994], as is lithogenic Ca (based on CaJA1 (0.2-0.6) in dust collected at Sal [Chiapello, 1996] and the likelihood of in- complete dissolution).
4. Results
4.1. Sampling Artefacts
The measurement of current speed provides a check on the likelihood of a significant hydrodynamic bias compromising sample collection. The overall average current speed during Eumeli mooring deployments was <6 cm s-I at 1000 m and <4cm s -I at 2500 m [Bournot et al., 1995]. Most of the
1-hour-average current speeds at 1000 m, and all of them at
2500 m, were <15 cm s -l, as well as at the BOFS site (always <~9 cm s -l, at 1900 m). Currents of this magnitude are un-
likely to cause major hydrodynamic bias to trap collection of fast-settling particles for bottom-moored traps of this geome- try and design [Baker et al., 1988; Honjo and Doherty, 1988;
Knauer and Asper, 1989; Bacon, 1996]. For 12 sampling peri-
ods (Eumeli), speeds >15 cm s-I were recorded at 1000 m but never exceeded 20 cm s -l. During 10 of these, the 15 cm s -I
threshold was exceeded for <4% of the time, and for the other
two (one at the mesotrophic site, one at the oligotrophic site) the threshold was exceeded for ~10% of the time. One of these
latter two periods, which is also when the highest speed is re-
corded, coincides with an unusual decrease in mass flux at 1000 m relative to 2500 m. No other correlation is evident between
current speed and particle flux, giving some confidence in the quality of the flux data. This confidence is reinforced for all sites by the clear consistency between flux time series recorded
at different depths despite changing hydrodynamic conditions
with depth. Mean horizontal currents (Eumeli) have a marked
westward component at all depths and are generally flowing southwest [Bournot et al., 1995]. Identified and removed swimmers were present at levels of less than a few percent of
the particle fluxes reported here. At such levels, swim-
mer-related artefacts, further minimized by the use of formal-
dehyde in the sampling cups, are likely to be negligible.
4.2. Material Fluxes and Settling Rates
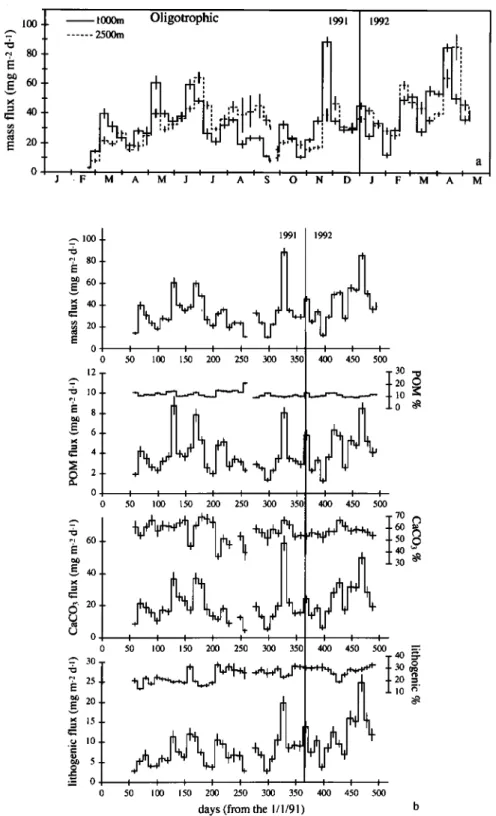
4.2.1. Oligotrophic site. Mass flux is •,35 mg m -2 d -I on average at both 1000 and 2500 m over the
15-month sampling period (Table 1), showing variability but no marked seasonal trend (Figure 2a). Time series at the two
depths are generally similar, but the flux is usually higher at 1000 m during periods of increasing flux and higher at 2500 m
as fluxes decrease. This apparent time lag between flux events at the two depths, the main peaks actually occur about one
sampling period (i.e., 10 days) later at 2500 m, allows the es- timation of a settling rate of ~150 m d -l.
The fluxes of POM, CaCO 3 and lithogenic material closely
follow the mass flux pattern at both depths; only those at 1000 m are shown (Figure 2b) as data from 2500 m show simi-
lar trends. CaCO 3, and to a lesser extent the lithogenic mate- rial, largely dominate the relatively steady composition (Fig-
ure 2b). No large changes in the composition are observed be- tween the two depths (Table 1). The undetermined fraction (to-
tal - {CaCO 3 + lithogenic + POM)), presumably biogenic opal,
is ~5-6% and ~3-4%, on average, of the content at 1000 and
2500 m, respectively (these two ranges are significantly dif- ferent at the probability threshold of 1%). Lithogenic fluxes are on average 8.8 and 10.2 mg m -2 d -I at 1000 and 2500 m, re-
spectively.
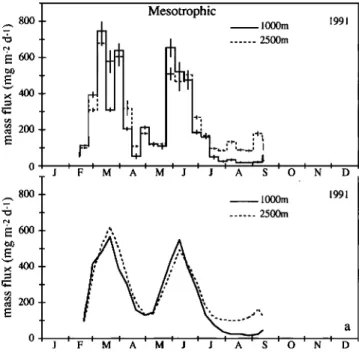
4.2.2. Mesotrophic sites, Eumeli. The average mass flux is ~7-8 times higher than at the oligotrophic site at a given depth (Table 1). Mass flux at 1000 m ranges from ~20
to 750 mg m -2 d -I (Figure 3a), showing a much higher absolute
and relative variability than at the oligotrophic site (Figure 3b). The mass flux time-series at 1000 and 2500 m depth are similar (Figure 3, a), especially during the peaks. As at the oligotrophic site, the flux tends to be larger at 1000 m at the beginning of the peaks, and larger at 2500 m at the end of
302 BORY AND NEWTON: TRANSPORT OF AIRBORNE LrH-IOGENIC MATERIAL lO0 ? 80 • 20 • lOOOm Oligotrophic ... 2500m I I I I I I I I I M 1991 1992 I I I I A M J J A $ O N D J F M A • 100 q' 80 •o 60 .,• 20 0 0 12 ß -0 10 • 4 ¸ 2 0 0 •,, 60 g4o C5' 20 o o -•' 30
E 25
•o 20 o 1o ,_ o o 1991 I I I I I I I 50 10O 150 200 250 300 350 I I I I I I I 50 10O 150 200 250 300 350 1992 I I 400 450 50030
m
20 ¸ • 10 • 0 • 400 450 500 60 50 30;o -
50 10O 150 200 250
40
I I I I t I I I I I50 10o 150 20o 250 300 350 4o0 450 500
days (from the ]/1/91) b
20 • ,--.
1o r•
Figure 2. Temporal
variability
of (a) mass
flux at 1000 and
2500 m and
(b) mass,
POM, CaCO3,
and
lithogenic
fluxes and
contents
at 1000 m, at the Eumeli
oligotrophic
site. Sub-sampling
errors
were
esti-
mated
as the standard
deviation
on subsample
mass
determinations
(lo). Fractional
errors
on POM analyses
were
estimated
to be 3% (H. Etcheber,
personal
communication,
1997).
Errors
on carbonates
and
lithogenic
fractions
include
estimated
uncertainties
on sample
weighing,
dilution,
and
ICP-AES
analysis;
the latter,
obtained from analyses replication, was always better than 3% (lo). Blanks' contents were close to detec-tion limits and negligible
in all cases.
BCSS-1
measurements
conform
to an accuracy
of +5% of the meas-
ured
elements
(for Ba no value
is given
for the standard).
Standard
deviations
between
independent
replicates
BORY AND NEWTON: TRANSPORT OF AIRBORNE LITHOGENIC MATERIAL 303
them (more clearly seen when the time series are smoothed; bottom panel of Figure 3a). However, "benchmarks" [Honjo, 1996] always occur within the same sampling period at both depths, indicating a much shorter time lag between flux events at 1000 and 2500 m than at the oligotrophic site. Ex- ploiting the consistent but subtly different patterns of mass flux changes between the two depths during the main flux events, a simple model has been developed to determine the settling rates. For each of the two large peaks, a "continuous" flux signal was retrieved from the 1000 m data using the sum of 3 G functions. The continuous signal was ob- tained by tuning the Gauss function parameters and by compar- ing, using an iterative method, its integration on a
10-day-interval frame (simulating the sediment trap sampling resolution) with the 1000 m trap data until the former matched optimally the latter. It was then possible to study the chang- ing pattern of the simulated flux due to the delay in the arrival of the flux events in the lower trap. The result of a 2 to 3-day delay best fits the 2500 m time series, allowing the estimation
of a >500 m d -1 settling rate during these high-flux events (de-
tails given by Bory [1997]).
The fluxes of all the components of the particulate matter increase during the two large mass flux peaks (Figure 3b). However, in contrast to the oligotrophic site, the material is more variable in composition and, on average, much richer in POM (Table 1). CaCO3 (~30-60%), POM (~10-50%), or the lithogenic fraction (~10-50%)variably dominate the particle flux (Figure 3b). Large increases in POM content, and to a lesser extent in CaCO3 content, are generally observed during the major flux events; at those times, biogenic components, especially POM, dilute the lithogenic fraction. The highest lithogenic contents occur during low flux periods. Opal (only measured in the deeper trap)content is 3 to 12%; highest fluxes occur at the beginning of the major flux,events. On av- erage, particulate matter composition varies little with depth (Table 1). Lithogenic fluxes are, on average, ~5-6 times higher
(41 and 54 mg m -2 d -1 at 1000 and 2500 m depths, respec-
tively) than at the oligotrophic site during the common 7-month sampling period at the two sites.
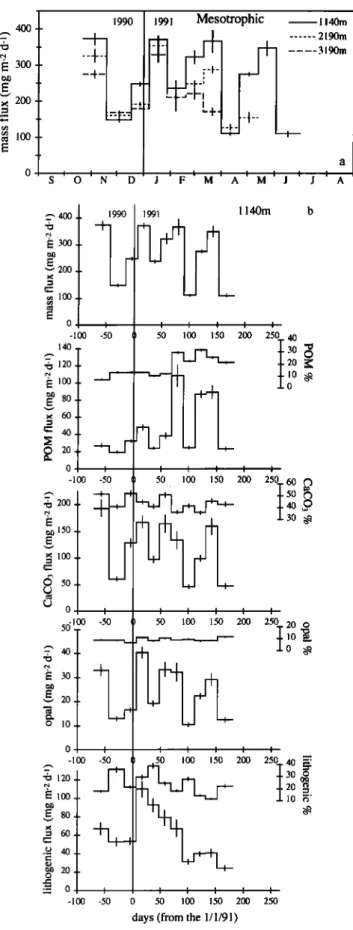
4.2.3. Mesotrophic sites, BOFS. An artefact of unknown cause during sampling led to close-to-zero fluxes during the last two and three sampling periods at 2190 and 3190 m depth, respectively. Data from the potentially biased samples have been omitted here, based on compositional ar- guments presented by Bory [1997], and the time series short- ened accordingly (Table 1). Four mass flux peaks of similar magnitude are quite evenly distributed during the deployment time (Figure 4a). The apparent relative variability of the mass flux is smaller than that of the Eumeli mesotrophic time series, but this difference could simply be a consequence of the lower time resolution of the BOFS sampling. During the common sampling period for the three BOFS traps, the time series show similar trends, but the mass flux slightly decreases with depth; at 3190 m, it is lower by ~25% on average than that at
1140 m.
At all depths, CaCO 3 represents the main fraction of the par-
ticulate matter; only 1140 m compositional data are shown (Figure 4b) as those from 2190 and 3190 m depth show similar trends. CaCO 3 and opal contents vary little in time compared to the POM or the lithogenic fraction, and their fluxes covary
with mass flux. Spring mass flux events correspond to highest POM export, and the lithogenic content is generally higher when mass flux is low. Winter shows higher lithogenic con- tents whose fluxes peak in early 1991 and then slowly decrease until the end of the sampling time. Lithogenic fluxes are, on
average, 60 to 75 mg m -2 d -1 depending on depth. Average opal
and POM content decrease slightly between 1 140 and 3190 m (Table 1). Conversely, there is a significant increase with
depth in the lithogenic content (while CaCO3 content remains
almost constant).
4.3. Comparison Between Simultaneous Eumeli and BOFS Mesotrophic Records
The two mesotrophic time series cover the period February- June 1991 (1 1 40 and 1000 m). For traps at 2190 and 2500 m the common sampling period is February-May 1991. Although the paired trap depths differ, they are sufficiently similar to al- low direct comparison between the respective time series; for POM, the most labile of the main components of the settling material, expected degradation based either on a range of em- pirical algorithms [Bishop, 1989], or apparent losses ob- served here, is not significant compared to analytical errors.
Despite BOFS and Eumeli traps and moorings not being identi-
cal, their similar geometry and design would not be expected to confer large differences in particle flux collection characteris- tics [Knauer and Asper, 1989]. Based on field study [Honjo et
8OO 600 400 200 8OO 6o0 400 200 Mesotrophic 1991
tin
1000m
... 2500m _ I I I J F M A M J J A S O N D • 1000m 1991 ... 2500m a J • F I O • N • DFigure 3. Temporal variability of (a)mass flux (top: raw data; bottom: the same mass flux timeseries smoothed by a
three-sample running mean), and (b) mass, POM, CaCO3, opal, and lithogenic fluxes and contents at 1000 and 2500 m at
the Eumeli mesotrophic site. Mass and lithogenic fluxes at the oligotrophic site for the same periods and depths are also shown in Figure 3b (dashed lines). Fractional errors on opal
analyses were estimated to be 3% (C. Rabouille, personal
communication, 1997); errors on other analyses are as stated in Figure 2.
304 BORY AND NEWTON: TRANSPORT OF AIRBORNE LITHOGENIC MATERIAL _•, 800 E 600 •' 400 • 200 0
1000m
• 800
1991 •bE4oo
,• 200 - : I 0 2500m 1991 0 50 100 150 200 250 300 35 600 50 100
150
200
250
300
35
56
•
400
50
• •3oo
•3oo
10•
• 10:oo
o • :oo
o
o
,a. o
i 70 •o •:o
•o ,oo ,.•o :•o :;o •o
:o
3oo 3
60 • 60
•ø E •4oo
3oo
•o •o200
• 2•
',oo
• o o • i i i i i i 0 50 100 150 200 250 300 350 150 12o 90 60 30 0 50 100 150 200 250 300 350days of the year
o 70 60 50 40 3o 20 1o o 60 o 50 •' 30 • •'150 20 •' •o • • 12o 0 • • 90 • 60 •= 3o o 350 20 • 10 • o • I
350
60 --
50 •' 40 •' 30 • 20 •' lO • o 50 100 150 200 250 300 50 100 150 200 250 300 50 100 150 200 250 300 350days of the year
Figure 3. (continued)
al., 1992], the baffle geometry (higher depth/diameter ratio of
cells of the Eumeli traps) might lead to an enhanced collection (up to 15%), but this expectation is speculative.
Figure 5 shows a comparison of the flux records. In the up- per traps the period of comparison encompasses the two spring mass flux peaks observed at each site, but only the first
occurs simultaneously at both sites; the second appears about a month earlier at the BOFS site. The magnitude of the peaks is
higher
at the Eumeli
site, leading
to an average
mass
flux at the
BOFS site that is lower by ~25-30% (Table 2). For the lower
traps
the difference
is greater
because
of the slight mass flux
decrease with depth at the BOFS site.BORY AND NEWTON: TRANSPORT OF AIRBORNE LITHOGENIC MATERIAL 305 300 200 1990 1991 Mesotrophic • 1140m
.. •..,
---- 3190m
-4-
;
+.i
'•'
• I a _ I _ I __ I _ I _ I __ I I I I I SIOINI D j I F I M I A I MI J I j A 400 300 200 0 -100 140 12oso
6020
o -lOO 200 150 50 o -'oo 50 E 30 • 20 o lO o 120 80 60 20 o -100 1990 -50 i -50 i -50 I -50 0 1991 1140m b i i i 50 100 150 200 i i I 50 100 150 200 i i i ) 50 100 150 I 200 i 250 40I30
TM
o 20 • lO • o i 250 60 C) 50 C3 •o •0 30 • i 250 20 o 10 • o •.50 100 150 200 250 40 ?•
30
o
20 g 10 •' 50 100 150 2oo 250 days (fromthe 1/1/91)Figure 4. Temporal variability of (a) mass flux at 1140,
2190, and 3190 m and (b) mass flux, POM, CaCO3, opal, and
lithogenic fluxes and contents at 1140 m at the BOFS mesot-
rophic site. Errors on analyses are as stated in Figures 2 and 3.
Biogenic fluxes appear to account for much of the flux vari- ability between the two sites (Table 2 and Figure 5). Average
CaCO3 and POM fluxes at the BOFS site represent at most 65 % of the respective fluxes at the Eumeli site. Such differences are
larger than analytical uncertainties (Table 2). In comparison, BOFS lithogenic fluxes are on average ~84% of the Eumeli lithogenic fluxes. Furthermore, lithogenic flux variability is
in much better agreement for the two sites (r2--0.88, upper
traps) compared
to biogenic
components
(r2=0.28 for CaCO
3
and r2--0.49 for POM). Most of the difference between the lithogenic fluxes at the upper traps of the two sites is ac- counted for during the last sampling period (Figure 5), with relatively low lithogenic (and biogenic) fluxes at the BOFSsite.
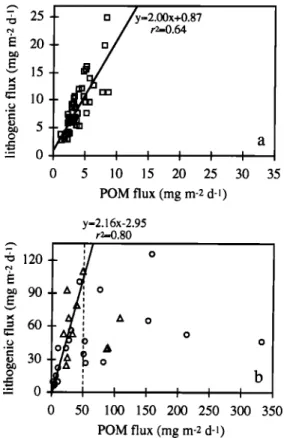
4.4. Relationship Between Lithogenic and Organic Fluxes
There is a significant correlation between lithogenic and POM fluxes at the oligotrophic site (Figure 6a). At the mesot-
rophic sites, these fluxes correlate poorly (r2--0.10 and n--32; Figure 6b). However, the two fluxes show a linear relationship for POM fluxes <~50 mg m-2 d-l (r2--0.80 and n--20); beyond
this threshold, lithogenic fluxes are much less than expected from a linear relationship. The relatively dust-poor material (AI/POC 0.025 to 0.2) is that of the large spring flux events. AI/POC ratio decreases with time through the first event but increases during the second one owing to the time lag between POM and lithogenic flux events (Figure 7). In both mesotro- phic and oligotrophic regions, similar results are obtained deeper in the water column, although they are slightly less marked because of the lower fluxes. In general, the A1/POC ra- tio is higher at the oligotrophic site (0.38 on average at 1000 m) compared to the mesotrophic sites (0.29 and 0.21 on average at 1140 and 1000 m, respectively), and varies in- versely with POM.
4.5. Residence Time of Lithogenic Particles in
Surface Waters
A few particulate aluminium (hereinafter pal) concentration profiles were determined at the mesotrophic and oligotrophic sites in June 1992 [Tachikawa et al., 1999] using samples col- lected by in situ filtration. Estimations of pal residence times in the surface waters (0-200 m), where most packaging should arise, are deduced here as the pal water column inventory for each site (0-200 m) divided by the averaged downward pal flux at 1000 and 1140 m through the Eumeli and BOFS time series, assuming no major change in the pal flux with depth. Despite uncertainties over the temporal representativity of the profiles (i.e., steady state needs to be assumed), these calculations pro- vide first-order estimates of lithogenic particle residence times in surface waters of ~10 (mesotrophic) and ~40 (oligotrophic) days.
5. Discussion
5.1. Spatial gradient of lithogenic and biogenic
fluxes
The high lithogenic contents of settling material at all sites show the importance of the atmospheric dust inputs onto this
306 BORY AND NEWTON: TRANSPORT OF AIRBORNE LITHOGENIC MATERIAL 2OO 2OO 150 50 300 0 100 80
20
o?umeli
1000•S
1140m
50 100 150 200 250 50 100 150 200 250--t-:
: , I I I I I 50 100 150 200 250 600 2OO 2OO 150 50 • 300 c5' 200 o • 80 ..•• 20
i o:..[.,,/33umeli
2500m
' •OFS
I I I I 50 100 150 200 : 100 150 20050
?.{.•
,, ,, 50 . 100 150 200 2190m I 250 I 250 I 250 I I I I I I I I I I 0 50 100 150 200 250 0 50 100 150 200 250days of the year 1991 days of the year 1991
Figure 5. Comparison
of mass,
POM, CaCO3,
and lithogenic fluxes for Eumeli
and BOFS mesotrophic
sites at similar depths during common sampling periods. Eumeli flux data have been combined to provide a sampling resolution comparable to that of the BOFS data. Errors on analyses are stated in Figures 2 and 3.
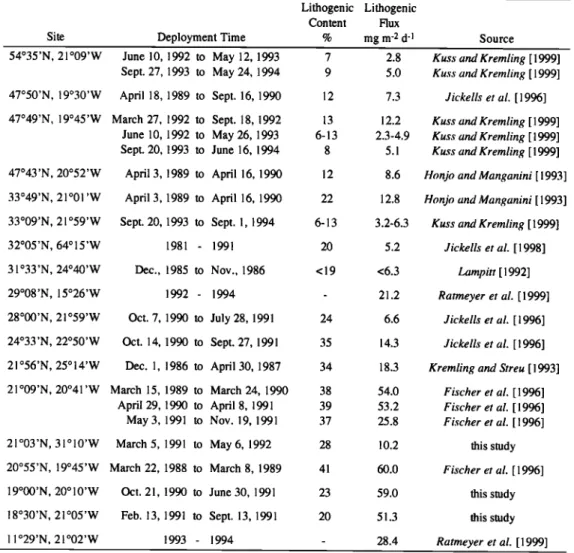
oceanic region. Lithogenic flux decreases westward, as dis- tance from the aeolian African dust sources increases. Average lithogenic fluxes in the mesotrophic region are among the
largest (above 50 mg m -2 d -l) recorded
in the North Atlantic
Ocean [Jickells et al., 1996], together with those a few hundred kilometres north, off Cape Blanc [Fischer et al., 1996], and south, off Cape Verde [Ratmeyer et al., 1999]. The oligotro- phic region receives lithogenic fluxes that are intermediate(average
.•10 mg m-2 d -•) between
the mesotrophic
region and
the Sargasso Sea in the western subtropical North Atlantic (av-
erage .•5 mg m -2 d -I [Jickells et al., 1998]).
As expected from the progressive decrease in primary pro- ductivity moving west from the west African coast [Morel et al., 1996], biogenic fluxes in the water column decrease from the mesotrophic region to the remote open-ocean oligotro- phic site. POM decrease is by more than an order of magnitude between the two sites, compared to the 5-6 fold decrease for lithogenic fluxes. POM export represents a much higher frac-
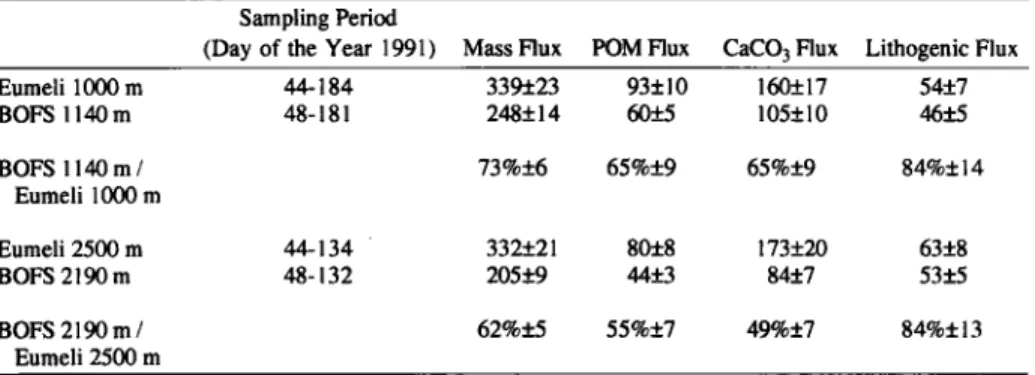
Table 2. Average Mass, POM, CaCO 3 and Lithogenic Fluxes at Eumeli and BOFS
Mesotrophic Sites During Common Sampling Periods
Sampling Period
(Day of the Year 1991) Mass Flux POM Flux CaCO 3 Flux Lithogenic Flux
Eumeli 1000 rn 44-184 339-!-_23 93+10 160+17 54+7 BOFS 1140 rn 48-181 248+ 14 60+5 105+ 10 46+5 BOFS 1140m/ 73%+6 65%+9 65%+9 84%+14 Eumeli 1000 rn Eumeli 2500 rn 44-134 332+21 80+8 173+20 63+8 BOFS 21 • rn 48-132 205+9 44+3 84+7 53+5 BOFS 2190m / 62%+5 55%+7 49%+7 84%+13 Eumeli 2500 rn
BORY AND NEWTON: TRANSPORT OF AIRBORNE LITHOGENIC MATERIAL 307 E 20 • 15 • 10 .,• =o 5 o = 0 t--2.00x+0.87 r•0.64 0 5 10 15 20 25 30 35 POM flux (mg m-2 d-•) y--2.16x-2.95 r2=0.80
120
!
!o
• 90 a ', o
60
i
a o
I o30
0 50 100 150 200 250 300 350 POM flux (mg m-2 d-l)Figure 6. Lithogenic
versus
POM flux at (a) the oligotro-
phic (1000 m depth) and (b) the mesotrophic (1000 m (circles)
and 1140 m (triangles) depths) sites.
tion of the estimated
primary production
at the mesotrophic
site (~4.6% at 1000 m depth)
compared
to the oligotrophic
site (0.6%), as expected from the trophic status of the two provinces [Eppley, 1989; Wollast, 1998]. Biogenic fluxes in
the mesotrophic
region are the highest recorded
in the open
northeast Atlantic Ocean [Jickells et al., 1996], while those at
the oligotrophic site are typical of more oligotrophic
open-ocean records [e.g., Deuser, 1986; Karl et al., 1996].5.2. Particle Flux Trends With Depth
Multidepth sampling of particle flux has the potential to provide information on the characteristics of particulate matter transfer down through the water column. Averaged fluxes of the
more refractory
components
(the lithogenic fraction in par-
ticular) show relatively good conservation
with depth at the
three sites. However, average mass and lithogenic fluxes do increase by about 15 and 30%, respectively, between 1000 and 2500 m at the Eumeli mesotrophic site, and to a lesser extent at the Eumeli oligotrophic site (<5% and ~15%), while litho-
genic
flux remains
steady
with depth
at the BOFS site. Appar-
ent increases with depth could be due to (1)differences in the particle source regions "feeding" the traps from surface wa- ters, (2)lateral advection of resuspended particles, (3) hydro- dynamic artefacts, or (4) midwater packaging, none of the
above being mutually exclusive.
Conservation of mass flux with depth is highest when mass
flux is high, which is apparent
at the Eumeli
mesotrophic
site
during the main flux events in particular (Figure 3a). When mass flux is low, such as in the oligotrophic region or at the end of the deployment at the Eumeli mesotrophic site, conser- vation can be poor. These differences probably reflect differ- ences in settling rates, which seem to be higher at high mass fluxes, and the consequent differences in the "statistical fun- nel" dimensions within which traps are supposed to collect settling particles [Deuser et al., 1988; Deuser et al., 1990]. In-
deed, very high settling rates (_>500 m d-•) at the Eumeli mesot-
rophic site during the main flux events compare to the moder-
ate settling rates of~150 m d-• at the oligotrophic site (the
later falling within the typical open-ocean range [Newton et al., 1994; Honjo, 1996, and references therein]). Such fast-settling particles at the mesotrophic site, associated with
large mass fluxes (up to ~800 mg m -2 d-•), could result from
high particle concentrations in surface waters propitious for intense aggregation processes [e.g. Alldredge and Gotschalk, 1988]. Thus, despite the more turbulent flow conditions in the mesotrophic region (compare Appendix), statistical funnels are smaller during the main flux events than at the oligotro- phic site (Table 3), indicating a more vertical trajectory for the collected particles which could explain the better flux conser- vation with depth. When settling rate is lower (here, flux smaller), statistical funnels are larger, and traps at different depths are more likely to collect particles originating from dif- ferent surface waters, therefore reflecting the heterogeneity of particle sources at the ocean surface [van Camp et al., 1991; Gabric et al., 1993; Dadou et al., 1996]. Thus the time series
-
...
POM
,
a
t 40o
160
lithogenic"
• 120
'
300 •
80
200
40 100 0 0 160 800./• 120
600
•=
80
4oo
• 40
200
0 0 0 50 100 150 200 250 300 350days of the year 1991
Figure 7. Lithogenic and POM fluxes (left-hand axes) plot-
ted together with (a)biogenic barium flux and (b) number of swimmers in the collection cup (right-hand axes) at the Eumeli mesotrophic site (1000 m trap).
308 BORY AND NEWTON: TRANSPORT OF AIRBORNE LITHOGENIC MATERIAL
Table 3. Estimates of Statistical Funnel Dimensions at the Three Trap Sites
Trap Ro.95, km
Eumeli O!ieotrovhic Site
1000m 115
2500 rn 200
Eumeli Mesotroohic . Site
1000m 57
2500 rn 95
BOFS Mesotrot•hic Site
1140m 62
2190m 88
3190m 107
Radius (R0.95) of the catchment areas of the traps (intersection of the statistical funnels with the ocean surface), corresponding to a 95% probability threshold of the collected particles, are presented (calcula- tion details are given in Apendix).
seem to demonstrate physically reasonable relationships be-
tween mass flux, settling rate, and flux conservation with
depth, apparently consistent with theoretical expectations
[see Fowler and Knauer, 1986; Siegel et al., 1990; Siegel and
Deuser, 1997].
At the Eumeli mesotrophic site, where the largest average mass and lithogenic flux increases are observed with depth, most of the difference is gained toward the end of the deploy-
ment, when mass flux is relatively low (Figure 3a). Following
the preceding arguments, the increase in mass flux with depth during this period, which is small in comparison to the ampli-
tude of the flux variations at that site, could largely be due to different surface water origins of the particles. At that time, relatively higher (~fivefold) lithogenic flux at 2500 m com- pared to 1000 m could alternatively indicate a lateral advection of resuspended particles coming from a region nearer the coast. However, a few nephelometric profiles determined at both
Eumeli sites in February 1991 have shown no nepheloid layer
in the intermediate or deep water column [Vangriesheim et al.,
1993]. Moreover, a significant increase of CaCO 3 and POM
fluxes between the two depths (~fivefold and twofold, respec- tively) is also observed, resulting in only a moderate change of average composition with depth. Thus, even if a midwater nepheloid source (likely to be of markedly different composi- tion) cannot be ruled out, supply of material from particle-rich surface waters further from the mooring location would seem to be the most likely explanation for such an occasional particle flux increase with depth. The increase would thus reflect the heterogeneity of the surface water particle sources which, ow- ing to the main current direction, may simply be a westward decreasing gradient of the settling particle sources [Siegel et
al., 1990].
However, hydrodynamic artefacts could also play a role; a possible mild under-collection at 1000 m due to current speeds occasionally close to the presumed critical threshold of
15 cm s -l (see Results) could also explain some of the ob-
served flux differences between depths [Gardner, 1980; Baker
et al., 1988; Gust et al., 1992, 1994]. The fact that discrepan-
cies occur preferentially at low mass flux could be explained by a bias that depends on the settling rate and therefore on the ap- proach angle of sinking particles to a trap [Siegel and Deuser,
1997]. Bacon [1996] reports, from radionuclide measurements,
that traps show a significant tendency toward undertrapping at depths shallower than 1200 m. Results obtained at the Eumeli
sites are consistent with the hydrodynamic bias hypothesis for
explaining why a slight increase of mass flux with depth is
such a common feature in the intermediate water column
[Walsh et al., 1988]. But this hypothesis is not thought to be
able to explain a difference such as the one recorded at the end
of the Eumeli mesotrophic deployment, especially as current
speeds remained below the threshold during this period. Fi-
nally, biological packaging in the intermediate water column
could also explain an increase of particle flux with depth [Walsh et al., 1988], but there is little support for this hy-
pothesis here, as such a phenomenon might be expected to
also occur at the BOFS site, which does not appear to be the
case.
Differences in particle source regions, more likely to occur at low settling rates, together with a possible additional slight undertrapping at 1000 m depth, are therefore the most prob- able explanations for the apparent tendency of particle flux to
sometimes increase with depth at the Eumeli sites. Moreover, the fact that at all three sites magnitude and temporal variabil-
ity of the particulate flux obtained at different depths are con-
sistent with each other, showing a good "vertical" transfer
of the flux signal, clearly indicates a dominant surface origin
for the particulate matter collected in all traps. 5.3. Coupling/Decoupling of Biogenic and Lithogenic Fluxes
The absence of a marked seasonal mass flux variability at
the oligotrophic site (Figure 2a) is consistent with the nonap-
pearance of a deep winter mixed layer at this latitude [Levitus,
1982] and thus little seasonality in primary productivity [Mo- rel et al., 1996]. The particle flux variability that them is may result from the variable influence of the remote coastal upwell- ing as suggested by Berthon [1992]; either from the upwelling
activity itself, and/or from the intensity of the currents ad- vecting pigment-rich water masses from the upwelling area.
Faster flux fluctuations, on a timescale of 1-2 months, could be
due to periodic westward currents associated with the Cape Verde Frontal Zone oscillations, or be related to the reproduc- tive cycles of some planktonic organisms as discussed by
Khripounoff et al. [1998]. Alternatively, meandering struc-
tures leading to eddy upwellings within the NEC could lead to episodic enhanced productivity production [Dadou et al.,
1996].
Mass fluxes in the mesotrophic region also show little by way of a marked seasonal signal (Figures 3a and 5a). Large changes in flux occur all year round and are likely to reflect mainly the fluctuating effect of the upwelling [van Camp et al.,
1991; Berthon, 1992; Gabric et al., 1993]. Such an influence is supported by analyses of phytoplankton community struc-
ture, carried out in September-October 1991 and April-May
1992, which indicate a declining bloom that has evolved from an autotrophic community developed under eutrophic condi- tions and advected to the mesotrophic site [Claustre, 1994].
While lithogenic and POM fluxes at the oligotrophic site are linearly correlated over the entire flux range, those in the mesotrophic are not (section 4.4, Figure 7). In the mesotro- phic region, a strong decoupling of the major components of
BORY AND NEWTON: TRANSPORT OF AIRBORNE LITI-IOGENIC MATERIAL 309 the particle flux occurs; lithogenic flux peaks in winter, while
very large POM fluxes are recorded in spring, when the highest primary productivity is expected [Morel et al., 1996]. The lin- ear relationship between lithogenic and POM fluxes generally observed in regions subject to aeolian dust inputs has been in- terpreted as biological control of the removal of lithogenic particles from surface waters [Deuser et al., 1983]. This rela- tionship implies that in these regions (1) lithogenic flux is a
good tracer of POM flux, and vice versa, and (2) lithogenic flux
is likely to be quantitatively limited by the export of biogenic material, at an average A1/POC ratio given by the slope of the linear relationship. Consequently, the surprising break in the proportional relationship in the mesotrophic region, associ- ated with lower and more variable A1/POC at higher POM fluxes (section 4.4), may indicate that the biogenic particle flux exceeds the lithogenic particle stock (i.e., there is insuffi- cient lithogenic material in the water column to meet the lithogenic transport "capacity" of the POM). It can there- fore be argued that a more efficient transport of lithogenic ma- terial down through the water column occurs in the mesotro- phic region than at the oligotrophic site. The relative particu-
late aluminium residence time estimates for the two sites (sec-
tion 4.5) are in agreement with a more efficient transport in the mesotrophic region.
Furthermore, on short timescales, the timing of lithogenic and POM flux peaks does not systematically coincide. For the second large flux event in the Eumeli mesotrophic region, lithogenic flux peaks •.20 days after the POM flux, yet bio- genic barium and lithogenic fluxes correlate well (Figure 7). Biogenic barium (calculated as total Ba - (AI X 0.0075) [Dy- mond et al., 1992, and references therein] is thought to be formed in surface and hemipelagic waters within degrading or- ganic particles [Chow and Goldberg, 1960; Dehairs et al., 1980; Bishop, 1988] or by active biological processes [Bertram and Cowen, 1997]. As the lithogenic and barium par-
ticulates have different sources, the covariation of their fluxes
suggests that they are transported by common processes. The export of particulate matter occurs mainly as fecal pellets [Dunbar and Berger, 1981' Krishnaswami et al., 1985; Pil- skaln and Honjo, 1987], and large aggregates (" marine snow" [Asper, 1987; Alldredge and Gotschalk, 1988' Alldredge and Sil.ver, 1988]). Lithogenic particles are thought to be transported mainly as fecal pellets [Fowler and Knauer,
1986; Buat-Mgnard et al., 1989; Davies and Buat-M•nard,
1990]. If so, the lag between POM and lithogenic flux peaks during the second flux event could be explained by a classical sequence [Honjo, 1996]: the fallout of a (aggregated) phyto- plankton bloom could give rise to the large POM flux (with the presence of diatoms as suggested by the opal flux peaks; Fig- ure 3b) followed by grazing by zooplankton which could inci- dentally package and export lithogenic and biogenic-barium particles as fecal pellets. The number of swimmers (mostly co- pepods; N. Leblond, personal communication, 1997) collected in the traps peaks with lithogenic and biogenic barium fluxes (Figure 7); if we assume that these swimmer numbers are roughly proportional to those of zooplankton above the trap (in surface and hemipelagic waters where most grazing and packaging should arise), the hypothesis of the dominance of fecal pellets in the transfer of lithogenic particles is sup- ported. The drastic change in the lithogenic/POM flux rela-
tionship at that site could thus also derive partly from changes in the ecosystem during the evolution of blooms which would lead to changes in the nature and source of the exported POM. This hypothesis would also explain why linear relationships between lithogenic and POM fluxes do not all show the same
slope
[e.g. Deuser
et al., 1983; Jickells et al., 1990; Neuer
et
al., 1997]; slope would be dependent on the nature of the set- tling biogenic matter, which can vary widely from one area to
another [e.g., Honjo, 1996].
5.4. Mesoscale Variability in the Mesotrophic Region
The mesoscale variability of particle flux, which is mainly due to variability in the biogenic fluxes (section 4.3), proba-
bly reflects
the spatial
heterogeneity
of biogenic particle pro-
duction and export in the surface waters. That such heterogene-
ity can occur
in this region
is clearly observed
on satellite im-
ages
that show the meandering
structures
of the biomass-rich
filaments, extending from shelf regions, which can reflect
sharp gradients
in primary productivity
over tens of kilome-
ters [Berthon, 1992]. Considering the distance between the two moorings (•.100 kin) and the size of the statistical collec-
00-
80- 60- 40- 20- 0 I I 1990 12090
6030
0 o N D I I I I I I I I I J F M A M J J A S atmosphere1991
b
ß ocean I I I I I I I I I J F M A M J J A SFigure 8. (a) Average monthly mean of the atmospheric mineral dust concentration at Sal for the period 1992-1994 [from Chiapello et al., 1995; Chiapello, 1996]. (b) Lithogenic fluxes in the mesotrophic region. Errors on analyses are stated in Figures 2 and 3. Plain thick and thin lines, BOFS 1140 m and Eumeli 1000 m depth traps, respectively; dotted thick and thin lines, BOFS 2190 m and Eumeli 2500 m depth traps, re- spectively.
![Figure 8. (a) Average monthly mean of the atmospheric mineral dust concentration at Sal for the period 1992-1994 [from Chiapello et al., 1995; Chiapello, 1996]](https://thumb-eu.123doks.com/thumbv2/123doknet/13039296.382304/14.894.445.807.507.970/figure-average-monthly-atmospheric-mineral-concentration-chiapello-chiapello.webp)
![Figure 9. Compilation of lithogenic fluxes, expressed in mg cm -2 kyr-l, in the water column (solid circle, this study; open circles, other trap locations) and surface sediments (contours, Rea [1994]) in the North At- lantic](https://thumb-eu.123doks.com/thumbv2/123doknet/13039296.382304/15.889.235.674.553.1020/figure-compilation-lithogenic-expressed-circles-locations-sediments-contours.webp)