HAL Id: hal-03079702
https://hal.archives-ouvertes.fr/hal-03079702
Submitted on 17 Jan 2021
HAL is a multi-disciplinary open access
archive for the deposit and dissemination of
sci-entific research documents, whether they are
pub-lished or not. The documents may come from
teaching and research institutions in France or
abroad, or from public or private research centers.
L’archive ouverte pluridisciplinaire HAL, est
destinée au dépôt et à la diffusion de documents
scientifiques de niveau recherche, publiés ou non,
émanant des établissements d’enseignement et de
recherche français ou étrangers, des laboratoires
publics ou privés.
Distributed under a Creative Commons Attribution| 4.0 International License
cyanobacterium Crocosphaera: effect of irradiance
S Rabouille, G Semedo Cabral, Ml Pedrotti
To cite this version:
S Rabouille, G Semedo Cabral, Ml Pedrotti. Towards a carbon budget of the diazotrophic
cyanobac-terium Crocosphaera: effect of irradiance. Marine Ecology Progress Series, Inter Research, 2017, 570,
pp.29-40. �10.3354/meps12087�. �hal-03079702�
INTRODUCTION
In the open ocean, organic matter originates from the fixation of atmospheric carbon by photoauto-trophic organisms. While the elemental composition of bulk organic material is very consistent in the world’s oceans, with molar proportions of C:N:P = 106:16:1 (Redfield 1934, Redfield et al. 1963), there is evidence for anomalous surface dissolved in -organic carbon (DIC) drawdown, exceeding the amounts predicted from nitrate availability and the Redfield C:N ratio (Sambrotto et al. 1993). This ap -parent overconsumption of DIC in regard to nitro-gen in phytoplankton cells suggests that organic
matter produced during photosynthesis does not combine carbon and nitrogen in Redfield propor-tions. While the overall biomass production is lim-ited by nitrogen availability, photo-assimilation of inorganic carbon may persist. The exudation of sur-plus carbon through the production of extracellular exopolymeric substances (EPS) such as dissolved organic material (DOM) and transparent exopoly-meric particles (TEP) (Mari et al. 2001) may validate and partly counterbalance the hypothesis of DIC overconsumption.
TEP are one type of EPS that form abiotically from acidic polysaccharides released as dissolved and col-loidal matter from phytoplankton and bacteria (Zhou © The authors 2017. Open Access under Creative Commons by Attribution Licence. Use, distribution and reproduction are un -restricted. Authors and original publication must be credited. Publisher: Inter-Research · www.int-res.com
*Corresponding author: srabouille@obs-vlfr.fr
Towards a carbon budget of the diazotrophic
cyanobacterium
Crocosphaera: effect of irradiance
Sophie Rabouille
1,*, Georges Semedo Cabral
1, 2, Maria Luiza Pedrotti
11Sorbonne Universités, UPMC Univ Paris 06, CNRS, UMR7093, Laboratoire d’Océanographie de Villefranche,
181 Chemin du Lazaret, 06230 Villefranche-sur-mer, France
2Present address: Université de Moncton, 18 rue Antonine-Maillet, Moncton (NB) E1A 3E9, Canada
ABSTRACT: We examined changes in carbon fluxes in the marine unicellular diazotrophic cyano-bacterium (UCYN) Crocosphaera watsonii in response to irradiance. We estimated changes in the total organic carbon and nitrogen contents, incorporation of carbon into reserves, and exudation processes of extracellular exopolymeric substances (EPS), as well as in the formation of transpar-ent exopolymeric particles (TEP). Variability of cellular carbon pools and extracellular EPS and TEP under conditions of different irradiance and the significance of carbon release in the environ-ment is discussed. Our results show a relationship between growth rate, metabolic processes of carbon incorporation in cells, exudation and irradiance. When growth is light-limited, both carbon production and exudation increase with light. No inhibition occurs at growth-saturating irradi-ances and half of the total particulate organic carbon is then found as intracellular carbohydrates. While the overall growth becomes light saturated, carbon fixation is further stimulated by higher irradiances, leading to an increased EPS exudation. We found that EPS exudation in C. watsonii is not only a way for cells to release excess carbon, but also occurs when growth is light-limited, even at the lowest irradiance tested. The formation of TEP increases with irradiance, with TEP-carbon amounting to up to 30% of the total particulate organic TEP-carbon. Our data will help to quan-tify the role of unicellular diazotrophs in the export of both carbon and nitrogen through and below the euphotic zone in the marine environment.
KEY WORDS: Carbon cycle · Exudation · UCYN · EPS · TEP · Primary production
O
PEN
PEN
et al. 1998, Passow 2000, 2002a). EPS and TEP partic-ipate in bloom formation (Passow et al. 1994) and actively take part in the carbon cycle and biogeo-chemistry in diverse aquatic systems (Alldredge et al. 1993, Passow et al. 2001, Wotton 2004, Bhaskar & Bhosle 2005). However, the DIC overconsumption hypothesis mentioned above was initially formulated based on NO3− consumption data. With the recent
discovery of new open-ocean and coastal, unicellular diazotrophic cyanobacteria (UCYN) (Zehr et al. 2001, Montoya et al. 2004, Moisander et al. 2010), addi-tional nitrogen sources for phytoplanktonic growth were found that also participate in the consumption of surface DIC. Diazotrophic cyanobacteria thrive over a wide range of latitudes in the oceans (Stal 2009, Moisander et al. 2010, Monteiro et al. 2010), where they contribute to primary production. Owing to their ability to fix N2, they play a critical
biogeo-chemical role in nitrogen-depleted oceans, typically in (sub)tropical regions, where they can represent a significant fraction of the plankton biomass (Church et al. 2005). Although the reported contribution of diazo trophs to primary production in these areas is often highly variable, the literature points to a sub-stantial share of the world’s ocean’s primary produc-tion supported by nitrogen fixaproduc-tion (Letelier & Karl 1996, Karl et al. 1997, Carpenter et al. 2004). Diazo -trophs would thus represent an important trophic link in sustaining the biological pump in oligotrophic oceans.
Diazotrophic organisms also produce EPS and TEP (Webb et al. 2009; Dron et al. 2012a), which represent a carbon loss for cells, but how important is this pro-cess, in regard to the maintenance of cell growth? In non-diazotrophic primary producers, nitrogen limita-tion can enhance TEP produclimita-tion (Mari et al. 2001), although nitrogen limitation is not a prerequisite for carbon exudation since TEP production also occurs in non-limiting conditions of nitrogen (Claquin et al. 2008, Pedrotti et al. 2010). The aim of the present work was to describe carbon fluxes in Crocosphaera
watsonii, an open-ocean UCYN. Biomass production
rates and growth were monitored in duplicate batch cultures grown at a range of light intensities. In order to assess the exudation potential of cells, we tested whether different irradiances resulted in changes in the amount of carbon stored in cells and exuded. The respective cellular carbon pools (including storage carbohydrates and structural carbohydrates, such as sugars contained in glycolipids) as well as extracellu-lar EPS and TEP were compared in regard to the cor-responding light treatment. The importance of car-bon release into the environment is discussed.
MATERIALS AND METHODS Experimental setup
Monocultures of Crocosphaera watsonii strain WH8501 (Waterbury et al. 1988, Waterbury & Rippka 1989) were grown in acid-cleaned boro-silicate Erlen meyer flasks. A teflon tube closed with a clamp was used to ensure aseptic sampling during the ex -periment. YBCII culture medium (Chen et al. 1996) was prepared from aged Mediterranean Sea surface water collected at the permanent ‘Point B’ station (43° 41’ 10’’ N, 7° 19’ 00’’ E), filtered through 1 μm Mil-lipore Polygard filters and stored in the dark at room temperature for 1 mo. Before use, the seawater was filtered (0.1 μm Millipore Polygard filters) and diluted with Milli-Q water up to a final salinity of 35.00 PSU. After sterile addition of dissolved macro and micro -nutrients, the medium was transferred to each exper-imental flask.
The seed culture used for these experiments was kept in a growth chamber at a constant temperature of 27°C and exposed to a 12 h light:12 h dark re -gime at approximately 120 μmol photons m−2 s−1.
After inoculation, all cultures were placed in the same growth chamber and were manually and gen-tly swirled twice a day for a few minutes, which was enough to stimulate gas exchanges, prevent wall growth and reach efficient growth rates. Cultures were non-axenic but SYBR-Green-stained samples visualized by flow cytometry pointed to a very low contamination level. As re ported in Dron et al. (2012b), bacteria were ap proxi mately 0.7 μm in dia -meter and accounted for 0.5% of the total cell abun-dance, which corresponded to approximately 0.4% of the total carbon and nitrogen in the cultures. Cul-tures were exposed to 12 different irradiances rang-ing from 20 to 500 μmol photons m−2s−1ap plied on
one side only to generate a light gradient within the chamber. Irradiance in the chamber was provided by fluorescent tubes (Sanyo FL40SS W/37) and followed a 12 h light: 12 h dark cycle. Flasks were positioned in such a way that (1) no self-shading occurred between the flasks and (2) duplicates received the same incident irradiance. The different levels of irradiance were re gu larly measured using a US-SQS/LI (WALZ) quantum sensor. A neutral density filter was used to cover a few cultures in order to increase the range of the investigated light gradient.
Flasks were inoculated with exponentially growing culture; the initial concentration in each flask was 9.2 × 10⁴cells ml−1.
One set of 10 flasks (5 duplicate cultures) containing 500 ml culture was used for the biochemical ana -lyses and the growth rate measurements de scribed below. Another set of 7 flasks containing 250 ml cul-ture was only sampled for additional growth rate esti-mations. The experiment was limited to duplicate cultures to prevent self-shading and ensure a con-stant incident light intensity throughout the experi-ment. Once growing exponentially, cultures were sampled for 3 consecutive days for identification of the different pools detailed below. Given the signifi-cant changes in physiological parameters such as cell size, carbon and nitrogen content that occur in cells of C. watsonii at the hourly scale, samples in each culture were taken in the late light phase, at the same time every day to prevent any bias that would be due to possible diel fluctuations within each cul-ture. Cultures were initiated at low biomass concen-tration, and the cell density was still low enough at the time of sampling to prevent light limitation.
Cell abundance and particulate organic carbon (POC) and nitrogen (PON)
Cell abundance and average cell volume were monitored on a daily basis, using a Coulter Counter (Beckman, Multisizer 3). Cell size was estimated as equivalent spherical diameter and used to calculate the cell biovolume. Growth rates, estimated from cell counts, did not show any significant deviations dur-ing the sampldur-ing period, indicatdur-ing that cells remained in a similar physiological state over the 3-d monitor-ing of cellular contents.
The total POC and PON were determined with a CHN analyzer (Perkin Elmer, 2400-II). Samples (5.8 ml) were filtered onto precombusted (4 h at 450°C) GF/F filters (Whatman) and dried at 60°C be fore analysis. Precombusted, empty filters were used as tare. Car-bon and nitrogen contents per cell were estimated using the cell abundance at the time of sampling.
Total cellular carbohydrate and cellular carbohydrate pools
Samples for carbohydrate analyses were taken in the late light phase in order to determine the carbon content when it is highest. The different intracellular carbohydrate pools and soluble extracellular EPS (S-EPS) were analyzed according to Dubois et al. (1956) using glucose as a standard. The concentration of EPS in the fresh culture medium was also measured
and subtracted from the results. All fractions ob -tained were quantified separately and at once, using a dedicated standard curve, to avoid any measure-ment bias. Immediately before analysis of each frac-tion, a new standard curve was determined using a range of 9 standard glucose solutions from 0 to 200 mg l−1, prepared freshly and in triplicate from a 5 g l–1stock solution. The linear relationship obtained
in the standard curve (R2= 0.99) was used to convert
ab sorbance values into mg equivalents of glucose per sample. Production rates were then estimated from the 3 consecutive samples (48 h span) using the average biomass concentration during that period to ac -count for possible changes in cell concentration dur-ing the sampldur-ing period.
Duplicate samples of 5.8 ml culture were taken twice, for determination of the total cellular carbohy-drate on the one hand, and of the different cellular carbohydrate pools on the other hand according to Dubois et al. (1956). The latter fraction was obtained following the protocol proposed by Dron et al. (2012a). Two analytical replicates were also performed dur-ing the analyses. All samples were filtered through 1 μm polycarbonate filters at gentle vacuum (<150 mm of Hg) so as not to disrupt cells, and filters were placed in 15 ml Falcon® tubes (Corning®) and stored at −80°C until analysis. Total cellular carbohydrate and all cellular carbohydrate fractions were then converted into fmol C cell−1according to Pakulski &
Benner (1992), using the cell volume measured at the time of sampling and considering that carbon repre-sents 40% of the mass of glucose.
Extracellular pools: soluble EPS and TEP
S-EPS comprise an extracellular carbohydrate frac-tion dissolved in water and can be isolated from par-ticulate material by gentle vacuum filtration (<150 mm of Hg) of the culture through a 0.2 μm polycarbonate filter (Benner et al. 1992, Underwood et al. 1995). The filtrate was collected in a 15 ml Falcon® tube and stored at −80°C until analysis according to Dubois et al. (1956).
TEP are acidic, exo-polysaccharides; this fraction was quantified by spectrophotometry according to the dye-binding assay (Passow & Alldredge 1995) using Alcian Blue as a stain. Duplicate samples of 11.6 ml were filtered through a 0.4 μm polycarbonate filter at low vacuum pressure to preserve cells, and the filter was stored in a 15 ml Falcon® tube at −20°C until analysis. Two analytical replicates were also performed during the analyses. TEP values were
expressed as xanthan gum (XG) weight equivalent (μg XG l−1) calculated by means of a calibration curve
using 12 concentrations of xanthan gum (in tri plicate) according to Claquin et al. (2008). Linear regressions were fitted to the calibration data with a coefficient of determination of R2 = 0.98. The carbon content of
TEP (TEP-C) was estimated from colorimetric deter-minations (TEPcolor) as:
TEP-C = 0.75 × TEPcolor (1)
where TEP-C is given in μg l–1and TEP
colorin μg XG
l−1(Engel & Passow 2001).
A control measurement was performed in the culture medium prior to inoculation to confirm the absence of EPS in the medium.
Statistical analysis
Average concentrations are provided with their related standard error of the mean (SEM). To de -termine whether the measured POC, PON and car-bon pools show significant differences between the light treatments, an ANOVA with one classification criterion was performed, followed by a post hoc Tukey’s HSD test. Data normality of the different data sets was verified using the Rankit
test (Bliss et al. 1956). The homogeneity of variance was confirmed using Levene's test (Levene 1960).
RESULTS Growth dynamics
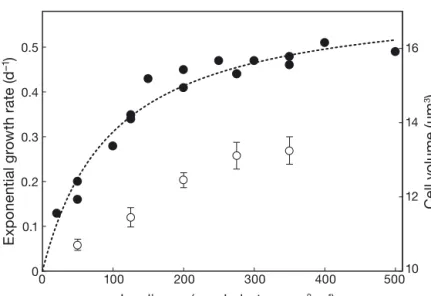
All cultures showed an exponential growth with good reproducibility be tween replicates. The exponential growth rates (μ) ob tained in the different treatments re -vealed a saturation relationship with irradiance (Fig. 1). An increase in μ was ob -served in all cultures up to 150 μmol photons m−2s−1, before tapering off around
0.5 d−1 at higher irradiances. Fitting the
Monod (1942) model to these data (Fig. 1) predicted a theoretical, maximum growth rate μmax = 0.6 d−1 and a half-saturation
constant for light utilization KI= 98.8 μmol
photons m−2 s−1, with a determination
coefficient R2= 0.95.
Cultures processed for biomass quan-tifications were grown at irradiances from
50 to 350 μmol photons m−2s−1. Due to the large
num-ber of samples taken for biochemical ana lyses, not all cultures could be sampled during the exact few days of their respective highest growth rate. In particular, growth had reached a plateau when the set of cul-tures exposed to the highest irradiance (350 μmol photons m−2 s−1) was sampled. Culture replicates showed consistent behavior and results for each light treatment are presented as average values between replicates. When exposed to higher light intensity, cells became larger. The average cell biovolume re -corded in each culture over the 3-d sampling period increased with irradiance from 10.71 μm3in cultures
grown at 50 μmol photons m−2 s−1 to 13.25 μm3 in those grown at 350 μmol photons m−2s−1,
represent-ing a 24% biovolume gain (Fig. 1).
Total C and N contents and cellular carbohydrates pools
When expressed per cell, there was a significant linear increase in POC and PON along the range of irradiance up to 275 μmol photons m−2 s−1 (Fig. 2).
POC in creased from 264.7 ± 13.8 (SEM) fmol C cell−1
at 50 μmol photons m−2s−1to 443.6 ± 12.8 fmol C cell−1
0 100 400 500
0 0.1 0.2
200 300
Irradiance (µmol photons m–2 s–1)
0.3 0.4 0.5 E x ponen tial gr o w th rat e ( d –1) 10 12 14 16 Cel l v o lume ( µ m 3)
Fig. 1. Exponential growth rate μ (d−1) observed in cultures of Crocosphaera
watsonii as a function of irradiance (closed circles; left axis) and average
(± SEM) cell biovolume (open circles; μm3, right axis). Note the scale on the
secondary y-axis. A Monod relationship (dotted line) was fitted to the
growth rate data, which predicts a maximum growth rate μmaxof 0.6 d−1and
a half saturation constant KI= 98.8 μmol photons m−2s−1. The quality of the
fit was assessed by estimating the determination coefficient of this
non-lin-ear relationship: R2= 1−(SS
e/SSt), where SSeis the sum of the square
differ-ences between data y and model estimations and SStis
the sum of the squares of the distances between data y and their average
yˆ : SSe= ∑ −(y yˆ )2 y: SSt= ∑ −(y y)2
at 275 μmol photons m−2s−1(R2= 0.87; p < 0.01), while
PON evolved from 34.9 ± 2.8 to 45.2 ± 2.3 fmol N cell−1
(R2= 0.95; p < 0.01). Cultures grown at 350 μmol
pho-tons m−2s−1were an exception and stand out from the
increasing trend, with a smaller cell volume and cel-lular content.
The discrimination and quantification of internal carbon pools, carried out in parallel, indicate a carbo-hydrate buildup in cells with increased irradiances up to 200 μmol photons m–2s−1. Fig. 3A represents cellular
contents in structure, reserve and total (i.e. structural + reserve) carbohydrates; both reserve (R2= 0.99) and
structure (R2= 0.92) pools showed a saturation
rela-tionship with irradiance. Reserve carbohydrates dou-bled from an average of 32 fmol C cell−1in cultures
ex-posed to 50 μmol photons m−2s−1, to 67 fmol C cell−1at
200 μmol photons m−2 s−1. Structural carbohydrates
also showed a near 2-fold increase, from 17 fmol C cell−1to 31 fmol C cell−1in the same range of
irradi-ances (Fig. 3A). Accumulation of cellular reserve and structure carbohydrates saturated above 200 μmol pho-tons m−2s−1 and cultures even showed sub- maximal
contents. Total carbon (POC) expressed per biovolume did not change significantly with irradiance. On the contrary, carbohydrate contents, whether expressed per biovolume or per carbon unit, did increase with ir-radiance up to 200 μmol photons m−2s−1 (p < 0.01), pointing to a reserve accumulation in cells. This in-crease in carbohydrate storage saturated beyond 200 μmol photons m−2s−1 (Fig. 3B). These results
indi-cate that carbon accumulation is not to be related to the increase in cell size only; at higher light levels there is an increase in total carbon with larger proportions of POC found as carbohydrates: 50% at 200 μmol pho-tons m−2s−1versus 29% at 50 μmol photons m−2s−1.
EPS and TEP production rates
Production rates can be reasonably estimated from 2 closely related time points, between which little change in biomass can be assumed. In the present study, the time interval between 2 samples is 1 d and production rates were calculated as follows:
(2) where Poolt+δt− Pooltis the concentration of the
ele-ment formed or consumed during the time interval δt, expressed as fmol C l−1, and⎯B is the average biomass
concentration during the same time interval:⎯B = 0.5 × (Bt+δt+ Bt), expressed as cells l−1.
At the time of sampling, the highest absolute EPS concentration expressed relative to cell abundance
Production rate = Pool
(
t+δt−Poolt)
/ B(
× δt)
100 200 300 400 PO C (f m o l C c e ll −1) 30 40 50 60 PO N (fmol N cel l − 1) 0 100 200 300 400
Irradiance (µmol photons m–2 s–1)
Fig. 2. Average total particulate organic carbon (POC; closed
circles; fmol C cell−1, left axis) and nitrogen (PON; open
cir-cles; fmol N cell−1, right axis) per cell in cultures exposed to
increasing irradiances. Each data point is the average of 6 time points (samples taken for 3 consecutive days in dupli-cate cultures). Error bars are ± SEM (n = 6). A linear regres-sion is observed over the first 4 irradiances for both POC and
PON, whose respective determination coefficients (R2) are
0.87 and 0.96 0 100 200 300 400 0 50 100 150 Cel lu lar carboh y d rat e s (f m o l C c e ll −1)
A
4 8 12 16 Cel lu lar carboh y d rat e s (f m o l C µ m −3 )B
0 100 200 300 400Irradiance (µmol photons m–2 s–1)
Fig. 3. Average reserve (open circles), structure (open trian-gles) and total (reserve + structure; diamonds) carbohydrate content in cultures grown at different light intensities,
ex-pressed (A) per cell (fmol C cell−1) and (B) per biovolume
(319.6 ± 62.2 fmol C cell−1) was observed in
cultures exposed to the lowest light intensity, and the lowest EPS concentration (151.2 ± 10.2 fmol C cell−1) was observed in cultures exposed to the
highest light intensity. The cultures grown at inter-mediate irradiances showed an overall decreasing trend in EPS concentration (Fig. 4). Average EPS production rates, calculated over the 3 d of sam-pling, yielded mostly negative values, indicative of a disappearance of EPS rather than a production. Rates ranged from −25 fmol C cell−1d−1at 50 μmol
photons m−2s−1to 4.22 fmol C cell−1d−1at 350 μmol
photons m−2s−1.
Although an abiotic process, TEP formation is af -fected by cell exudation and so is likely to depend on cell density. Therefore, we normalized the concen-tration of TEP relative to cell abundance, which also allows for comparison with other carbon pools. Importantly, normalization by cell abundance did not affect the dynamics described in the ‘Discussion’, which remained true when considering absolute con-centrations per volume (mg C l−1for instance). TEP
were detected in all cultures and their concentration varied from 77 fmol C cell−1at 50 μmol photons m−2
s−1to 123.5 fmol C cell−1at 275 μmol photons m−2s−1,
thus representing a 60% increase. Accordingly, the net TEP production rate increased with light inten-sity, al though not linearly (Fig. 5). The order of mag-nitude of this process was similar to that of EPS pro-duction, with a maximum rate of 19.5 ± 9.5 fmol C cell−1d−1at 275 μmol photons m−2s−1. However, an ex
-ception is observed in cultures exposed to 350 μmol photons m−2 s−1, which stand apart from the trend
and show a lower production rate.
DISCUSSION
Among the different lineages of diazotrophs, uni-cellular cyanobacteria have been given increasing at tention in the last 2 decades (Zehr et al. 2000). These include UCYN-B, a group of phototrophic cyanobacteria, whose cultured representatives are strains from the genus Crocosphaera (Zehr et al. 2001), which are widely distributed in the world’s (sub)trop-ical oceans (Church et al. 2005, Hewson et al. 2007, Zehr et al. 2007).
The ecophysiology of Crocosphaera still shows a number of puzzling features. For instance, the cell cycle (Dron et al. 2013) as well as diel cycles of gene expression (Mohr et al. 2010, Shi et al. 2010) tightly control the different metabolic processes, which par-ticipate in maintaining a stable elemental stoichiome-try at the daily scale (Dron et al. 2012b). But there is evidence for discrepancies between the net metabolic rates, deduced from the net growth rate, and actual activities of carbon and nitrogen acquisition, that seem to largely exceed the metabolic costs for these activities. For instance, gross nitrogen fixation in
Croco sphaera watsonii WH8501 would exceed up to
3-fold the nitrogen requirements for growth under conditions of exponential, balanced growth (Dron et al. 2012b). Such luxury growth dynamics associated with a release of compounds into the environment has also been observed in a number of other phototrophic diazotrophs, such as Cyanothece BG 43511, which
ex-0 100 300 400 0 200 400 200 C o llo id a l EPS (f m o l C c e ll –1)
Irradiance (µmol photons m–2 s–1)
Fig. 4. Average colloidal extracellular exopolymeric substance
(EPS) concentration (fmol C cell−1) in cultures exposed to
dif-ferent light intensities, and expressed relative to cell abun-dance. Error bars are ± SEM (n = 6)
0 100 200 300 400 −40 −20 0 20 40 T E P p ro d u c ti o n r a te (f m o l C c e ll −1 d −1)
Irradiance (µmol photons m–2 s–1) Fig. 5. Average net transparent exopolymeric particle (TEP) production rate in duplicate cultures of C. watsonii exposed
udes up to 89% of its recently fixed nitrogen (Agawin et al. 2007), or Trichodesmium, reported to release 50 to 90% of the fixed nitrogen (Capone et al. 1994, Glibert & Bronk 1994, Mulholland & Bernhardt 2005). Carbon exudation by phytoplanktonic or cyano-bacterial cells occurs through the release of EPS, which promotes the formation of TEP. These have been related to the photosynthetic rate (Mague et al. 1980, Claquin et al. 2008) or the growth rate (Waite et al. 1995). While the ability of diazotrophs to exude carbon compounds is documented in the literature (Berman-Frank et al. 2007, Webb et al. 2009, Sohm et al. 2011, Dron et al. 2012a), it is still unclear how sig-nificant these fluxes are for the biogeochemistry of their environment. In unicellular strains, such as C.
watsonii, one could wonder whether the
energy-demanding diazotrophic growth would permit signif-icant carbon losses. In the following text, we show that it actually does.
Irradiance−growth relationship
The growth kinetics data reveal a saturation in the growth response to irradiance, accurately fitted using the Monod (1942) model, with a saturation threshold around 200 μmol photons m−2s−1(Fig. 1). The absence of any reduced growth rate at the highest irradiances could suggest that none of the light levels applied here were inhibiting. However, a markedly re duced POC and PON content (Fig. 2), as well as a reduced EPS concentration and TEP production (Figs. 4, 5), at the highest irradiance may instead re flect the initia-tion of photoinhibiinitia-tion. We believe that the absolute threshold value for light saturation observed here is not an unalterable, physiological feature of C. wat sonii but rather reflects the long-term light- acclimation state of this strain at the time at which this experiment was conducted. This strain features a certain resistance to strong lights (Ra bouille & Claquin 2016). It is likely that, had cultures been pre-acclimated at higher irradiances, the saturation relationship would have re -mained, but with a threshold possibly shifted towards higher light levels (e.g. see Mortain-Bertrand et al. 1988). In the following subsections, we show that such a saturation relationship also characterizes the differ-ent processes of carbon and nitrogen acquisition.
All samples for biochemical analyses were taken in the second half of the light period. As expected, the molar C:N ratios exceeded the Redfield value, indi-cating that cells were accumulating carbon in all cul-tures. C:N ranged from 7.45 and 7.72 at the lowest irradiance to 9.87 and 10.21 at the highest irradiance.
This range consistently brackets values previously reported for this strain: when considering the same time window, this ratio varied from 8.5 to 9.5 in tinuous cultures of C. watsonii grown in similar con-ditions and exposed to a bell shape, 12 h light:12 h dark regime with a maximum of 130 μmol photons m−2s−1(Dron et al. 2012b).
Light-limited growth processes
At increasing sub-saturating irradiances, cells not only grow faster, they are bigger (Fig. 1) and con tain more cellular compounds (Fig. 2). POC per cell in -creased by 68% between 50 and 275 μmol photons m−2s−1. This trend is mirrored in the PON cell
con-tent, pointing to a light stimulation of nitrogen fixa-tion, but with a lower rate of change (29% increase). As a result, a carbon surplus accumulates in cells, shown by the increase in the C:N ratio with irradi-ance. POC accumulation reflects the dynamics of the cellular carbon pools; when exposed to higher irradi-ances, cells build up more structural carbon but they also increase their storage reserves (Fig. 3). The pro-portion of reserve carbohydrates increases from 12.2% of POC at 50 μmol photons m−2s−1to 19% at
200 μmol photons m−2s−1. Altogether, cellular carbo-hydrates then account for 29% (at 50 μmol photons m−2s−1) to 50% (at 200 μmol photons m−2s−1) of the
total POC in the cultures. The present data assert that the commonly ob served, widely fluctuating pools of cellular carbo hydrates are a signature in cyanobac-teria and an im portant component of their ecology, whether in diazotrophic strains (Schneegurt et al. 1994, Ra bouille et al. 2006, Dron et al. 2012b) or non-diazo trophic strains, such as Microcystis sp. (Rabouille & Salencon 2005, Rabouille et al. 2005).
The absolute concentration of any element or pool results from processes of production and losses (such as possible degradation, consumption or transforma-tion) that occur between the inoculation and the moment of sampling. At any time, the instantaneous net production rate is directly dependent on the bio-mass concentration as well as on the growth status of cells. Therefore, for a relevant production rate to be estimated, it is critical to relate the measured com-pound concentrations to the actual cell abundance responsible for production or loss. Following the stimulation of POC production by light in C. watsonii, one might reasonably expect that carbon exudation increases as well, as already reported for several non-diazotrophic phytoplankton strains (Zlotnik & Dubinski 1989). The fast transient dynamics of the
EPS pool, together with the negative values of EPS production rates observed up to 200 μmol photons m−2s−1, point to a net decrease in the EPS fraction,
even though the rate of EPS production appears to in crease with the irradiance. In parallel, absolute concentrations measured in the cultures indicate that the residual EPS is inversely related to the irradiance level (Fig. 4). These 2 observations suggest that the application of higher light levels triggered increases in EPS production, while their aggregation into TEP (see below) is responsible for an even higher de -crease in the concentration of EPS. Overall, results point to fast dynamics of the extracellular carbon pools, whose kinetics prove non-trivial to describe. The actual dynamics of the EPS pool may not be seen at time scales longer than those of metabolic pro-cesses. It is also still unclear whether EPS exudation is a continuous process or, on the contrary, whether EPS are actively released only at certain phases of the growth cycle. We wonder, for instance, to what extent the exudation process is correlated with the cell division cycle, with increased exudation follow-ing carbon incorporation (a possible consequence of excess carbon incorporation) and/or de creased exu-dation during the cell division phase (when cells need cellular material to make new daughter cells). Fluorescent probes would probably help to further characterize this phenomenon. Comparison of Figs. 3 and 4 indicates that, although ex uded EPS are rap-idly removed from the dissolved pool, the remaining EPS concentration in cultures is of the same order of magnitude as the total carbohydrates in cells (and even 4 times more at the lowest irradiance), demon-strating that, in exponentially growing cultures, a significant fraction of carbon incorporated daily through photosynthesis is actually released into the environment. We believe that EPS exudation is much more than just an outlet for excess fixed carbon. The magnitude of EPS exudation, especially at low irradi-ances, is strong evidence of its constitutive character: carbon release would be part of the growth process, whether it is light limited or light saturated. Nutrients and cell exudates trapped in the EPS matrix (Flem-ming & Wingender 2001) remain available to cells in the co lony. In the natural environment, such a con-stantly enriched, extracellular matrix would even constitute a possible attachment surface and sub-strate for symbiotic consortia to set up.
Despite fluctuating production rates between con-secutive days, the averaged TEP production rates showed reproducibility between duplicates, and the data showed evidence of a very clear, positive stimu-lation of TEP production by increasing irradiances
(Fig. 5). We believe the culture experiment did not introduce artifacts in TEP formation, as a similar rela-tionship between incident irradiance and TEP forma-tion was also reported in natural phytoplankton assemblages (Hong et al. 1997). The formation of TEP per se is an abiotic process; therefore, it is most certainly not directly affected by the ambient light intensity, but instead depends on the amount of dis-solved and colloidal material in the medium. Follow-ing the observations of Passow (2000), data suggest that the accumulation of EPS in the present cultures concomitantly stimulated the formation of TEP. The present data suggest that the more EPS are exuded, the more they collate into TEP, and the lesser EPS remain (as observed in cultures exposed to higher irradiances). The nonlinearity in the relationship be -tween irradiance and TEP production is further caused by the fact that TEP production also relies on turbulence (Klein et al. 2011), as well as on bacterial degradation and grazing (Mari & Burd 1998, Penna et al. 1999, Kiorbøe 2000, Garcia et al. 2002), al though the exact role of these processes in TEP formation in the natural environment may still be debated.
Light-saturated growth processes
At the highest irradiances investigated, cultures showed a light-saturated growth with no further accumulation of cellular compounds (Fig. 3). Cells most probably reached their maximal average size. Given the saturation trend in the growth response depicted in Fig. 1, we expected the different cellular parameters to reach a plateau in cultures exposed to irradiances above 200 μmol photons m−2s−1. Yet, at
275 μmol photons m−2 s−1, the cell biovolume, POC
and PON kept in creasing even though the intracellu-lar carbohydrates pools showed the expected satura-tion. Considering that GF/F filters can actually col-lect some TEP (Engel & Passow 2001) and given the much higher concentration of TEP observed in these cultures, we suspect that the presence of TEP could be the reason for the high POC measured. Impor-tantly, we bring up again some methodological issues that may not have resounded through the literature: Moran et al. (1999) showed that when assessing pri-mary production, the measured 14C incorporation rates vary depending on whether a GF/F or polycar-bonate filter is used to collect the biomass. They point to higher carbon incorporation on GF/F filters, which they attribute to the retention of labelled DOC on the filter. Given the risk of DOC adsorption on GF/F fil-ters, we acknowledge that there is scope for
improve-ment in the present experiimprove-mental protocol; yet, our protocol rigorously follows methods used in the liter-ature, which was required to make our study compa-rable with all the data published so far. Our results also remain valid when comparing the magnitude of exudation between treatments, which was the main purpose of the present work.
The POC, PON and carbohydrates contents meas-ured in cultures exposed to 350 μmol photons m−2s−1
are lower than expected in regard to the saturation relationship. Cells also appear smaller. We believe these measurements are reliable because the analy-ses, performed on distinct pools in different samples from 2 cultures, show congruent results. Sampling was done in the late growth phase in these cultures, which then showed a reduced growth rate; these actually showed an altered dynamic. In our experi-ments, we explored the exponential growth capacity and not the behavior of likely pre-senescent cells. Because they are not representative of the exponen-tial growth dynamics expected at this light level, these cultures are not further considered in this study. From a methodological point of view, this ob servation stresses how much a correct analysis of the growth dynamics in response to environmental conditions is bound to an accurate comprehension of the growth status of cells at the time of sampling.
As cell concentration varies exponentially in time, the inaccuracy of estimated production increases with the time interval. In our study, we followed cell dy-namics on a daily basis in our cultures, and pool centrations were measured over 3 d to derive 2 con-secutive production rates over the period of sampling, with a 24 h interval. In 2 cultures growing at 0.5 and 0.15 d−1, cells will on average take 1.4 and 4.6 d to
di-vide, respectively. The estimated production rates will be strongly affected by the occurrence, or not, of cell division within the considered time interval. This fact at least partly explains why our cultures showed fluc-tuating net EPS production rates from day to day. Bac-terial contamination in the cultures could be a partial sink for released EPS, but due to the extremely low contamination observed in our cultures, the related consumption is considered negligible. Importantly, because EPS participate in the formation of TEP, the measured EPS production is a net apparent rate, which does not reflect the actual gross EPS exudation, should EPS collate into TEP at a fast rate.
Wotton (2004) suggested that EPS production was a way for cells to release excess carbon. If EPS exuda-tion was exclusively consequent to an over-accumu-lation of carbon, then such release should only be observed once cell growth becomes light saturated
and cells have reached their maximum storage capac-ity. Instead, the present results evidence a sustained increase in EPS exudation following a stimulation of photosynthesis by increasing irradiance. When the growth rate is light saturated, then releasing EPS does appear as a way out for excess carbon, which, as discussed by Otero & Vincenzini (2004), compensates for excess reducing power when carbon and nitrogen metabolism become too unbalanced.
Probable impacts in the natural environment
We expect the permanent release of EPS and for-mation of TEP under different light conditions by dia-zotrophic cells to represent a steady supply to other communities in the natural environment. Such provi-sion of organic molecules will benefit bacteria and the microbial carbon pump. Given the possible mixo -trophy in a number of phytoplankton groups, it is likely that blooms of diazotrophs also create con-ducive conditions for the immediate development of phototrophic communities in oligotrophic areas. Re -leased as dissolved material, EPS may remain as such and be used locally. However, the present data sug-gest that a significant fraction actually enters the par-ticulate pool when aggregating into TEP, where they add to the export flux.
TEP formation is related to carbon overproduction by cells. TEP are carbon-rich exopolymers, composed of various polysaccharides that can aggregate nitro-gen molecules such as amino acids, even though they have a C:N ratio above Redfield (Engel & Passow 2001). As emphasized by Passow (2002b), the sedi-mentation of carbon-rich TEP is thought to decouple the cycles of carbon and nitrogen in the marine envi-ronment. But in blooms of diazotrophs, the poten-tially high nitrogen excretion rates would move the TEP composition closer to the Redfield balance. As a consequence, sedimentation processes following the development of blooms of nitrogen fixers can repre-sent an export of both carbon and nitrogen towards deeper layers, if these have not benefitted other com-munities within the euphotic zone.
CONCLUSIONS
In line with observations in the eukaryote
Emilia-nia huxleyi (Engel et al. 2004), we found that carbon
exudation as EPS in the prokaryote C. watsonii WH8501 is constitutive of growth and increases with the rate of carbon acquisition. While carbon storage
and cell growth rate saturate at high light with up to 50% of the POC found as intracellular carbohydrates, both EPS exudation rates and the subsequent forma-tion of TEP further increase with irradiance. Exudation is not an outlet for carbon fixed in excess but in -stead takes part in the overall growth strategy of this organism. As a consequence, diazotrophic cyano -bacteria show a much wider impact on the environ-ment than solely a stimulation of primary production. Their gross activities generate direct fluxes of carbon and nitrogen into their environment, which, when con-tributing to the dissolved compartment, are excluded from primary production estimates. Our results high-light a significant exudation capacity in C. watsonii, with EPS concentrations amounting to 1- to 2-fold the cellular carbohydrates and TEP representing up to 30% of the biomass standing stock (expressed as car-bon), illustrating the impact of these organisms on the carbon cycle in the current upper ocean. We believe that UCYN both stimulate the bacterial pump and exert a non- negligible contribution to export in oligotrophic oceans.
Ackowledgements. This study was supported by the LEFE (Les Enveloppes Fluides de l’Environment; Crococycle pro-ject) and ANR (Agence nationale de la recherche; Purple Sun project) funding programs, the Conseil Général des Alpes Maritimes and the Conseil Régional Provence Alpes Côte d’Azur. We thank A. Dron for his comments regarding the protocols. We are very grateful to M.-E. Kerros and A. Talec for their technical support and advice, to P. Nival for his constructive comments on the results, and to J. R. Dolan for reading and commenting on the manuscript. We are also very grateful to the three anonymous referees, who had very constructive comments and helped highlight the overall impact of this work.
LITERATURE CITED
Agawin NSR, Rabouille S, Veldhuis MJW, Servatius L, Hol S, van Overzee HMJ, Huisman J (2007) Competition and facilitation between unicellular nitrogen-fixing cyano-bacteria and non-nitrogen-fixing phytoplankton species. Limnol Oceanogr 52: 2233−2248
Alldredge AL, Passow U, Logan BE (1993) The abundance and significance of a class of large, transparent organic particles in the ocean. Deep Sea Res I 40: 1131−1140 Benner R, Pakulski JD, McCarthy M, Hedges JI, Hatcher PG
(1992) Bulk chemical characteristics of dissolved organic matter in the ocean. Science 255: 1561−1564
Berman-Frank I, Rosenberg G, Levitan O, Haramaty L, Mari X (2007) Coupling between autocatalytic cell death and transparent exopolymeric particle production in the mar-ine cyanobacterium Trichodesmium. Environ Microbiol 9: 1415−1422
Bhaskar PV, Bhosle NB (2005) Microbial extracellular poly-meric substances in marine biogeochemical processes. Curr Sci 88: 45−53
Bliss CI, Greenwood ML, White ES (1956) A Rankit analysis of paired comparisons for measuring the effect of sprays on flavor. Biometrics 12:381–403
Capone DG, Ferrier MD, Carpenter EJ (1994) Amino-acid cycling in colonies of the planktonic marine cyanobacter-ium Trichodesmcyanobacter-ium thiebautii. Appl Environ Microbiol 60: 3989−3995
Carpenter EJ, Subramaniam A, Capone DG (2004) Biomass and primary productivity of the cyanobacterium Tricho -desmium spp. in the tropical N Atlantic Ocean. Deep Sea Res I 51: 173−203
Chen YB, Zehr JP, Mellon M (1996) Growth and nitrogen fixation of the diazotrophic filamentous non heterocystous cyanobacterium Trichodesmium sp IMS 101 in de -fined media: evidence for a circadian rhythm. J Phycol 32: 916−923
Church MJ, Jenkins BD, Karl DM, Zehr JP (2005) Vertical distributions of nitrogen-fixing phylotypes at Stn ALOHA in the oligotrophic North Pacific Ocean. Aquat Microb Ecol 38: 3−14
Claquin P, Probert I, Lefebvre S, Veron B (2008) Effects of temperature on photosynthetic parameters and TEP pro-duction in eight species of marine microalgae. Aquat Microb Ecol 51: 1−11
Dron A, Rabouille S, Claquin P, Chang P, Raimbault V, Talec A, Sciandra A (2012a) Light-dark (12: 12 h) quantification of carbohydrate fluxes in Crocosphaera watsonii. Aquat Microb Ecol 68: 43−55
Dron A, Rabouille S, Claquin P, Le Roy B, Talec A, Sciandra A (2012b) Light-dark (12: 12) cycle of carbon and nitro-gen metabolism in Crocosphaera watsonii WH8501: rela-tion to the cell cycle. Environ Microbiol 14: 967−981 Dron A, Rabouille S, Claquin P, Talec A, Raimbault V,
Scian-dra A (2013) Photoperiod length paces the temporal orchestration of cell cycle and carbon-nitrogen metabo-lism in Crocosphaera watsonii. Environ Microbiol 15: 3292−3304
Dubois M, Gilles KA, Hamilton JK, Rebers PA, Smith F (1956) Colorimetric method for determination of sugars and related substances. Anal Chem 28: 350−356
Engel A, Passow U (2001) Carbon and nitrogen content of transparent exopolymer particles (TEP) in relation to their Alcian Blue adsorption. Mar Ecol Prog Ser 219: 1−10
Engel A, Thoms S, Riebesell U, Rochelle-Newall E, Zondervan I (2004) Polysaccharide aggregation as a potential sink of marine dissolved organic carbon. Nature 428: 929−932 Flemming HC, Wingender J (2001) Relevance of microbial
extracellular polymeric substances (EPSs) - Part I: Struc-tural and ecological aspects. Water Sci Technol 43: 1−8 Garcia C, Prieto L, Echevarria F, Garcia-Lafuente J, Ruiz J,
Rubin J (2002) Hydrodynamics and the spatial distribu-tion of plankton and TEP in the Gulf of Cadiz (SW Iberian Peninsula). J Plankton Res 24: 817−833
Glibert PM, Bronk DA (1994) Release of dissolved organic nitrogen by marine diazotrophic cyanobacteria, Tricho -desmium spp. Appl Environ Microbiol 60: 3996−4000 Hewson I, Moisander PH, Morrison AE, Zehr JP (2007)
Dia-zotrophic bacterioplankton in a coral reef lagoon: phy-logeny, diel nitrogenase expression and response to phosphate enrichment. ISME J 1: 78−91
Hong Y, Smith WO, White AM (1997) Studies on transparent exopolymer particles (TEP) produced in the Ross Sea (Antarctica) and by Phaeocystis antarctica (Prymnesio-phyceae). J Phycol 33: 368−376
Karl D, Letelier R, Tupas L, Dore J, Christian J, Hebel D (1997) The role of nitrogen fixation in biogeochemical cycling in the subtropical North Pacific Ocean. Nature 388: 533−538
Kiorbøe T (2000) Colonization of marine snow aggregates by invertebrate zooplankton abundance, scaling and possi-ble role. Limnol Oceanogr 45: 479−484
Klein C, Claquin P, Pannard A, Napoléon C, Le Roy B, Véron B (2011) Dynamics of soluble extracellular polymeric substances and transparent exopolymer particle pools in coastal ecosystems. Mar Ecol Prog Ser 427: 13−27 Letelier RM, Karl DM (1996) Role of Trichodesmium spp. in
the productivity of the subtropical North Pacific Ocean. Mar Ecol Prog Ser 133: 263–273
Levene H (1960) Robust tests for equality of variances. In: Olkin I, Ghurye SG, Hoeffding W, Madow WG, Mann HB (eds) Contributions to probability and statistics: essays in honor of Harold Hotelling. Stanford University Press, Stanford, CA, p 278–292
Mague TH, Friberg E, Hughes DJ, Morris I (1980) Extracel-lular release of carbon by marine phytoplankton — a phys-iological approach. Limnol Oceanogr 25: 262−279 Mari X, Burd A (1998) Seasonal size spectra of transparent
exopolymeric particles (TEP) in a coastal sea and com-parison with those predicted using coagulation theory. Mar Ecol Prog Ser 163: 63−76
Mari X, Beauvais S, Lemee R, Pedrotti ML (2001) Non-Red-field C: N ratio of transparent exopolymeric particles in the northwestern Mediterranean Sea. Limnol Oceanogr 46: 1831−1836
Mohr W, Intermaggio MP, LaRoche J (2010) Diel rhythm of nitrogen and carbon metabolism in the unicellular, dia zo trophic cyanobacterium Crocosphaera watsonii WH8501. Environ Microbiol 12: 412−421
Moisander PH, Beinart RA, Hewson I, White AE and others (2010) Unicellular cyanobacterial distributions broaden the oceanic N-2 fixation domain. Science 327: 1512−1514
Monod J (1942) Recherches sur la croissance des cultures bacteriennes. Hermann & Cie, Paris
Monteiro FM, Follows MJ, Dutkiewicz S (2010) Distribution of diverse nitrogen fixers in the global ocean. Global Biogeochem Cycles 24, GB3017
Montoya JP, Holl CM, Zehr JP, Hansen A, Villareal TA,
Capone DG (2004) High rates of N2fixation by
unicellu-lar diazotrophs in the oligotrophic Pacific Ocean. Nature 430: 1027−1032
Morán XAG, Gasol JM, Arin L, Estrada M (1999) A compar-ison between glass fiber and membrane filters for the estimation of phytoplankton POC and DOC production. Mar Ecol Prog Ser 187: 31−41
Mortain-Bertrand A, Descolas-Gros C, Jupin H (1988) Growth, photosynthesis and carbon metabolism in the temperate marine diatom Skeletonema costatum adapted to low temperature and low photon flux density. Mar Biol 100: 135−141
Mulholland MR, Bernhardt PW (2005) The effect of growth
rate, phosphorus concentration, and temperature on N2
fixation, carbon fixation, and nitrogen release in continu-ous cultures of Trichodesmium IMS101. Limnol Oceanogr 50: 839−849
Otero A, Vincenzini M (2004) Nostoc (Cyanophyceae) goes nude: extracellular polysaccharides serve as a sink for reducing power under unbalanced C/N metabolism. J Phycol 40: 74−81
Pakulski JD, Benner R (1992) An improved method for the hydrolysis and MBTH analysis of dissolved and particu-late carbohydrates in seawater. Mar Chem 40: 143−160 Passow U (2000) Formation of transparent exopolymer
parti-cles, TEP, from dissolved precursor material. Mar Ecol Prog Ser 192: 1−11
Passow U (2002a) Production of transparent exopolymer particles (TEP) by phyto- and bacterioplankton. Mar Ecol Prog Ser 236: 1−12
Passow U (2002b) Transparent exopolymer particles (TEP) in aquatic environments. Prog Oceanogr 55: 287−333 Passow U, Alldredge AL (1995) A dye-binding assay for the
spectrophotometric measurement of transparent exo
-polymer particles (TEP). Limnol Oceanogr 40: 1326−1335 Passow U, Alldredge AL, Logan BE (1994) The role of partic-ulate carbohydrate exudates in the flocculation of diatom blooms. Deep Sea Res I 41: 335−357
Passow U, Shipe RF, Murray A, Pak DK, Brzezinski MA, All-dredge AL (2001) The origin of transparent exopolymer particles (TEP) and their role in the sedimentation of par-ticulate matter. Cont Shelf Res 21: 327−346
Pedrotti ML, Peters F, Beauvais S, Vidal M, Egge J, Jacobsen A, Marrasé C (2010) Effects of nutrients and turbulence on the production of transparent exopolymer particles: a mesocosm study. Mar Ecol Prog Ser 419: 57−69
Penna A, Berluti S, Penna N, Magnani M (1999) Influence of nutrient ratios on the in vitro extracellular polysaccha-ride production by marine diatoms from the Adriatic Sea. J Plankton Res 21: 1681−1690
Rabouille S, Claquin P (2016) Photosystem-II shutdown evolved with nitrogen fixation in the unicellular diazo -troph Crocosphaera watsonii. Environ Microbiol 18: 477−485
Rabouille S, Salençon MJ (2005) Functional analysis of Microcystis vertical migration: a dynamic model as a prospecting tool. II. Influence of mixing, thermal stratifi-cation and colony diameter on biomass production. Aquat Microb Ecol 39: 281−292
Rabouille S, Salençon MJ, Thebault JM (2005) Functional
analysis of Microcystis vertical migration: a dynamic
model as a prospecting tool: I − Processes analysis. Ecol Modell 188: 386−403
Rabouille S, Staal M, Stal LJ, Soetaert K (2006) Modeling the dynamic regulation of nitrogen fixation in the cyanobac-terium Trichodesmium sp. Appl Environ Microbiol 72: 3217−3227
Redfield AC (1934) On the proportions of organic deriva-tives in sea water and their relation to the composition of plankton. In: Daniel RJ (ed) James Johnstone Memorial Volume. University Press of Liverpool, p 176−192 Redfield AC, Ketchum BH, Richards FA (1963) The
influ-ence of organisms on the composition of sea-water. In: Hill MN (ed) The composition of seawater comparative and descriptive oceanography the sea: ideas and obser-vations on progress in the study of the seas. Vol 2. Wiley-Interscience, New York, NY, p 26−77
Sambrotto RN, Savidge G, Robinson C, Boyd P and others (1993) Elevated consumption of carbon relative to nitro-gen in the surface ocean. Nature 363: 248−250
Schneegurt MA, Sherman DM, Nayar S, Sherman LA (1994) Oscillating behavior of carbohydrate granule formation and dinitrogen fixation in the cyanobacterium Cyanoth-ece sp. strain ATCC 51142. J Bacteriol 176: 1586−1597 Shi T, Ilikchyan I, Rabouille S, Zehr JP (2010) Genome-wide
fixing cyanobacterium Crocosphaera watsonii WH 8501. ISME J 4: 621−632
Sohm JA, Edwards BR, Wilson BG, Webb EA (2011) Consti-tutive extracellular polysaccharide (EPS) production by specific isolates of Crocosphaera watsonii. Front Micro-biol 2: 229
Stal LJ (2009) Is the distribution of nitrogen-fixing cyano-bacteria in the oceans related to temperature? Environ Microbiol 11: 1632−1645
Underwood GJC, Paterson DM, Parkes RJ (1995) The measurement of microbial carbohydrate exopolymers
from intertidal sediments. Limnol Oceanogr 40:
1243−1253
Waite AM, Olson RJ, Dan HG, Passow U (1995) containing compounds on the cell surfaces of marine diatoms measured using concanavalin A and flow cyto -metry. J Phycol 31: 925−933
Waterbury JB, Rippka R (1989) The order Chroococcales. In: Krieg NR, Holt JB (ed) Bergey’s manual of systematic bac-teriology. Williams & Wilkins, Baltimore, MD, p 1728−1746 Waterbury JB, Watson SW, Valois FW (1988) Temporal separation of photosynthesis and dinitrogen fixation in the marine unicellular cyanobacterium Erythrosphaera marina. Eos 69: 1089
Webb EA, Ehrenreich IM, Brown SL, Valois FW, Waterbury JB (2009) Phenotypic and genotypic characterization of multiple strains of the diazotrophic cyanobacterium, Crocosphaera watsonii, isolated from the open ocean. Environ Microbiol 11: 338−348
Wotton RS (2004) The ubiquity and many roles of exopoly-mers (EPS) in aquatic systems. Sci Mar 68: 13−21 Zehr JP, Carpenter EJ, Villareal TA (2000) New perspectives
on nitrogen-fixing microorganisms in tropical and sub-tropical oceans. Trends Microbiol 8: 68−73
Zehr JP, Waterbury JB, Turner PJ, Montoya JP and others
(2001) Unicellular cyanobacteria fix N2in the subtropical
North Pacific Ocean. Nature 412: 635−638
Zehr JP, Montoya JP, Hewson I, Mondragon E and others
(2007) Nitrogenase gene expression and N2fixation in
the North Pacific Subtropical Gyre. Limnol Oceanogr 52: 169−183
Zhou J, Mopper K, Passow U (1998) The role of surface-active carbohydrates in the formation of transparent exopoly-mer particles by bubble adsorption of seawater. Limnol Oceanogr 43: 1860−1871
Zlotnik I, Dubinski Z (1989) The effect of light and tem
-perature on DOC excretion by phytoplankton. Limnol Oceanogr 34: 831−839
Editorial responsibility: Ronald Kiene, Mobile, Alabama, USA
Submitted: May 9, 2016; Accepted: February 9, 2017 Proofs received from author(s): April 10, 2017