Doing What Works:
An Exploratory Analysis on Toronto's Strong Neighbourhood Strategy 2020's Impact on Crime in Kingsview Village-The Westway
By
Pierre D'Souza
BA in Political Science and Criminal and Socio-Legal Studies University of Toronto
Toronto, Canada (2014)
Submitted to the Department of Urban Studies and Planning in partial fulfillment of the requirements for the degree of
Master in City Planning at the
MASSACHUSETTS INSTITUTE OF TECHNOLOGY
February 2019
2019 Pierre D'Souza. All Rights Reserved
The author here by grants to MIT the permission to reproduce and to distribute publicly paper and electronic copies of the thesis document in whole or in part in any medium now known or hereafter created.
Author
Signature redacted
Department of Urban Studies and Planning (December 19, 2018)
Certified by
Signature
redacted-Professor Karl Seidman Department of Urban Studies and Planning
Thesis Supervisor
Signature redacted
Accepted byMASSACHUSES INSTITUTE P. hristopher
OF TECHNOLOGY AssociAtei'rofessor A rsoh Zegras Chair, MCP Committee
L1EW
5
2jj9
Department of Urban Studies and PlanningUIBRARIES
ARCHIVES
Doing What Works:
An Exploratory Analysis on Toronto's Strong Neighbourhood
Strategy 2020's Impact on Crime in Kingsview Village-The
Westway
by Pierre D'Souza
Submitted to the Department of Urban Studies and Planning on December 19, 2018 in Partial Fulfillment of the Requirements for the Degree of Master in City Planning degree
Abstract
The Strong Neighbourhood Strategy 2020 (TSNS 2020) is an initiative started by the City of Toronto in 2014. The strategy's intention was to engage neighbourhood residents, city services, and local non-profits in community and economic development to generate tailored solutions that would result in heightened are prosperity, vibrancy, and safety in 31 of the city's most vulnerable neighbourhoods. My exploratory analysis focused on how the strategy attempted to address violent crime prevention and mitigation in one of these neighbourhoods (Kingsview Village-The Westway). Employing a combination of comparative violent crime data analysis, stakeholder interviews, and literature reviews from academic sources as well as my background in law enforcement, I could not find any evidence that TSNS 2020 had led to reductions in violent crime in Kingsview Village-The Westway. Furthermore, I elaborated on a series of fundamental strategic and implementational flaws in TSNS 2020 has halted its ability to achieve positive results and suggested methods TSNS 2020 could use to enhance their success rate as they look to learn from their past mistakes and build for the strategy's future. It is important to note that my exploratory analysis was conducted with a very small sample size and dataset and therefore should be taken a launching point for a more robust future evaluations of TSNS 2020 successes and shortcomings in the field of crime prevention and mitigation.
Thesis Supervisor: Karl Seidman
Acknowledgement
My thesis is a love story between myself and the City of Toronto. Immigrating over 25 years ago from India, Toronto its surrounding region has given my family the opportunity to succeed beyond our wildest dreams. However, I realized that there are those for whom Toronto has not presented the same opportunities. I hope that this thesis will be a stepping stone towards a fruitful career aimed at extending these same benefits throughout the city.
I would like to thank my thesis advisor Karl Seidman and reader Justin Steil for the support and guidance they have provided me through the thesis research and formulation process. Their input was essential in producing a final product that I could be proud of.
Next, I want to thank my parents who showed me by example what I could achieve in Canada. It is on their foundation that I pursue my own Canadian Dream. To my sister, I thank for being able to put a smile on my face through the writing process.
Lastly and most importantly, I want to extend my sincerest gratitude to the love of my life, Gina, who believed in me and my abilities when I did not believe in myself. Without you yelling at me on the commuter train, I would have never got my application in on time for MIT. You made me a better police officer and now a better public safety professional. My sincerest wish is I can build a Toronto where our future family can thrive and succeed as we did.
Table of Contents
Chapter 1: Introduction ... 6
P u rp o se ... 6
Research Question ... 8
Urban Context ... 8
The City of Toronto ... 8
M unicipal Decision M aking in Toronto ... 9
Poverty in Toronto ... 9
Violent Crime in Toronto ... 10
Chapter 2: The Toronto Strong Neighbourhoods Strategy 2020 ... 12
Overall Program Goals ... 12
Strategy for Crime Reduction ... 13
How were the NIAs chosen? ... 13
Strategy Im plementation in NlAs ... 15
How does TSNS 2020 engage the com m unity? ... 16
Funding Structure ... 17
TSNS 2020 Progress at a High Level ... 18
Chapter 3: M ethodology ... 22
Selecting Neighbourhoods ... 22
Data Analysis ... 26
Interviews ... 27
Identifying Crim inogenic Factors in Kingsview ... 29
S ite V isit ... 2 9 M easures of Success ... 30
Lim itations ... 30
Chapter 4: Literature Review ... 33
Chapter 5: Social Causes of Crime in Kingsview ... 38
W hat are Crim inogenic Factors? ... 38
Crim inogenic Factors in Kingsview ... 38
Education ... 40
Geographic Isolation/Capital Flight ... 45
M istrust of Governm ent and Law Enforcem ent ... 47
Chapter 6: TSNS 2020 Efforts to Com bat Crim inogenic Factors in Kingsview ? ... 52
Assessm ent of the Strategy's work on the Ground ... 56
Activating Local Participation...56
Heal thy Lives ... 59
Econom ic Opportunitiies ... 59
Social Developm ent ... 63
Chapter 7: Sum m ary and Recom m endations ... 67
Recom m endations ... 74
Ensure that TSNS 2020 is Reaching All Dem ographics... 74
Build Accountability Mechanisms and Performance Metrics into the Implementation ... 78
Create Partnerships between TSNS 2020 and New Private Sector Partners... 80
Use TSNS 2020 as a Platform to Build Lasting Relationships between the Somali Community and the Toronto Police Service ... 82
Do as the Toronto Public Library Does... 84
Conclusion...85
Bibliography ... 86
Chapter 1: Introduction
Purpose
When people think of the operation of a city, they frequently think about transportation,
recreation, employment etc. What is too often neglected from the conversation in city planning circles is a sound and sane discussion on public safety. When looking at the budget of most large cities across Canada and the United States, one will find that policing and its associated justice programs are usually in the top 3 budget items in terms of expenditure. Drawing on my previous experience as a police officer in the Royal Canadian Mounted Police, I personally witnessed how poor planning policies at all levels of governments resulted in the emergence of criminogenic factors that would ultimately manifest in the crime that plagued communities. In my view, a city that is first and foremost safe both in operation and perception sets the foundation for its
inhabitants to pursue their legitimate interests to the fullest extent.
Women will take public transit, customers walk the main street well into the night, and children will play outside. Time and time again, it has been showed that in large and complex cities, it is virtually impossible to simply arrest your way out of a crime problem. The drug war has
escalated drug use, three strikes laws have led to prison overcrowding, and unadulterated stop and frisk has created a rift in trust between the public and police. I must stress here that I am not opposed to strong and appropriate law enforcement action when necessary but am advocating for us not to forget that it should be coupled with the applicable community, social, and economic services from outside law enforcement to prevent the next generation from following the same path. In short, a Marshall Plan for the neighbourhood. This central question in the public safety debate is emerging in Toronto as this past summer has been the deadliest in recent history with a
My thesis aims to assess how the Strong Neighbourhood Strategy 2020 (TSNS 2020) has worked to address criminogenic factors in Toronto's Kingsview neighborhood. TSNS 2020 is a
community and economic development strategy overseen by the City of Toronto. Using a series of indicators it selected 31 vulnerable neighbourhoods to try to strengthen by 2020. TSNS 2020 works with local residents and pre-existing community resources to create and operationalize plans that will address inequities in these neighbourhoods. The term criminogenic factor is often used in criminological literature to describe those inequities that can lead individuals in a
neighbourhood to have a strong propensity to commit crime. Since I lived in Kingsview in the early to late 1990's, the neighbourhood has been a rich breeding ground for criminogenic factors that are now manifesting themselves in the gang violence that we see in the city today.
Specifically, the Somali community in Kingsview that largely arrived in the city as refugees from the Somali Civil War has fallen prey to these factors and bears the brunt of the violent crime as both perpetrators and victims. This community will be the focus of my thesis because I believe that much of the solution in addressing crime lies in effectively tailoring the strategy to empower them.
The strategy is a first of its kind in Toronto and despite certain early missteps, it certainly has the potential to fulfill the often-ignored gap of community triaging and service coordination in the public safety debate. As a police officer and a private consultant for the public sector, I learned that cultivating innovation is a struggle in government because of the strong risk adversity from political leaders. However for innovation to thrive, mistakes must first be made. With this
principle in mind, the final section of my assessment provides recommendations that TSNS 2020 can employ to address its early shortcomings in order to deliver good results as it approaches its final evaluation date.
Research Question
The central questions that guided my research are:
" Has the presence of the Toronto Strong Neighbourhoods Strategy 2020 led to a reduction in violent crime in Kingsview?
* How has the strategy worked towards addressing criminogenic factors in the community? " Based on my findings, what can the strategy do to address its shortcomings while
continuing to produce its strengths?
These questions provide me with the flexibility to understand the strategy from its conception to its implementation on the ground and make cogent recommendations on the future direction it should take.
Urban Context
The City of Toronto
Home to over 2.9 million people and with a Census Metropolitan Area of over 6 million, Toronto is Canada's largest city and the capital of the province of Ontario.' Toronto is the focal point of the Canadian economy and supports a diversified base of financial, scientific, manufacturing, and educational sectors. A report issued by Statistics Canada indicated that nearly 20 percent of Canada's gross domestic product is generated by the Toronto metropolitan area." One of the most celebrated aspects of the city is its demographic diversity. Over 50 percent of the population can be categorized as part of an ethnic minority group and Toronto and its surrounding Census Metropolitan Area routinely absorbs around 56 percent of all new immigrants to Canada."' The gross domestic product is $168 million and GDP growth has
consistently held at over 2 percent for the last 5 years. The unemployment rate in Toronto is 5.9 percentiv and the total household income is $98,174. v
Municipal Decision Making in Toronto
At the writing of this thesis the mayor is John Tory who was democratically elected through a city wide popular vote. The city is divided into 44 wards each represented by a city councillor. Despite each councillor and the mayor possessing their own political leanings, there are no official political parties in Toronto municipal politics and many municipal committees are composed of members from both sides of the political spectrum. The mayor's cabinet is known as the Executive Committee and is comprised of the Mayor, Deputy Mayor, and the chairs of the seven standing committees who are appointed by the Mayor and four "at-large" members
appointed by City Council. The Executive Committee is responsible for establishing the City of Toronto's priorities, financial planning and budgeting, labour relations, human resources, and the operation of City Council.
Poverty in Toronto
The economic story of Toronto is the tale of 2 cities and presents one of the greatest challenges in modem Toronto governance. Thirteen city wards have areas of child poverty where rates are 50% or more.vi According to Statistics Canada, 20.2 percent of people in Toronto qualify for low income status and 1 in 4 children in the city are living below the poverty line, the highest rate amongst Canadian urban centres." The municipal government has recognized the need to intervene in order to reverse these alarming trends and has instituted a series of strategic
initiatives like the Toronto Poverty Reduction Strategy and the Young Equity Strategy aimed at defining and targeting the social and economic root causes of Toronto poverty. As sections of the
city rapidly gentrify, Toronto wants to ensure that its current residents do not suffer the typical fate of being pushed to the fringes of the city and eventually out altogether.
The story of poverty in Toronto is indicative of a city in economic and social transition. In the 1970s, one in 10 adults were living in poverty and middle-income neighbourhoods comprised 67 percent of Toronto.i" True to its nickname, "The Big Smoke," Toronto's strong manufacturing base provided reliable union waged employment to many residents and the majority of people looking for work qualified for employment insurance.ix A mix of middle-class flight to
surrounding suburban feeder cities like Mississauga, Pickering, and Vaughn, the rise of the city's knowledge economy, and bias towards investing resources in the Downtown core has resulted in the neglect and decline of many Toronto neighbourhoods beyond the periphery of the downtown.
Violent Crime in Toronto
Like most urban centres, Toronto has a crime profile ranging from property crimes with
liabilities under $5000 to homicides. However, when contrasted with other North America cities of similar demographic compositions like Houston and Chicago, Toronto's level of violent crime is considerably lower. For example in 2012, Toronto report homicide and robbery rates of 2.0 per 100,000" respectively whereas Chicago reported homicide rates of 18.5 per 100, 000x". In 2005, Toronto had a spike in homicides labelled by the media as the summer of the gun. Mounting public pressure resulted in the city and province revisiting how public safety policy was implemented in the city. With financial help from the province, the Toronto Police Service established the Toronto Anti-Violence Intervention Strategy (TAVIS). TAVIS units entered into Toronto neighbourhoods that were struggling with high rates of violent crime particularly
could later be leveraged when witnesses were needed during an investigation or the police was gathering preventive intelligence.xiii TAVIS led to more than 19,000 arrests and 1,200 guns seized off the street. During the life of the program, violent crime in Toronto decreased but accusations of the program disproportionally targeting African-Canadian communities led to it being disbanded in 2016.x'v As of July 1, 2018, Toronto has seen a spike in violent crime.
Toronto shootings are up 16 percent from last year and homicides have increased 121 percent.xv The rise in violence is mostly concentrated between street gang conflicts but the public is once again calling for TAVIS or a similar program to be reinstituted.
Chapter 2: The Toronto Strong Neighbourhoods Strategy 2020
Overall Program Goals
TSNS 2020 is the City of Toronto's action plan to empower local residents so that each of the
city's 140 neighbourhoods can benefit from the economic boom that Toronto is experiencing in
an equitable and sustainable way."i In Toronto, there is a correlation between where a Toronto
resident resides and the social, health and economic outcomes residents achieve.xv"i TSNS 2020's objective is to leverage collective actions to address these inequities so fewer Toronto
neighbourhoods will be below the strategy's benchmark by the end date in 2020."'I As the most
vulnerable neighbourhoods strengthen, it is believed that Toronto will experience marked
improvements in all 140 neighbourhoods.xx TSNS 2020 seeks to build healthy communities
across Toronto by partnering with residents, businesses and agencies to uncover the investment
gaps in human capital, services, programs, and facilities in 31 specific neighbourhoods, known
as Neighbourhood Improvement Areas (NIAs)." TSNS 2020's overarching philosophy proposes that the right balance of investments and community input will ultimately strengthen the social,
economic and physical conditions within these 31 neighbourhoods and deliver positive local
Strategy for Crime Reduction
TSNS 2020's takes a future oriented outlook on crime and attempts to address it from a preventative standpoint. Rather than focus solely on enforcement actions like many crime reduction strategies do, TSNS 2020 views crime as an outcome of social conditions in a
neighbourhood."" Consequently, it purposefully targets the root causes or social determinants of crime as a way to prevent criminal behaviour before it starts."i For example, many children from Kingsview's Somali community live a situation of multigenerational poverty and according to my community contact this breeds a sense of futility."iv One of the methods used to combat this sentiment was taking the children to a university that has created lectures for children." By showing and allowing them to interact with a world outside their neighbourhood, TSNS 2020 opens a world of possibilities that they typically would not be exposed to.xxvi A more detailed discussion of TSNS 2020's programming can be found later in the thesis but the main take away should be that TSNS 2020 wants to equip neighbourhoods and residents with the competencies that will create and unlock enough legitimate opportunities that criminal behaviour becomes a more costly personal choice.
How were the NIAs chosen?
The NIAs were selected based on the Urban Health Equity Assessment and Response Tool (Urban HEART), an evidence-based standard for gauging the wellbeing of neighbourhoods."vi Urban HEART was inspired by a tool developed by the World Health Organization to reveal "hidden cities", a local geography within the larger urban area the suffered from greater inequities."vii' The City partnered with United Way Toronto, the Centre for Research on Inner City Health, the Toronto Central Local Health Integration Network, and other partners to form
the Urban HEART@Toronto project and engaged 80 researchers representing the community, public, private and academic sectors to generate the best available measures of neighbourhood equity from five diverse perspectives: Economic Opportunities, Social Development,
Participation in Decision Making, Healthy Lives and Physical Surroundings.XXIX
The goal of TSNS 2020 is to achieve equitable outcomes for all neighbourhoods and create more resilient neighbourhoods that are prosperous, vibrant, and safe. Understanding that some
neighbourhoods experience more inequity than others, TSNS 2020 takes a neighbourhood level approach to remedy them.
The following table displays the indicators in more detail:
TSNS 2020 Equity Indicators= Low Income Social Assistance Unemployment Diabetes Mental Health Premature Mortality Preventable Hospitalizations
Social Development High School Graduation
Marginalization
Post-Secondary Completion
Community Places for Meeting
Green Space
Healthy Food Stores
Economic Opportunities
Healthy Lives
Physical Surroundings
Walkability
Participation in Decision- Municipal Voting Rate
Making
Using Urban HEART, all of Toronto's 140 social planning neighbourhoods were analyzed and assigned a Neighbourhood Equity Score.xi Neighbourhoods that scored below the
Neighbourhood Equity Benchmark (a composite score that signals that the overall inequity burden faced by a neighbourhood) were recommended to Council as NlAs."x" The score was
used to compare how neighbourhoods in Toronto are faring relative to one another in terms of
overall equity of outcomes.""'i A lower score means that the neighbourhood faces more inequities and poorer outcomes, and a higher score means that a neighbourhood has fewer
inequities and has better outcomes."Iv There are 31 such neighbourhoods across the city. One of the challenges that the TSNS 2020 faced in its implementation is within the geographic confines of a neighbourhood, it is not uncommon to have a great variation in the inequities experienced by residents in different pockets."v
Strategy Implementation in NIAs
During implementation planning, the city engaged their community partners to determine where collective energy and investment would have the most impact on resident outcomes. Depending on the needs of the community, some investments were specifically targeted whereas others had wider applications. The TSNS 2020 implementation plan was developed in partnership with residents, community agencies, funders, and Toronto Public Library, Toronto Public Health, Toronto Community Housing Corporation, and City divisions has three key objectives""v:
*Activating People
- Mobilizing and empowering local residents to lead the discussion around the challenges and potential solutions for their neighbourhoods. This can include but is not limited to attending meetings, writing grant applications, and starting new organizations to lobby for what they want.
*Activating Resources
- Before funneling new money into the community, taking account of what programs and organizations are already working there and forming partnerships that will alleviate resource demands and prevent duplication.
-Activating Neighbourhood-Friendly Policies
- Based on the outcomes of stakeholder engagements with residents, municipal
departments, and local organizations, the new policies enacted should be reflective of the community needs.
How does TSNS 2020 engage the community?
Citywide public consultations took place in 2013. A total of 380 residents were engaged directly through City-led and agency-led meetings."')vii An additional 1,400 residents also shared their thoughts through an online survey that was also made available in print format.""
After the initial consultation, a series of meetings were also held between January and February 2014 with both past and potential implementation partners to review and comment on two options developed for creating a Neighbourhood Equity Score and provide early advice on implementation issues.xxxix
Residents also shared their thoughts through a survey available online and in print format across several language groups.I
The following map represents the geographic distribution of the NIAs in Torontoli:
14 34 52 am i ~~10 11 - 311 3 21131 1222 Funding Structure
TSNS 2020 compels city divisions, agencies, and city partners to align and synchronise investments and actions at the local level to improve equitable outcomes for residents. To initiate this processxlii:
- 9 Community Development Officers (CDO) were hired to manage TSNS 2020 operation at the neighbourhood level;
* $12M in capital funding was allocated by City Council to advance community
infrastructure in NIAs. The first round of funding was $3M in 2015. TSNS 2020 sought to identify various approved City and partner strategies that can be combined to form
investment portfolios with a mix of investments that can be made in each NIA to streamline operational efficiency.
The program was commenced in 2014 and the program's end date is 2 0 2 0.*x"" There will be a
formal evaluation conducted and presentation of the results to council.xl" To date, this document represents the one of the first examinations of any form for TSNS 2020.
Unlike many community/economic development programs attempted in the past, TSNS 2020 has made an effort to descend from its high level policy perch and embedded a forum for strong community input into the operational process.
TSNS 2020 Progress at a High Level
Since the program's inception, over 24,000 residents, 1,700 stakeholders and 21 City Divisions and Agencies have been engaged in coordinated service planning and delivery in 31 NIAs.xIv
15 neighbourhood planning tables were formed across the 31 NIAs consisting of residents, businesses, community agencies, Councillors and city staff to identify priorities and actions that supported neighbourhood well-being.xlvi Each of the tables is supported by a CDO whose role is to connect residents with decision makers so that neighbourhood goals and priorities are
addressed through responsive policies and programs, and resident-led initiatives.Ivii
To ensure that TSNS 2020 upholds its promise of incorporating residents input into the decision-making process it has employed a few different strategies.
TSNS Resident Advisory Committee (RAC)
The implementation of TSNS 2020 is led by RAC in partnership with City staff and community agencies. Established in 2015, the RACs are composed of residents who live in the NIA and give
a resident voice to TSNS activities as well as engagement opportunities for other residents in local planning processes and initiatives.IVi" To be selected for RAC membership, one must state a public expression of interest that follows the City of Toronto's Public Appointment protocol.
A "Call for Participation" was posted on the City of Toronto's Social Development, Finance and Administration website as well as distributed through other networks and agencies, like the City Councillors' offices, in an attempt to include community members who did not have online access. The selection criteria includedx"x:
- Lived experience and/or experience working in neighbourhoods and active participation in neighbourhood based planning.
" Membership in Neighbourhood Planning Tables \ connected to TSNS 2020.
- Demographic diversity, including age, gender and cultural origin with racialized community representation and gender balance.
The RAC met on a quarterly basis to advise staff on local planning issues, coordinate city-wide events, and ensure accountability throughout the implementation of TSNS 2020.
RAC members have provided input on the development of the TSNS 2020 programs including the POL.' RAC members provide resident expertise and perspective at numerous meetings and events and often lead initiatives such as the TSNS District Summits."
Neighbourhood Planning Tables and Action Plans
The Neighbourhood Planning Tables and Action Plans are co-producing initiatives that benefit individuals and the larger community. As neighbourhood residents collaborate with City
Councillors, local businesses, community agencies and City staff tailored solutions are beginning to come to fruition. Some of the most notable successes include addressing issues of food
insecurity through holding a canning, pickling and preserving workshop and introducing youth that are interested in STEM professions to programs that will provide them with mentorship and access to people in the field."'
All planning tables have developed Action Plans that reflect their priorities and activities for strengthening neighbourhood wellbeing. To date 210 actions have been identified across the 31 NIAs. The following common themes have emerged from the Action Plans"":
- Healthy Lives: access to healthy food, nutrition information and wellness activities
- Economic Opportunities: advocacy for community benefits agreements including job
opportunities from transit development; access to employability skills including food handling and other food sector skills development and financial literacy programs
- Physical Surroundings: community service hub expansion; green space and arts and cultural space allocation; and access to more recreational spaces
* Social Development: resident leadership and local network development; youth engagement; and access to education and literacy programs
- Participation in Decision-Making: civic engagement; resident group development; and youth leadership and advocacy.
Local Champions Pilot
In June 2016, Council directed $200,000 toward a post-secondary certificate/credit training pilot program for residents from NIAs to build local leadership capacity."" The pilot provides an opportunity for residents to assume leadership roles such as facilitators, animators and project developers and build resident skills and confidence, so they can aptly participate in decision
making related to the delivery of local TSNS 2020 actions.v It also acts as a resume builder because participants improve their educational and employment potential when they become involved.vi
Activating Resources
TSNS 2020 recognizes the need to develop collective assets at the local level to ensure every Toronto neighbourhood has the public, private and community infrastructure required for equitable resident opportunities.lii TSNS 2020 works with various funding partners to enhance community amenities.lviii
Partnership Opportunities Legacy Fund (POL)
As part of its 2014 Capital Budget process, City Council approved a total of $12M for infrastructure investments in NIAs.lix $3.1 million has been allocated to 11 projects.x Funded projects included playground upgrades, recreation and community hub space development, community gardens, outdoor splash pads and water play areas. 1xi
As part of the 2017 Capital Budget process staff recommended an allocation of $5.048 million to fund 12 projects, bringing the total POL capital investment in NIAs to $8.148 million.lxii
The following are a sample of capital projects have been identified for 2017'xi":
- Children's playground and pollinator garden at Roding Park
- Improved viewing area, floor and snack bar at Angela James Arena
- Create community space at 1652 Keele St. Hub
Chapter 3: Methodology:
My thesis methodology largely consists of qualitative interviews with members of the city administration responsible for TSNS 2020 at a citywide and local level. To provide a grounding for my interviews, I also engaged in a minor time-series analysis that tracked incidences of violent crime in Kingsview and a comparison neighbourhood, Willowridge, before and during the operationalization of TSNS 2020. The structure of the thesis takes the form of a consultant's
report is inspired by what I learned while performing public policy consulting at KPMG. The content flows accordingly: an explanation of TSNS 2020's moving parts, an introduction to the concept of criminogenic factors and their affect in Kingsview, an assessment of the TSNS 2020's work plan on Kingsview based on what I discovered during my interviews, and lastly, providing a compendium of recommendations that the TSNS 2020 could explore to help fortify their efforts towards reaching their mandate. The reason I only chose a single neighbourhood is two-fold. Firstly, each NIA operates independently under the overarching framework of TSNS 2020 and produces action plans tailored to the specifics of their locale. After filtering through the NIAs, I found that they each had unique challenges within them so it would be a more useful endeavour to perform a deeper analysis of what was occurring within one specific NIA. The second
difficulty I had was data gathering. In the short period I had to complete my research, it was most realistic to pursue my analysis with the neighbourhood I had the most familiarity with and could obtain the greatest amount of data.
Selecting Neighbourhoods
The Social Research Unit at the City of Toronto had assembled Demographic Neighbourhood Profiles for each of the 144 neighbourhoods based on the statistics collected from the 2016
National Census. After filtering out the 31 neighbourhoods involved in TSNS 2020, I decided to select the Kingsview-Westway neighbourhood as my treatment neighbourhood (the
neighbourhood that received the attention of TSNS 2020) and Willowridge as my comparison neighbourhood (a neighbourhood that shares similarities with the treatment neighbourhood but did not receive the attention of TSNS 2020). Using the treatment and control neighbourhoods, I sought to contextualize how criminogenic factors can alter the level of crime committed between 2 demographically similar neighbourhoods. My intention was to highlight the power of
criminogenic factors in a neighbourhood and showcase why it is important for TSNS 2020 to mitigate these factors as much as possible to achieve successful crime mitigation/prevention outcomes.
During the pre-interview research stages, the Social Research Branch at the City of Toronto was kind enough to provide me a package of orientation materials used to introduce TSNS 2020 to leaders in the political, community, and bureaucratic spheres. Included in these materials was a map of major crime rates for each neighbourhood in Toronto in 2014. The neighbourhoods in TSNS 2020 was bolded in black and I used the map as the starting point from which I could launch my investigation. I compared the bolded TSNS 2020 neighbourhoods to neighbourhoods that were demographically and geographically similar but not included in the strategy. First, I
looked at which neighbourhoods were in close proximity to each other and shared similar overall geographic features like being close to Lake Ontario, sharing a neighbourhood boundary,
distance from downtown etc. Kingsview and Willowridge share a border and are the same distance from the downtown, yet residents in these neighbourhoods are living 2 very different realities due to what is available to them socially and economically. The next important step was using the demographic profile provided by the City of Toronto to compare my treatment and
control neighbourhoods. Here I could ensure that the pairings were appropriate based on similarities in population density, number of residents classified as low income, and the
demographic compositions based on age. I chose these three characteristics because I have found a correlation during my law enforcement career between areas with larger numbers of young, low income backgrounds living in denser urban environment, and higher crime. The subsequent graphics obtained from the City of Toronto display thee similarities in Population Density, number of people classified as low income, and demographic breakdown by age. Within the graphics, rates for the citywide demographic are stated for reference where available.
Figure 1: Population Density in Kingsview and Willowridgelxiv
DR Population 22,156 Population Chang"*38 2011-2016 +3.8% Population Densky 4,007 peop per st Kingsview Population Population Change 2011-2016 Population Density qae km Willowridge 22,000 +1.3% 4,356 people pe nqure hkm
Figure 2: Number of residents classified as low income in Kingsview vs Willowridge" Willowridge
Low Income Measure (After Tax)
Under 6 25.9% Under 18 24.1% 18 to 64 13.4% 65 and over 11.3% All 15.0% Allt*
0 Willowridge-Martingrove-Richview K City of Toronto
Kingsview
Low Income Measur. (After Tax)
Under 6 42.5% Under 18 39.6% Is to 6422.9% 18 to64 65 and over 11.0% AN 24.9%
a Kingsview Village-The Westway v City of Toronto
Figure 3: Demographic Breakdown by Age in Kingsview vs Willowridgelxvi
Willowridge Population
='El..--0 C* 4 6 6 ~ ~ 6 6 J Female
52%
Male48%
Children 0-14 years4,235
(19%) City Rate: 15% Youth 15-24 years3,020
(14%) City Rate: 12% Working Age 25-54 years8,635
(39%) City Rate: 45% Pre-Retirement 55-64 years2,550
(12%) City Rate: 12% Seniors 65+ years3,585
(16%) City Rate: 16% 1,000 Female 500 0 Male 500 1,000 IKingsview
1,000 Female
Male
Km
1.000
Children Youth Working Age Pre-Retirement
0-14 years 15-24 years 25-54 years 55-64 years
3,560
(16%)2,625
(12%) 8,140 (37%)2,905
(13%)City Rate: 15% City Rate: 12% City Rate: 45% City Rate: 12%
Female
52%
Male Seniors 65+ years4,920
(22%) City Rate: 16%Although it is very difficult to obtain direct matches between treatment and comparison neighbourhoods in a city as diverse as Toronto, Willowridge is fairly good comparison
neighbourhood as it shares many similarities with Kingsview without producing the same level of violent crime.
Data Analysis
The data analysis I undertook was a very simple comparative crime data analysis. The Social Research Branch at the City of Toronto provided me with 2011 data of crime (Robbery, Assault, and Homicide) that had been collected from each Toronto neighbourhood. The Robbery, Assault, and Homicide data for 2014-2017 was downloaded directly from the Toronto Police Service's Open Data Portal. For an undisclosed reason, I was unable to obtain authorization from the Toronto Police Service to have the data released to me for the years 2009, 2010, 2012, and 2013. As a result, I do not have a true sense of what the crime situation was in the two neighbourhoods immediately before the initiation of TSNS 2020. This limitation meant that I could only look after 2014 to determine if there was any noticeable change in the instances of violent crime post
strategy initation. All my data was downloaded in .CSV excel format and I used Microsoft Excel to clean the data until only the Robbery, Assault, and Homicide data for Kingsview and
Willowridge remained. From this data, I generated line graphs that compared the treatment and control group pairing of Kingsview/ Willowridge in the hopes of displaying the variance in crime in the two neighbourhoods. To ensure that my comparison of crime figures were accurate, all figures were normalized by 100,000.
Interviews
Interviews comprised the bulk of my exploratory analysis and were separated into 2 phases. 6 individuals were interviewed from across various levels of TSNS 2020 administration. These included public officials involved in strategy design and implementation, as well as community leaders who actively worked or engaged with TSNS 2020 from the Kingsview Somali
community.
The first phase involved speaking with executive management that were responsible for the initial TSNS 2020 conceptualization, program design, and high-level execution. I started with an official from the Social Policy Research Branch for the City of Toronto as they were the
individual responsible for determining TSNS 2020's strategic model."" They were able to explain how TSNS 2020 was formulated and how the NIAs were selected."i' They also explained the evolution of the program from its first rendition in 2005 that focused on service delivery in underserved communities to a program that looks to unlock local resources and make strategic investments that will address neighbourhood inequities.lx'x The second individual that I interviewed was from the Community Development Branch at the City of Toronto. From their position, they oversaw how TSNS 2020 was operationalized in its NIAs through supervising and
providing overall strategic guidance to the CDOs in each NIA.Ixx They introduced me to the guiding philosophy of TSNS 2020 and the motivations that drove its execution. Through this interview, I also gained a sense of the program's progress to date at a strategic level and learned about how the strategy was intended to evolve past 2020.
The second phase of interviews involved me moving closer to the ground to speak with
individuals specifically working in the Kingsview neighbourhood. I began the second phase by interviewing the CDO for Kingsview. The CDO's role is to operationalize the strategy within the NIA.xxi They lead the neighbourhood planning tables and work to bring various stakeholders together to achieve the buy in necessary to formulate action plans that would result in
community improvement.xx" The CDO was able to provide insight into the process of bringing stakeholders to the tables, retaining participation, managing personalities, etc. They introduced me to some of the individuals that participated in implementing the strategy from roles at other city departments and local residents' organizations. Despite the endorsement of Kingsview's CDO, I still struggled to connect with other Kingsview neighbourhood planning table
participants from the city including Toronto Public Health and Toronto Employment and Social Services officials. I was later informed that these public officials were apprehensive about mispresenting their agency. I was particularly disappointed that I was unable to speak with a Toronto police officer from 23 Division. Given that law enforcement is exposed to
neighbourhood problems in their rawest form, their perspective on community development strategies, root causes of crime, and work with other agencies would prove invaluable to my analysis. However, due to severe budget cuts and staff shortages, I was unsuccessful in obtaining their cooperation. I filled this gap by performing my own analysis of crime trends based on input from local residents, the available data, and my own personal knowledge about the
neighbourhood and law enforcement. I was able to conduct a very interesting interview with an official from the Richview Public Library. They provided insight into how the Toronto Public Library interacts with the strategy as well as how various City of Toronto organizations align their goals with overarching governance strategies dictated through city council.
My two most potent interviews were derived from 2 Somali leaders from the Kingsview
neighbourhood. Due to some controversial opinions, I chose to keep their identities and positions confidential so they could continue to pursue their good work without fear of political backlash or being defunded. They provided a perspective that greatly differed from the city staff and oriented me to a many of the shortcomings at the strategic and operational level.
Identifying Criminogenic Factors in Kingsview
After the second phase of interviews, I compiled the qualitative data I gathered to look for the main themes that were mentioned repeatedly as the causes of crime. I ended up with education, poverty, capital flight/geographic isolation, and mistrust of government and law enforcement. From here I began to conduct background research for each factor to supplement the qualitative data I obtained. I was able to pull statistics and studies on the severity of all these factors in Kingsview weave them into exactly how they were contributing to the elevated violent crime rates.
Site Visit
Growing up in Kingsview and my background in law enforcement afforded me the comfort to visit the neighbourhood to get a first-hand perspective on what people who lived there were seeing daily. I documented my experience photographically and tried to capture the essence of what it is to be a low income Kingsview resident. I specifically looked for the conditions that
were highlighted to me during my interviews and tried to observe how residents moved around public space. I made it a point to visit both the low-income high rise and upper income single family sections of Kingsview to obtain a sense of the divide that existed socioeconomically. Additionally, I was on the lookout for anyone performing illegal activities publicly and was successful at documenting a case of drug dealing. It was through my site visit that I truly began to understand why Kingsview was selected as an NIA and the dynamics of the neighbourhood that both helped and hindered it.
Measures of Success
I measured TSNS 2020's success across two main factors. First and most immediately, the decrease in violent between 2014-2017. An assessment of the immediate rates of crime
permitted me to determine whether TSNS 2020, with its bias to solving long term criminogenic factors, can still have a positive impact on immediate crime. The next measure of success, that I also believe to be a better indicator of the strategy's progress, is a gap analysis between the plans, practices and implemented actions of the TSNS 2020 in Kingsview and how they actually address criminogenic factors in Kingsview. This success indicator is what inspired the majority of my recommendations.
Limitations
During my initial conversations with Social Research at the City of Toronto, we both perceived that obtaining data would be easy because the city had a multitude of data available from various agencies. I ran into my first roadblock when seeking expanded crime data. The robbery, assault, and homicide data from 2008, 2011 and 2014-2017 was publicly available but for some
Research, we attempted to obtain that data from the Toronto Police Service's research head but were ultimately successful. The absence of these 2 years curtailed my ability to paint a picture of the state of criminal behaviour in Toronto just prior to TSNS 2020's commencement.
Additionally, the resistance I received from certain partners involved in implementing TSNS 2020 to speak with me meant I was consigned to form a picture of the strengths and weaknesses of TSNS 2020 without the input of key stakeholders. Although I made assurances to treat their opinions as completely confidential if they wish, I believe that they harboured significant distrust of an outside researcher that they never met in person. Despite my best efforts in explaining that high ranking strategy officials had provided their input, I could not secured their participation. Lastly, I would have liked to speak with more community members. Although my 2 community interviewees provided me with invaluable insight into their interaction with the TSNS 2020, it is a limited sample and I cannot dispel the possibility that the information I obtained overrepresents the 2 opinions in a sea of over 22,000 residents.
Consequently, this thesis by no means meant to be a comprehensive account of how the TSNS 2020 addressed criminogenic factors in Toronto at large. In fact, with my struggles in obtaining the necessary qualitative and quantitative data, I think my thesis is taking on more of an
exploratory analysis of TSNS 2020 in the Kingsview neighbourhood. In a city as large and diverse as Toronto, it is simply not possible to generalize my findings onto the larger municipal
scale with the requisite data and rigor. If I had more time and resources, I would have conducted significantly more interviews both within the municipal administration and different groups within the Kingsview neighbourhood. I would have also pushed for more quantitative data to be released to me, so I could have the best chance at avoiding selection bias. Nonetheless, this thesis still has value in providing the City of Toronto and those involved in administering TSNS
2020 to reflect on how they can formulate their own evaluative criteria and methods based on the challenges I had in conducting my analysis. It is my suggestion that future evaluations take both a macro and micro level approach to observe TSNS 2020's progress and independently gather data where it does not currently exist.
Chapter 4: Literature Review
Criminogenic FactorsThe bulk of my thesis explores how TSNS 2020 addresses criminogenic factors that contribute to crime. Criminogenic factors are those characteristics within a space that contribute to a
propensity for its residents to pursue criminal behaviour. The criminological literature will often refer to criminogenic by other monikers such as 'root causes of crime' or the 'social
determinants of crime.' In Kingsview, I have determined through my interviews that the criminogenic factors that have the greatest impact on the community are education, poverty, geographic isolation, and mistrust of law enforcement. These factors are well reflected as root causes of crime in many global communities globally.
The quality of education in Kingsview was cited as the single greatest factor in criminal outcomes for residents. Hjalmarsson and Lochner compared global research on the effect that quality education has on crime. Linking the FBI's Uniform Crime Reports for the US in 1960, 1970, 1980, and 1990 to 1960-90 decennial US Census data on educational attainment and race, the researchers uncovered that a one-year increase in average education levels in a state reduces state-level arrest rates by 11 percent or more."'" These results correlated very closely with the increase in wages associated with each additional year of school by the estimated effects of higher wage rates on crime.'v The authors also insinuated from the data that the effect of schooling on crime may come through increased wage rates (making criminal behaviour more personally expensive) and opportunity costs (putting future opportunities at risk by engaging in criminal activity)."v Hjalmarsson and Lochner did not go into detail about how different jurisdictions pursued increasing educational attainment but their findings certainly provide
I analyze TSNS 2020, the authors' research helps me bridge the divided between how education and poverty alleviation are integral to crime reduction. I will be keeping these results in mind when assessing TSNS 2020's work plan to determine whether they give education enough importance while generating their action plans.
Heller et al. conducted a review of existing theory and evidence related to the correlation between poverty and crime. They found a correlation between neighbourhood poverty, family income, and crime and that increases in incomes generally have positive impacts on crime. 1xxvi However, not all neighbourhood wealth creation strategies are created equally. For example, transfer programs providing a 50 percent average increase in family income (averaging around
$14,000) reduce violent and total arrests by 20 percent for males."xxvii The authors inferred that it is not sufficient to simply reduce poverty by raising income. Rather, one must look at the
improvements in human capital that results from the increased wealth (people with more can will invest more in themselves and children) as a complimentary reason for the improved
criminological outcomes."xx'iii In addition to informing how I assess the poverty reduction
elements of TSNS, Heller et al.'s work compel me construct recommendations on how to expand the poverty reduction efforts from an exercise in increased income generation to having a strong focus on human capital building to ensure long term, multi-generational success for residents.
The last criminogenic factor I want to highlight is the distrust of law enforcement. Tyler and Fagan used a panel study design of 830 New York City residents who were either white,
Hispanic or African-American to examine whether perceived legitimacy of police, measured by trust, obligation, and confidence in police, generated increased cooperation with police during investigations. The results indicated that communities reporting a higher trust in law enforcement were more likely to cooperate with police efforts. lxxix Police legitimacy and involvement is an
important aspect for TSNS 2020 to consider expanding into. The strategy in its current
conception does not have an immediate crime control element which makes operationalizing the remainder of its programming more difficult.
Urban Crime Prevention
Crime prevention strategies have evolved significantly over the last 50 years with the advent of more data driven evaluative techniques. In the 1980's and 1990's, crime mitigation took on a very reactive approach with law enforcement spearheading the response. Approaches like Stop and Frisk (officers randomly stopping and searching individuals that they suspected of having weapons or drugs on them) and Disorder Policing (officers focusing on arresting individuals engaging in public disorder offences like drunkenness or vagrancy) emerged from this philosophy. Stop and Frisk, in particular, was extremely controversial in how it focused on communities of colour without providing any strong metrics on its effectiveness. In 2018 German Lopez, a journalist at Vox, analyzed historic New York City crime data and found that only 1 percent of the Black people stopped and searched were found to be in possession of weapons or contraband.xxx The low success rate indicated a weak correlation to randomized and
instinctual policing and crime control but it did show great increases in public distrust of
police."xxxi Alternatively, Braga et al conducted a meta-analysis of 269 studies analyzing various Disorder Policing strategies.xxxi" They found that policing disorder led to statistically significant reductions in crime only when taking a community centred orientation. lxxxiii When law
enforcement worked with citizens and city agencies they were better suited to coproduce crime prevention actions.xxx"v Braga et al.'s meta-analysis supports the notion that it is not possible to arrest your way out of crime problem and that creating a united front between the law
TSNS 2020 does not include a strong policing element, I also looked at literature on programs that targeted criminogenic factors in their communities without a strong police presence. Delgado et al. used a quasi-experimental design to compare the effects of the Cure Violence program between demographically similar neighborhoods in the Bronx, East New York, and
Brooklyn. Cure Violence is public health inspired crime prevention program that partners with local organizations in their target neighbourhoods to prevent crime.'."". The local organizations understood that one of the main criminogenic factors contributing to gang violence was an
inability to deal with interpersonal issues amicably.lxxvi Workers would canvass the
neighbourhood and seek out local intelligence on emerging conflicts between young males and attempted to help solve the problem prior to bloodshed."vi" They analyzed 4 communities of
similar demographic composition. Two received the treatment (South Bronx and East New York) and two did not (Flatbush and East Harlem) from 2005-2016.'"' Over the analysis period, East New York experienced a 50 percent decrease in gun violence and South Bronx decreased by 37 percent.lxxxx Programs like these suggest that there is a potential for programs to compliment the crime prevention outcomes of the police. It also suggests that a longer evaluation period should be undertaken when looking at crime prevention strategies.
Geographic isolation remains a tricky criminogenic factor to address for a city as those cities that have been successful at strengthening vulnerable neighbourhoods often see their residents
relocate to more desirable areas. This is noteworthy for TSNS 2020 as part of its theory of change involves resident engagement in the hopes that those who feel they have a stake in their communities may not immediately want to leave when their economic situation improves.
Similar Strategies/ Programs
I found it difficult to find a precedent program for TSNS 2020 in the literature. Typically, strategies have focused in on one criminogenic factor like education, poverty, etc., so I am inclined to believe that TSNS 2020 is part of a new wave of social programming that takes a more all-encompassing view on strengthening neighbourhoods. The lack of an academic presence for these types of programs presents an opportunity for my exploratory analysis to contribute some preliminary literature to the field. Alternatively, it makes benchmarking the progress of TSNS 2020 challenging because I cannot draw from the experience of similar programs to understand what realistic performance expectations are.
Chapter 5: Social Causes of Crime in Kingsview
What are Criminogenic Factors?
The term criminogenic factors will be used extensively throughout this thesis paper. The term is relatively new in criminological circles and is often referred to as inequities in sociological and social planning literature. Essentially, criminogenic factors are those characteristics in the built and social environment, be it a neighbourhood or otherwise, that may put the local residents at higher risk of engaging in criminal behaviour as compared as to their fellow citizens.xc Some of the most prevalent criminogenic factors include poverty, spatial isolation from good and
services, and poor public service delivery. Consequently, TSNS 2020's focus on inequities in their neighbourhoods can be taken as a way to combat criminogenic factors. It is important to note that these factors are dynamic and shift with changes in demographics, income, and social interventions, among a host of other things. Below I will highlight the some of the main
criminogenic factors that Kingsview and in particular its Somali community are struggling with.
Criminogenic Factors in Kingsview
To comprehend the criminogenic factors in Kingsview, it is important to first understand the history of the Somali community. The Kingsview Somali Community largely arrived as refugees during the civil war in the early 1990's." i The population included everyone from highly
educated professionals with a strong command of the English language to families from the villages.xci Many of the refugees were settled in the Kingsview neighbour without supports for
familiarizing themselves with their new surroundings.xci The Kingsview neighbourhood at the time had ample access to housing but little else in the way of amenities and with no pre-existing
neighbourhood with poor bus connections to the subway line which provided access to most of the services and jobs, the community was left largely to their own devices to navigate their new
home.CV
Growing up as a member of a low-income family in Kingsview during the same time period, my family experienced much of the same conditions. However, we had certain distinct advantages in that my parents were both English speakers and were able to integrate into their new society much quicker. As a result, they could take advantage of the generous social services available to them and soon gained the resources to move to a different neighbourhood where I received countless opportunities.
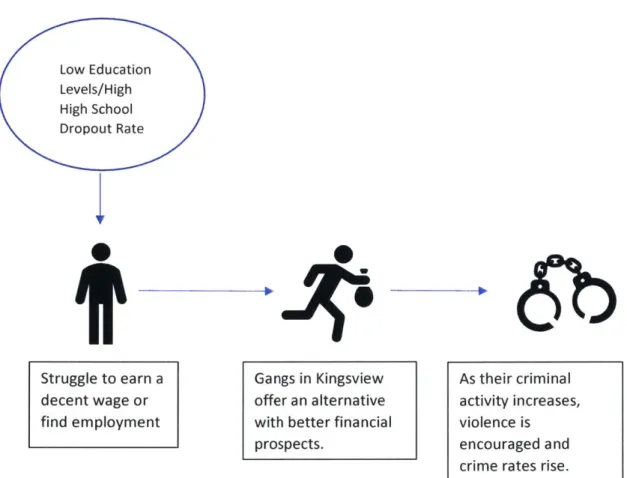
Similar to African-Americans in American inner cities, some Somali families were able to attain social mobility followed a similar path as my family and their children reaped the benefits.'cV However, in doing so, they often left behind other struggling Somali families who one of my interviewees referred to as the "poorest of the poor.""'"s It is the children of these families that are responsible for the majority of Kingsview's crime.xcVIII
The Dixon City Bloods are the predominant criminal presence in Kingsview. Composed of largely young Somali males, the gang specializes in weapons, people, and drug trafficking from the United States to Canada and begins recruiting lookouts and soldiers as young as 12 years
old.xcix This is also the gang that came into the spotlight for supplying crack cocaine to former Toronto mayor, Rob Ford. In 2013, the Toronto Police Service conducted Project Traveller which resulted in the arrest and successful prosecution of 60 gang members.'
Education
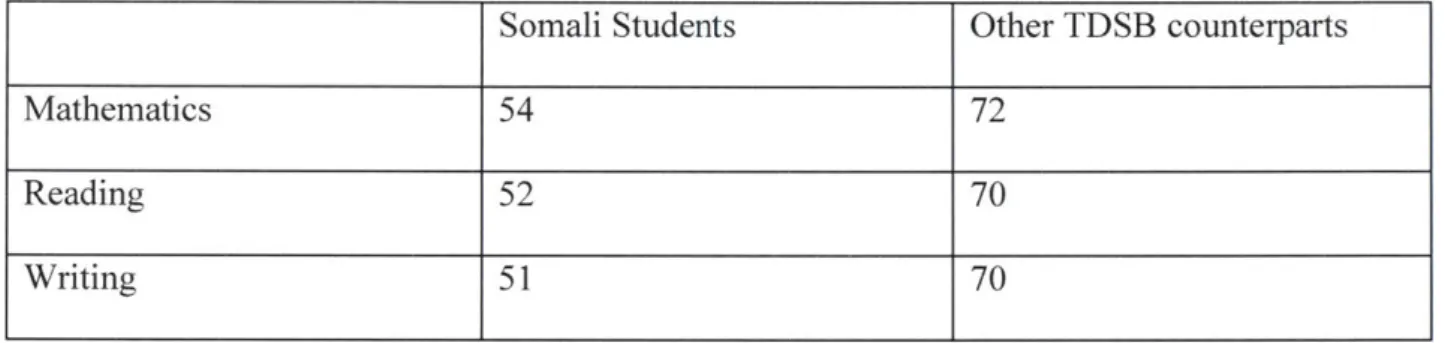
My interviews revealed that the most prominent criminogenic factor in Kingsview for the Somali community is the underperforming and disparate education outcomes within the Toronto District School Board.c In 2015, TDSB released a study that detailed the achievement of newcomer communities compared to the rest of the school board. Somali students are underperforming by almost all metrics. The following is a snapshot of how Somali students fare against their TDSB counterparts:
Table 1: Percentage of Grade 7 and 8 Students Meeting the Provincial Standardsii
Somali Students Other TDSB counterparts
Mathematics 54 72
Reading 52 70
Writing 51 70
In 2012, only 63 percent of Somali students successfully completed the Grade 10 Ontario
Secondary School Literacy Test versus 73 percent for other TDSB students.ciii The last fact that I believe requires special attention is the underperformance of Somali males in attaining high school graduation:
Figure 5: High School Graduations Rates of Male and Female Somali student in the Toronto District Public School Board:civ
N Female Somali-speaking Cohorts 0 Male Somali-speaking Cohorts 90% - - -- -th75% 76% 75% 76 73% 72% 68% 67% 67% 78 '4A 0% - -20U -05 2001-06 2002-07 2003-8 2004-09 2005-10 2006-11 2007-12 2008-13 (120 & Male (94 & Male (128 & Male (118 & Male (123 & Male (118 & Male (141 & Male (176 & Male (178 & Male
126)- 120) 101) 133) 112) 139) 126) 153) 203)
Cohort Year (student attended Grade 9)
As you can see, until recently there were significant discrepancies between the rates at which Somali male and female students attained high school graduation.
These grades reflect ages 11-15 and I used these statistics specifically because this is the age range that the local street gangs begin their recruitment. A city official in Community
Development revealed that this is also the age group at which young males drop out of school, run away from home, or fall out of the system altogether.'"
More broadly, in 2017 TDSB released a Learning Opportunities Index which accounted for the amount of external pressures students in the public school system face to learning. Ranking schools on a scale that places 1 as having the greatest external pressures, Kingsview Village Junior School placed 2 4th of 471 elementary schools.'vi By contrast, Parkfield Junior Elementary
School which serve the residents of Willowridge placed 6 4th cvii
Another cultural phenomenon that was highlighted during my interviews was that, because of their poor command of the English language, many Somali parents do not understand the nature of assessment at Canadian schools and rely on their children to honestly translate their