HAL Id: hal-00304011
https://hal.archives-ouvertes.fr/hal-00304011
Submitted on 4 Mar 2008HAL is a multi-disciplinary open access
archive for the deposit and dissemination of sci-entific research documents, whether they are pub-lished or not. The documents may come from teaching and research institutions in France or abroad, or from public or private research centers.
L’archive ouverte pluridisciplinaire HAL, est destinée au dépôt et à la diffusion de documents scientifiques de niveau recherche, publiés ou non, émanant des établissements d’enseignement et de recherche français ou étrangers, des laboratoires publics ou privés.
Envisat MIPAS measurements of CFC-11: retrieval,
validation, and climatology
L. Hoffmann, M. Kaufmann, R. Spang, R. Müller, J. J. Remedios, D. P.
Moore, C. M. Volk, T. von Clarmann, M. Riese
To cite this version:
L. Hoffmann, M. Kaufmann, R. Spang, R. Müller, J. J. Remedios, et al.. Envisat MIPAS measurements of CFC-11: retrieval, validation, and climatology. Atmospheric Chemistry and Physics Discussions, European Geosciences Union, 2008, 8 (2), pp.4561-4602. �hal-00304011�
ACPD
8, 4561–4602, 2008 Envisat MIPAS Measurements of CFC-11 L. Hoffmann et al. Title Page Abstract Introduction Conclusions References Tables Figures ◭ ◮ ◭ ◮ Back Close Full Screen / EscPrinter-friendly Version Interactive Discussion
EGU Atmos. Chem. Phys. Discuss., 8, 4561–4602, 2008
www.atmos-chem-phys-discuss.net/8/4561/2008/ © Author(s) 2008. This work is licensed
under a Creative Commons License.
Atmospheric Chemistry and Physics Discussions
Envisat MIPAS measurements of CFC-11:
retrieval, validation, and climatology
L. Hoffmann1, M. Kaufmann1, R. Spang1, R. M ¨uller1, J. J. Remedios2, D. P. Moore2, C. M. Volk3, T. von Clarmann4, and M. Riese1
1
Forschungszentrum J ¨ulich, Institut f ¨ur Chemie und Dynamik der Geosph ¨are (ICG-1), J ¨ulich, Germany
2
EOS, Space Research Centre, Department of Physics and Astronomy, University of Leicester, Leicester, UK
3
J. W. Goethe-Universit ¨at Frankfurt, Institut f ¨ur Atmosph ¨are und Umwelt, Frankfurt, Germany
4
Forschungszentrum Karlsruhe, Institut f ¨ur Meteorologie and Klimaforschung, Karlsruhe, Germany
Received: 1 November 2007 – Accepted: 3 February 2008 – Published: 4 March 2008 Correspondence to: L. Hoffmann ([email protected])
ACPD
8, 4561–4602, 2008 Envisat MIPAS Measurements of CFC-11 L. Hoffmann et al. Title Page Abstract Introduction Conclusions References Tables Figures ◭ ◮ ◭ ◮ Back Close Full Screen / EscPrinter-friendly Version Interactive Discussion
EGU
Abstract
From July 2002 to March 2004 the Michelson Interferometer for Passive Atmospheric Sounding (MIPAS) aboard the European Space Agency’s Environmental Satellite (En-visat) measured nearly continuously mid infrared limb radiance spectra. These mea-surements are utilised to retrieve the global distribution of the chlorofluorocarbon
CFC-5
11 by applying a new fast forward model for Envisat MIPAS and an accompanying optimal estimation retrieval processor. A detailed analysis shows that the total retrieval errors of the individual CFC-11 volume mixing ratios are typically below 10% and that the systematic components are dominating. Contribution of a priori information to the retrieval results are less than 5 to 10%. The vertical resolution of the observations
10
is about 3 to 4 km. The data are successfully validated by comparison with several other space experiments, an air-borne in-situ instrument, measurements from ground-based networks, and independent Envisat MIPAS analyses. The retrieval results from 425 000 Envisat MIPAS limb scans are compiled to provide a new climatological data set of CFC-11. The climatology shows significantly lower CFC-11 abundances in the
15
lower stratosphere compared with the Reference Atmospheres for MIPAS (RAMstan V3.1) climatology. Depending on the atmospheric conditions the differences between the climatologies are up to 30 to 110 ppt (45 to 150%) at 19 to 27 km altitude. Addition-ally, time series of CFC-11 mean abundance and variability for five latitudinal bands are presented. The observed CFC-11 distributions can be explained by the residual
20
mean circulation and large-scale eddy-transports in the upper troposphere and lower stratosphere. The new CFC-11 data set is well suited for further scientific studies.
1 Introduction
Monitoring the global distribution of chlorofluorocarbons like CFC-11 (CFCl3) is
impor-tant for several reasons. First, the chlorine released by photolytic decomposition in the
25
ACPD
8, 4561–4602, 2008 Envisat MIPAS Measurements of CFC-11 L. Hoffmann et al. Title Page Abstract Introduction Conclusions References Tables Figures ◭ ◮ ◭ ◮ Back Close Full Screen / EscPrinter-friendly Version Interactive Discussion
EGU the polar regions (e.g.Solomon,1999). Second, CFCs and most of their replacements
are strong infrared absorbers, and they contribute significantly to the anthropogenic greenhouse effect (e.g.IPCC,2007).
Less vital but more practical reasons to measure CFC-11 global distributions are: Continuous measurements of photochemically long-lived trace gases such as
CFC-5
11 are useful to validate transport in atmospheric models (e.g.Golombek and Prinn, 1986;Kao et al.,1992; Hartley et al., 1996). Further, tracer-tracer relations of long-lived trace gases, e.g. between CFC-11 and N2O, are frequently examined to identify
mixing events (e.g.Plumb et al.,2000;M ¨uller et al.,2001;Morgenstern et al.,2002). Data are also used for studies of age of air (e.g.Waugh et al.,2003).
10
CFC-11 has rather strong and broad spectral infrared emission features and is well suited for space-borne remote sensing observations (e.g.Zander et al.,1996;Bingham et al.,1997;Riese et al.,1999a;Yokota et al.,2002;Coheur et al.,2003;Kuell et al., 2005). Space measurements provide excellent global coverage but are less precise than in-situ measurements. Validation of the space measurements is possible with a
15
large number of ground-based and air-borne measurement techniques (e.g. Notholt, 1994;Elkins et al.,1996;Prinn et al.,2000;Blake et al.,2001).
In this paper we discuss a retrieval of CFC-11 global distributions from measure-ments by the Envisat MIPAS satellite experiment utilising a new forward model and optimal estimation retrieval processor developed in J ¨ulich. The Envisat MIPAS
instru-20
ment is briefly introduced in Sect. 2. Section 3 gives an overview of forward modelling for Envisat MIPAS and provides a detailed discussion of the retrieval process and re-sults. Section 4 summarises multiple validation activities, carried out to ensure high quality of the retrieved CFC-11 data set. Finally, Sect. 5 presents a new CFC-11 cli-matology derived from the Envisat MIPAS measurements as well as a discussion of
25
ACPD
8, 4561–4602, 2008 Envisat MIPAS Measurements of CFC-11 L. Hoffmann et al. Title Page Abstract Introduction Conclusions References Tables Figures ◭ ◮ ◭ ◮ Back Close Full Screen / EscPrinter-friendly Version Interactive Discussion
EGU
2 The Envisat MIPAS experiment
On 1 March 2002 the European Space Agency (ESA) launched the Environmental Satellite (Envisat) (Louet,2001;Dubock et al.,2001) from the space airport at Kourou, French Guyana. The satellite operates at 800 km altitude in a nearly polar, sun-synchronous orbit with 98◦inclination and 100 min period. Global coverage is achieved
5
during 14.4 orbits per day. Ten scientific instruments aboard Envisat monitor the global state of the Earth system and environment.
The Michelson Interferometer for Passive Atmospheric Sounding (MIPAS) (Fischer and Oelhaf,1996; Endemann,1999;Fischer et al., 2007) measures the mid infrared thermal emission of atmospheric constituents arising from the limb. Spectral
measure-10
ments cover the range 685 to 2410 cm−1 in five radiance channels. The unapodised
spectral resolution of the interferometer is about 0.03 cm−1.
The nominal measurement mode of Envisat MIPAS covers 17 tangent heights in the vertical range 6 to 68 km. The nominal vertical sampling step is 3 km from the the troposphere to the mid stratosphere and increases to 5 to 8 km above this. The
instan-15
taneous field of view covers approximately 3×30 arcmin2, corresponding to 3×30 km2 in vertical and horizontal extent at the tangent point, respectively. The measurement time for a single spectrum is about 4 s. A full vertical limb scan takes 75 s. The hori-zontal distance between two profiles is about 500 km. During one day Envisat MIPAS measures about 1100 vertical profiles.
20
Measurements from Envisat MIPAS are processed in different steps. The aim of the ESA operational Level-0 to Level-1B data processing is the conversion of instru-ment raw data to calibrated radiance spectra with corresponding geolocation data. The main steps involved are quality checks of raw data, phase correction and Fourier-transformation of raw interferograms, radiometric calibration, spectral calibration, and
25
evaluation of satellite and instrument attitude data (Lachance,1999;Nett,1999; Klein-ert et al.,2007). Within the ESA Level-2 processing vertical profiles of several atmo-spheric parameters are derived from the radiance measurements (Ridolfi et al.,2000; Carlotti et al.,2001;Carli et al.,2004;Raspollini et al.,2006). Target parameters of the
ACPD
8, 4561–4602, 2008 Envisat MIPAS Measurements of CFC-11 L. Hoffmann et al. Title Page Abstract Introduction Conclusions References Tables Figures ◭ ◮ ◭ ◮ Back Close Full Screen / EscPrinter-friendly Version Interactive Discussion
EGU ESA operational retrievals are pressure, temperature, and volume mixing ratios of six
target species (H2O, O3, HNO3, CH4, N2O, NO2). However, the ESA Level-2
process-ing does not include many minor trace species, e.g. the CFCs, that are covered as well by the radiance measurements.
Envisat MIPAS provides nearly continuous measurement coverage of the period July
5
2002 to March 2004. Due to an unexpected technical problem with the interferometer slides in March 2004, the instrument has to be operated at a reduced spectral reso-lution in a campaign-orientated mode since that time. In this paper we analyse mea-surements obtained during the continuous observation period and restrict ourselves to measurements where consolidated Level-1B and Level-2 data products are available
10
from ESA (processing software version 4.61 and 4.62). Comprehensive pre-flight and permanent in-flight calibrations were carried out to guarantee a high quality Envisat MIPAS Level-1B data product (e.g.Nett et al.,2002;Kleinert et al.,2007;Kiefer et al., 2007). Envisat MIPAS atmospheric data products have been validated by detailed tests of self-consistency as well as by comparison with measurements obtained by
indepen-15
dent in-situ and other remote-sensing experiments (e.g. Piccolo and Dudhia, 2007; Ridolfi et al.,2007).
3 Retrieval of CFC-11 abundance
3.1 Spectral signatures of CFC-11
In the mid infrared CFC-11 radiates in broad bands around 800 to 885 cm−1, 910 to
20
960 cm−1, and 1045 to 1120 cm−1(e.g. McDaniel et al.,1991;Varansi,1991). Several
schemes to identify optimal spectral analysis windows have been proposed, which all aim at minimisation of the retrieval error, or equivalently, the maximisation of the Shannon information content (e.g. Rodgers, 1998; von Clarmann and Echle, 1998; Dudhia et al.,2002). In our case, the Shannon information content under consideration
25
of MIPAS instrument errors (e.g. noise and uncertainties in radiometric calibration) as well as forward model parameter errors (e.g. uncertainties in pressure, temperature, or
ACPD
8, 4561–4602, 2008 Envisat MIPAS Measurements of CFC-11 L. Hoffmann et al. Title Page Abstract Introduction Conclusions References Tables Figures ◭ ◮ ◭ ◮ Back Close Full Screen / EscPrinter-friendly Version Interactive Discussion
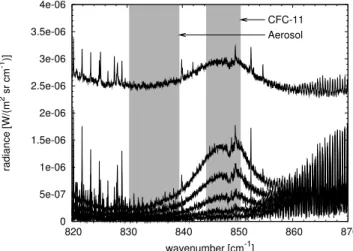
EGU interfering species) was chosen as figure of merit to be optimised. The spectral window
844.275 to 850.575 cm−1 was identified as being best suited for the retrieval of
CFC-11 from the Envisat MIPAS measurements (Fig. 1). The optimisation is carried out for mid-latitude atmospheric conditions, however tests for other climatological conditions (tropics or polar regions) lead to only minor changes in the obtained optimal spectral
5
window.
Based on forward calculations of spectra for multiple atmospheric conditions, further studies were carried out to determine the radiance contributions of minor interfering trace species. For tangent heights in the range 10 to 40 km, the maximum contribu-tions to total mean radiance in the spectral window 844.275 to 850.575 cm−1 due to
10
CFC-11 are up to 93%. Other contributing species are HNO3(up to 55%), O3(43%), background aerosols (36%), CO2 (22%), H2O (8.6%), NO2 (5.7%), CFC-114 (3.1%),
OCS (1.7%), and ClO (1.1%). Any other trace gas contributes less than 1% to total mean radiance in all reference calculations.
The CFC-11 retrieval must be accompanied by a retrieval of radiometric background
15
caused by aerosols, optically thin clouds, or other continuum processes. We identify the spectral window 830.350 to 839.475 cm−1 as being best suited for the retrieval
of total particle extinction. Radiance contributions of the background aerosols are up to 45%, but increase to over 90% if clouds are present. Other important radiance emitters in this spectral window are O3 (69%), CFC-11 (56%), CO2 (26%), ClONO2
20
(12%), HNO3 (7.8%), HCFC-22 (7.2%), NO2 (5.2%), C2H6 (3.5%), ClO (3.1%), OCS
(1.4%), CFC-114 (1.4%), H2O (1.4%), NH3(1.3%).
Since rather wide spectral windows are selected for the retrieval, high signal-to-noise ratios for the spectral mean radiances are obtained. In the 10 to 40 km altitude range the signal-to-noise ratio varies between 2.1 and 650 for the CFC-11 spectral window
25
and between 3.1 and 190 for the aerosol spectral window. At least at lower altitudes the CFC-11 retrievals are more strongly influenced by systematic errors than by noise.
ACPD
8, 4561–4602, 2008 Envisat MIPAS Measurements of CFC-11 L. Hoffmann et al. Title Page Abstract Introduction Conclusions References Tables Figures ◭ ◮ ◭ ◮ Back Close Full Screen / EscPrinter-friendly Version Interactive Discussion
EGU 3.2 Forward modelling
To allow for a complete analysis of all radiance measurements made by Envisat MI-PAS and the subsequent comprehensive compilation of CFC-11 climatological data we utilise a new fast radiative transfer forward model. The Juelich Rapid Spectral Simu-lation Code (JURASSIC) (Hoffmann,2006) computes the radiative transfer based on
5
the band transmittance approximation, the continuum approximation, and the emissiv-ity growth approximation (Weinreb and Neuendorffer,1973;Gordley and Russel,1981; Marshall et al.,1994;Francis et al.,2006).
A major reduction of CPU-time is achieved in JURASSIC, because the radiative transfer is not computed based on the general monochromatic approach, but by
op-10
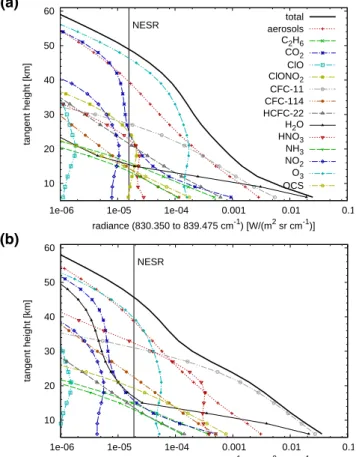
erating on spectral mean values of emissivity, Planck function, and radiance instead. Spectral mean emissivities are obtained by interpolation from pre-computed look-up-tables. The emissivity look-up-tables are derived from exact line-by-line calculations, utilising the MIPAS Reference Forward Model (RFM) (Dudhia,2004). As an example, Fig. 2 shows the results of a typical JURASSIC forward calculation for mid-latitude
15
atmospheric conditions.
For the spectral windows used in the CFC-11 retrieval, the difference in CPU time required on a conventional workstation by JURASSIC and the RFM is about three orders of magnitude. However, the approximations lead to a small loss of accuracy, which is quantified by comparisons with exact line-by-line calculations. For the spectral
20
windows utilised here, the deviations are well below 0.5% (Fig. 3) and are rather small compared to other uncertainties, e.g. spectroscopic data. Model errors above one percent were found only in the tropical mid troposphere, where the CFC-11 band gets optically thick.
3.3 Data pre-processing
25
Important steps in data pre-processing are apodization and spectral averaging of the Envisat MIPAS radiance spectra. For apodization the “strong function” ofNorton and Beer (1976,1977) is applied. The apodized instrument lineshapes for the individual
ACPD
8, 4561–4602, 2008 Envisat MIPAS Measurements of CFC-11 L. Hoffmann et al. Title Page Abstract Introduction Conclusions References Tables Figures ◭ ◮ ◭ ◮ Back Close Full Screen / EscPrinter-friendly Version Interactive Discussion
EGU spectral grid points are required to derive exact radiometric filter functions for the
for-ward model. Apodization is necessary to remove side-lobe effects at the boundaries of the radiometric filter functions.
Another important step in the pre-processing is cloud filtering. Spectra contain-ing cloud emission (e.g. Fig. 1, lowermost tangent height) cannot be simulated with
5
JURASSIC because scattering is neglected in the current version of the model. The cloud filtering algorithm ofSpang et al.(2004) is based on the analysis of the so-called cloud index (CI), which is defined as the ratio of mean radiances in the spectral
win-dows 788.2 to 796.25 cm−1 and 832.3 to 834.4 cm−1. The long wavelength region is
dominated by CO2 emission. The short wavelength region is part of an atmospheric
10
window and is strongly influenced by aerosols or cloud particle emissions. In the pres-ence of optically thin or thick clouds theCI quickly drops below certain thresholds. In
the ESA operational retrievals a threshold ofCI<1.8 is used for cloud-filtering. We
ap-ply a more strict cloud filtering criterion to remove even optically thin clouds by using a threshold ofCI<4.0 (e.g.Glatthor et al.,2006).
15
3.4 Optimal estimation retrieval
Retrieval is based on the standard optimal estimation approach (Rodgers,1976,1990, 2000). The “optimal estimate” of the atmospheric state (i.e. the maximum a posteriori solution of the inverse problem) is found by minimising the deviations between forward model simulations based on the current estimate of the state and the actual radiance
20
measurements, as well as minimising the deviations between the estimate and the a priori state. Deviations are normalised by the measurement error covariance and the a priori covariance, respectively. Since the retrieval problem is moderately non-linear, a line-search approach based on the Gauss-Newton method is used to find the minimum of the cost function iteratively. A multi-target approach is applied, i.e. all
25
retrieval targets (CFC-11 volume mixing ratios and aerosol extinction coefficients) are derived simultaneously and correlations between the different quantities are fully taken into account in the retrieval covariance. The individual Envisat MIPAS tangent heights
ACPD
8, 4561–4602, 2008 Envisat MIPAS Measurements of CFC-11 L. Hoffmann et al. Title Page Abstract Introduction Conclusions References Tables Figures ◭ ◮ ◭ ◮ Back Close Full Screen / EscPrinter-friendly Version Interactive Discussion
EGU are used to define the retrieval grid.
The inverse problem is regularised by means of explicit a priori data. A first-order autoregressive model (e.g.Rodgers,2000) is used to initialise the a priori covariances of the different quantities and the measurement error covariance, i.e. to describe the spatial and spectral correlations of the a priori data and error data. In this model
corre-5
lations decay exponentially depending on the distance of the spectral windows selected for the retrieval and the vertical distance of the tangent heights or atmospheric layers of the individual limb scan, respectively. Except for noise, most correlation lengths are not well-known from experimental side and had to be estimated. The values actually used are reported below. The vertical correlation lengths of the a priori data are very
10
important, because they contribute to the smoothing characteristics of the constraint. We discuss this effect in more detail in Sect. 3.7. When determining the measure-ment error covariance we do not only consider noise but also include the non-random components (e.g.von Clarmann et al., 2001). Hence, the retrieval results and error analyses are significantly influenced by the spatial and spectral correlations of e.g.
un-15
certainties in radiometric calibration or uncertainties in model parameters like pressure and temperature.
The a priori atmospheric state for the retrieval is prepared by mixing results from the ESA operational retrievals as far as available (see Sect. 2) and data from a climatol-ogy prepared for the Envisat MIPAS analysis (Remedios et al.,2007). The RAMstan
20
climatology (Reference Atmospheres for MIPAS, standard atmospheres, version 3.1) was compiled from observations of several experiments aboard the Upper Atmosphere Research Satellite as well as tropospheric and stratospheric chemical transport model output. Climatological data are provided for five different atmospheric conditions (trop-ics, mid-latitude day or night, polar summer, and polar winter). Mean volume mixing
25
ratios and one sigma variability are reported for more than 30 trace gases. Tropo-spheric profiles for the source gases are updated to year 2000 estimates where pos-sible. CFC-11 data in the climatology are derived from measurements of the satellite experiment CLAES (Cryogenic Limb Array Etalon Spectrometer) (Roche et al.,1998).
ACPD
8, 4561–4602, 2008 Envisat MIPAS Measurements of CFC-11 L. Hoffmann et al. Title Page Abstract Introduction Conclusions References Tables Figures ◭ ◮ ◭ ◮ Back Close Full Screen / EscPrinter-friendly Version Interactive Discussion
EGU The CFC-11 tropospheric volume mixing ratio is set to 265 ppt globally. Climatological
data for aerosol extinction coefficients were obtained from 5.26 micron measurements of the Halogen Occultation Experiment (HALOE) (e.g. Hervig et al., 1996). HALOE measurements during the year 2003 were globally averaged to derive an a priori pro-file. Spectral correction factors for the aerosol extinction are obtained from a Mie-model
5
study.
3.5 Error analysis
The error analysis for the retrieval results is based on the concept of linearisation of the transfer function (Rodgers,1990,2000). The total retrieval error is composed of (1) direct radiance measurement errors, (2) forward model parameters errors, (3) forward
10
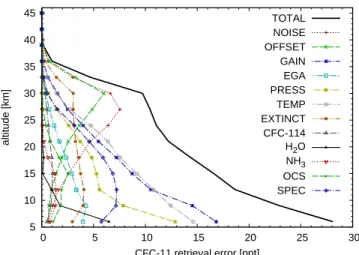
model errors, and (4) smoothing effects due to a priori data. Applying the transfer function concept, detailed error budgets for the CFC-11 retrievals can be estimated. The total retrieval error of the individual CFC-11 volume mixing ratios, including all statistical and systematic components, is typically below 10% and about 6 to 7% at best (Table 1, Fig. 4). We will now discuss the individual components of the error
15
budget in more detail.
(1) Direct radiance measurement errors: Noise as well as uncertainties in offset cal-ibration and gain calcal-ibration are considered in the error analysis and are all found to make a significant contribution to the budget. The noise equivalent spectral radiance for unapodised spectra is about 30 nW/(cm2sr cm−1) around 830 to 850 cm−1 (
Klein-20
ert et al.,2007). To determine the noise equivalent radiance for the spectral windows selected for the retrieval, a scaling factor 1/√n is applied, where n is the number of
grid points within the spectral window. The noise values estimated for the spectral mean radiances are assumed to be uncorrelated between the different spectral win-dows and different tangent heights. Offset and gain calibration uncertainty were set
25
to 2 nW/(cm2sr cm−1) and 2%, respectively (Nett et al., 2002; Kleinert et al., 2007).
For the uncertainties in radiometric calibration the spectral correlation length is set to 10 cm−1 and the vertical correlation length is set to 10 km.
ACPD
8, 4561–4602, 2008 Envisat MIPAS Measurements of CFC-11 L. Hoffmann et al. Title Page Abstract Introduction Conclusions References Tables Figures ◭ ◮ ◭ ◮ Back Close Full Screen / EscPrinter-friendly Version Interactive Discussion
EGU Other instrumental errors: Spectral instability and shifts as well as uncertainties in
the instrument line shape can be neglected considering the wide spectral windows used for the retrieval. These instrumental errors do not significantly alter the spec-tral mean radiances. Line-of-sight pointing errors are also not considered, as Level-2 tangent heights are a derived data product, i.e. determined from the retrieved pressure
5
and temperature profiles based on the assumption of hydrostatic equilibrium. However, the CFC-11 retrieval error due to uncertainties in pressure and temperature data will be estimated separately. Since the Level-2 tangent heights also depend on the lowermost tangent altitude provided by the Envisat MIPAS attitude data system (i.e. the Level-1B tangent heights) which show rather large daily drifts (of the order of 1 to 2 km/day), we
10
generally do not use the Level-2 tangent altitudes for further analysis and work with log-pressure altitudes instead. Seevon Clarmann et al.(2003a) orKiefer et al.(2007) for a detailed discussion.
(2) Forward model parameter errors and (3) forward model errors: The leading re-trieval errors are due to uncertainties in pressure and temperature (set to 3% and
15
2 K, respectively, 5 km vertical correlation length, seeRaspollini et al., 2006; Piccolo and Dudhia,2007), CFC-11 spectroscopic data (set to 3%, 10 km vertical correlation length, seeRothman et al., 2003), and spectral shape of the aerosol extinction data (set to 20%, 10 km vertical correlation length, based on a Mie-model study). Retrieval errors caused by uncertainties in minor interfering trace species as well as CFC-11 and
20
aerosol extinction top column data are small or negligible. Forward model errors are mainly due to the approximations used to accelerate the radiative transfer calculations. The retrieval errors due to the forward model errors (set to 0.5%, 3 km vertical correla-tion length, 10 cm−1 spectral correlation length, see Sect.3.2) are small compared to
other terms.
25
(4) Smoothing error: The one sigma uncertainties of the CFC-11 climatological data (Remedios et al., 2007) are multiplied by a factor 3 for the retrieval. This approach significantly increases the contribution of measurement information to the retrieval re-sults, but as the a priori uncertainties no longer match the real ensemble, an estimate
ACPD
8, 4561–4602, 2008 Envisat MIPAS Measurements of CFC-11 L. Hoffmann et al. Title Page Abstract Introduction Conclusions References Tables Figures ◭ ◮ ◭ ◮ Back Close Full Screen / EscPrinter-friendly Version Interactive Discussion
EGU of the smoothing error will be incorrect (Rodgers, 2000). Hence, we do not include
the smoothing error in the budget. The influence of a priori information on the retrieval results will be discussed in more detail in the following sections.
3.6 Contribution of a priori information
The most important diagnostic quantities for characterising the contributions of
mea-5
surement information versus a priori information to the retrieval results are the averag-ing kernel matrices derived within the retrieval process. Integrataverag-ing over the averagaverag-ing kernels, i.e. the rows of the averaging kernel matrices, gives an approximate estimate of the amount of measurement information in the retrieval result. Subtracting the area from one gives the amount of a priori information. It is important to realize that this
ap-10
proximation is only valid for small retrieval errors. For the CFC-11 retrieval, the contri-bution of a priori information is found to be less than 5 to 10% when CFC-11 is present in significant concentrations (Fig. 5a). Even if the retrieval result at an atmospheric height level is mainly determined by measurement information, this information must not necessarily originate from the observations at the corresponding tangent height
15
alone, but may also come from adjacent tangent altitudes. This would cause a smooth-ing effect of the a priori on the retrieved profile. Hence, the vertical resolution of the retrieval needs to be analysed in more detail.
3.7 Vertical resolution
An ideal retrieval would exactly reproduce the unknown true atmospheric state. In
20
reality, the retrieval produces a smoothed version of the true trace gas profiles. The averaging kernels take the form of broad maxima rather than delta distributions. Hence, the averaging kernels also describe the resolution of the observations. We applied the concept of information density of Purser and Huang (1993) to estimate the vertical resolution of the CFC-11 retrieval. While the trace of the averaging kernel matrix (i.e.
25
the sum of the diagonal elements) measures the degrees of freedom for signal for the whole profile, the individual diagonal elements measure the degrees of freedom per
ACPD
8, 4561–4602, 2008 Envisat MIPAS Measurements of CFC-11 L. Hoffmann et al. Title Page Abstract Introduction Conclusions References Tables Figures ◭ ◮ ◭ ◮ Back Close Full Screen / EscPrinter-friendly Version Interactive Discussion
EGU retrieval grid level. Hence, the reciprocal values of the diagonal elements measure
the number of retrieval grid levels per degree of freedom, or the “resolution” of the observations. The reciprocal values have to be multiplied by the retrieval grid spacing (in [km]), to get the correct unit. The vertical resolution of the retrieved CFC-11 profiles is about 3 to 4 km and corresponds to the sampling step of the limb scans and the field
5
of view of the Envisat MIPAS instrument (Fig. 5b).
4 Validation of the CFC-11 measurements
4.1 Internal quality measures
For the purpose of internal data validation the consistency of the retrieval results with the radiance measurements and the a priori data is checked by applying a standard
10
χ2-test to the final value of the cost function for each limb scan (e.g.Rodgers,2000). Once the retrieval converged to a solution, the cost function measures the differences between the actual radiance measurements and the forward model simulations based on the optimal estimate of the state, as well as the differences between the optimal estimate and the a priori state. The differences are normalised by the measurement
15
error covariance and the a priori covariance, respectively. In addition, for theχ2-test the cost function values are also normalised by the numberm of radiance measurements
of the limb scan, sincem is the number of degrees of freedom.
A normalised χ2/m around one indicates that the retrieval results are consistent,
at least in a statistical sense or for an ensemble of profiles. The χ2-test allows us
20
to identify individual limb scans with abnormally poor fits which are probably not part of the ensemble. In this case the retrieval results and corresponding forward model simulations are either inconsistent with the radiance measurements (with respect to the measurement errors) or inconsistent with the a priori data (with respect to the a priori uncertainty). Since the latter may happen in case of an unusual atmospheric
25
event, the corresponding retrievals are not necessarily “bad” and need to be analysed carefully. However, to prepare the CFC-11 data for subsequent scientific studies, we
ACPD
8, 4561–4602, 2008 Envisat MIPAS Measurements of CFC-11 L. Hoffmann et al. Title Page Abstract Introduction Conclusions References Tables Figures ◭ ◮ ◭ ◮ Back Close Full Screen / EscPrinter-friendly Version Interactive Discussion
EGU decided to use a weak filtering criterion and remove the few extreme outliers. The
individual retrievals are accepted as successful if theχ2-test indicates significance at the 0.1% confidence level.
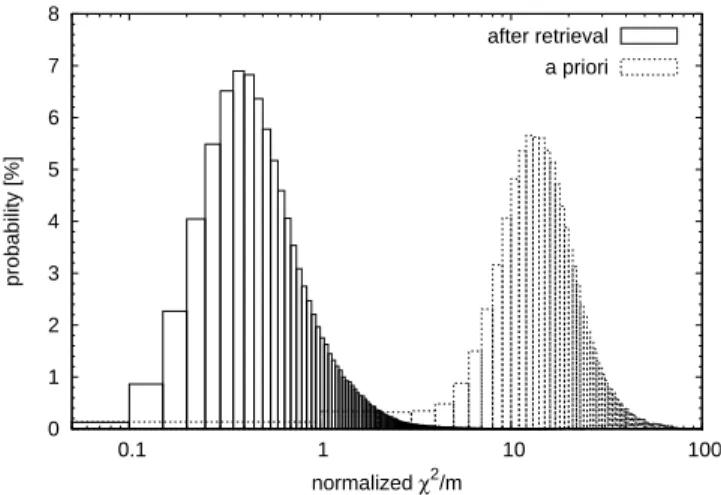
It is also interesting to study theχ2/m-distribution for a large ensemble of limb scans.
A plot of the final χ2/m-distribution covering all 425 000 limb scans of this study is
5
shown in Fig. 6. For comparison the normalisedχ2/m-distribution for the initial guess,
i.e. the a priori state in our setup, is shown, too. The finalχ2/m-distribution clearly
indi-cates that the majority of retrieval results is consistent. On average only 2.6 iterations are required until the individual retrievals converge. Subtracting one iteration required to detect convergence, this indicates that the particular retrieval problem indeed is a
10
moderately non-linear one.
4.2 Comparison with other MIPAS retrievals
The CFC-11 data retrieved with the scheme described in this paper were compared with independent Envisat MIPAS retrievals carried out at the University of Leicester, United Kingdom and the Institut f ¨ur Meteorologie und Klimaforschung (IMK) at the
re-15
search centre in Karlsruhe, Germany. These comparisons cannot reveal direct mea-surement errors of the Envisat MIPAS instrument, but would indicate possible errors in our new forward model and the accompanying retrieval scheme.
4.2.1 Comparison with radiometric retrievals
MIPAS retrievals at the University of Leicester are based on the optimal estimation
ap-20
proach. Similar to the approach presented in this paper, spectral mean radiances rather than detailed spectra are analysed in the Leicester OPERA scheme (Optimal Estima-tion Retrieval Algorithm) (Moore et al.,2006;Moore and Remedios,2007). The MIPAS Reference Forward Model (RFM) is utilised as the forward model. Since the RFM line-by-line calculations are exact, but time-consuming, the analyses in Leicester are limited
25
to a subset of all available Envisat MIPAS measurements. Comparison between our results here and OPERA results is instructive because it tests the applicability of the
ACPD
8, 4561–4602, 2008 Envisat MIPAS Measurements of CFC-11 L. Hoffmann et al. Title Page Abstract Introduction Conclusions References Tables Figures ◭ ◮ ◭ ◮ Back Close Full Screen / EscPrinter-friendly Version Interactive Discussion
EGU fast forward model versus full line-by-line radiative transfer, as well as providing a first
verification of algorithm correctness. There are only minor differences in the retrieval setups, concerning the choice of spectral windows (842.650 to 845.475 cm−1for
CFC-11 in the OPERA scheme) or the initialisation of measurement error covariance and a priori covariance (diagonal matrices in the OPERA scheme, first-order autoregressive
5
model in this study). The OPERA scheme produces retrieval results forCI<1.8,
how-ever since the comparison here is for individual matched profiles, in effect the compar-ison is performed for theCI<4.0 threshold. A direct comparison of individual retrieved
scans reveals good agreement (i.e. better than 2 to 3%) between our result and the OPERA results as expected from the common retrieval approaches.
10
4.2.2 Comparison with line-by-line retrievals
The IMK retrievals are based on a regularised global fit approach and the use of the line-by-line radiative transfer model KOPRA (Karlsruhe Optimized and Precise Radia-tive Transfer Algorithm) (Stiller,2000;Stiller et al.,2002). Since this approach is rather time consuming, KOPRA has mostly been used for the retrieval of short rather than
15
extended time periods (currently, CFC-11 data are retrieved from about 15% of all En-visat MIPAS scans). The KOPRA forward model is well validated by cross-comparisons with the RFM as well as several other radiative transfer models (von Clarmann et al., 2003b). A brief description of the IMK CFC-11 retrieval is given byvon Clarmann et al. (2007).
20
Figure 7a shows a global comparison between our CFC-11 retrieval results and the IMK data (version V3O F-11 8) for several days. The comparison reveals small system-atic differences of about −6 to 6 ppt (−1.8 to 3.5% below 25 km). Statistical deviations are in the range of 8 to 24 ppt (7 to 10%). One reason for differences in CFC-11 data are the different temperature data sets used. A comparison of ESA operationally
re-25
trieved temperature data, used as a priori data in our analysis, and the IMK retrieved temperatures reveals systematic differences of −0.6 to 0.5 K and statistical differences of 1.1 to 1.8 K for the selected days (Fig. 7b). Based on the error estimate shown in
ACPD
8, 4561–4602, 2008 Envisat MIPAS Measurements of CFC-11 L. Hoffmann et al. Title Page Abstract Introduction Conclusions References Tables Figures ◭ ◮ ◭ ◮ Back Close Full Screen / EscPrinter-friendly Version Interactive Discussion
EGU Fig. 4 such temperature differences map correspondingly onto the retrieval results.
A direct comparison indicates good to perfect agreement for many CFC-11 profiles. However, some profiles show large differences. Next to temperature data, possible reasons to explain these differences are uncertainties in pressure data or tangent al-titudes, different a priori datasets of interfering species (ESA operational data versus
5
IMK data), as well as different approaches for the retrieval of radiometric background as caused by aerosols and for the regularisation of the retrieval problem. These aspects have to be addressed in future work, but are out of the scope of this paper. However, the mean differences with the IMK data of 3.5% or less (systematic component) and 10% or less (statistical component) are already encouraging.
10
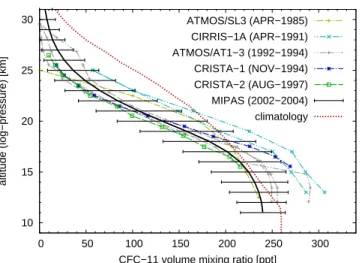
4.3 Comparison with other satellite experiments
Figure 8 shows a comparison between mean CFC-11 vertical profiles from different space experiments and corresponding Envisat MIPAS data. Comparisons are car-ried out with measurements from ATMOS (Atmospheric Trace Molecule Spectroscopy) (Zander et al.,1992,http://remus.jpl.nasa.gov/atmos), CIRRIS-1A (Cryogenic Infrared
15
Radiance Instrumentation for Shuttle) (Bingham et al.,1997) and CRISTA (Cryogenic Infrared Spectrometers and Telescopes for the Atmosphere) (Offermann et al.,1999; Riese et al., 1999b; Grossmann et al., 2002). Trends are corrected for in this com-parison by mapping all profiles to the middle of the year 2003, i.e. the mid point of the MIPAS measurement period. Profiles are mapped considering global tropospheric
20
trend data derived from ground-based network measurements (Blake,2005) and age of air data (Waugh and Hall,2002). Generally, good agreement is found between the results of the different experiments. The shape of the mean profiles is nearly identical in all cases. Small offsets may be explained by systematic measurement errors, data sampling issues, or remaining uncertainties in trend correction.
25
The individual CFC-11 measurements of ATMOS have a high accuracy and preci-sion, i.e. uncertainties are below 5% (Gunson et al., 1996). However, we see more variability in the mean profiles. This is due to the limited number of measurements and
ACPD
8, 4561–4602, 2008 Envisat MIPAS Measurements of CFC-11 L. Hoffmann et al. Title Page Abstract Introduction Conclusions References Tables Figures ◭ ◮ ◭ ◮ Back Close Full Screen / EscPrinter-friendly Version Interactive Discussion
EGU the irregular latitudinal and temporal distribution of the solar occultation measurements.
The CRISTA-1 measurements (November 1994) show a steeper gradient than the MI-PAS measurements in the lower stratosphere. However, the corresponding retrievals are influenced by a high aerosol radiance background below 20 km, caused by the eruption of the volcano Pinatubo in June 1991 (P. Preusse, personal communication,
5
Spang et al.,2002). The CRISTA-2 profile (measurements in July 1997) corresponds better with the remaining measurements and shows a nearly identical stratospheric gradient to that seen in the MIPAS data. The climatological data fromRemedios et al. (2007) shown in Fig. 8 deviate significantly from all other measurements (i.e. about 2 to 3 climatological standard deviations). The climatological data are based on
measure-10
ments from the satellite experiment CLAES (Cryogenic Limb Array Etalon Spectrom-eter) (Roche et al., 1998). These measurements, obtained during the years 1991 to 1993 are likely to be even more influenced by the Pinatubo aerosols than the CRISTA-1 measurements. A similar Pinatubo effect for CFC-CRISTA-12 has been shown byRemedios et al. (2007). However, the direct comparison shows that the Envisat MIPAS retrieval
15
results are not or only slightly influenced by the deficits of the climatology, which is used as a priori in our retrieval setup.
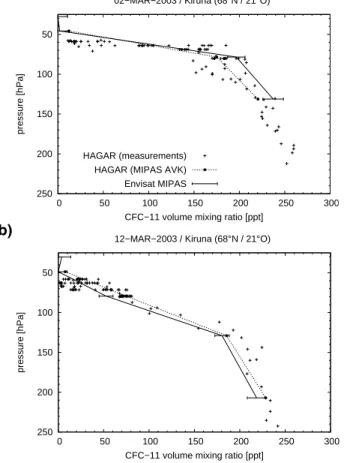
4.4 Comparison with air-borne in-situ measurements
The retrieved MIPAS CFC-11 data were compared with measurements from the High Altitude Gas Analyzer (HAGAR) (Riediger et al., 2000) aboard the high-altitude
re-20
search aircraft M-55 Geophysica. HAGAR measures trace gas concentrations with a gas chromatograph. The HAGAR measurements shown in Fig. 9 were obtained during a validation campaign for Envisat MIPAS in March 2003 near Kiruna, Sweden (68◦N, 21◦E) (Baehr et al.,2004). The scatter of individual measurements is due to
atmospheric variability rather than instrument noise or other errors. The uncertainty
25
of the individual HAGAR measurements is about 1%. During the validation campaign the flight track of the Geophysica aircraft was oriented such that the in-situ aircraft instruments sampled the same air volume as Envisat MIPAS, i.e. time and
miss-ACPD
8, 4561–4602, 2008 Envisat MIPAS Measurements of CFC-11 L. Hoffmann et al. Title Page Abstract Introduction Conclusions References Tables Figures ◭ ◮ ◭ ◮ Back Close Full Screen / EscPrinter-friendly Version Interactive Discussion
EGU distance are minimised. The direct comparison of the HAGAR and MIPAS
measure-ments shows good agreement of the CFC-11 data. Differences are below 5 to 10% for the two flights.
4.5 Comparison with ground-based measurements
The tropospheric concentrations of CFC-11 are monitored by several networks of
5
ground-based measurement stations. During the year 2003 the global mean tropo-spheric volume mixing ratio of CFC-11 was in between 254.9 to 257.3 ppt and the growth rate was in between −1.0 to −0.7 %/year (WMO,2007). The mid-latitude tro-pospheric volume mixing ratio derived from the Envisat MIPAS measurements is about 15 to 17 ppt (6%) lower than the global mean from the ground based measurements.
10
However, this difference remains within the estimated systematic errors of the Envisat MIPAS measurements (compare Fig. 4). The tropospheric mean value for tropical latitudes is in very good agreement with the ground-based measurements, i. e. the difference is only about 6 to 8 ppt (3%). For the polar regions comparisons are not possible since the polar troposphere is not regularly covered by our analysis.
15
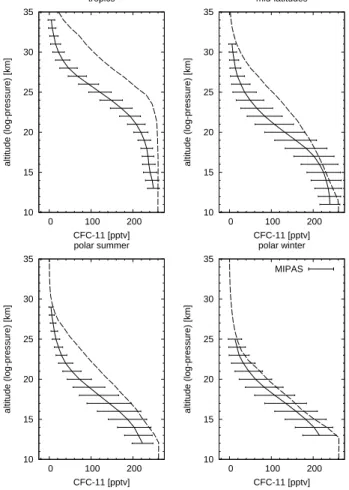
5 Compilation of CFC-11 climatological data
5.1 Latitudinal distribution
We compiled the CFC-11 data retrieved from the Envisat MIPAS measurements during the period July 2002 to March 2004 to provide an update for the climatology of Reme-dios et al. (2007). Hence, the individual measurements were sorted into four groups.
20
The “tropical latitudes” include all measurements in the latitude range 20◦S to 20◦N.
The “mid-latitudes” cover all measurements in the latitude ranges 20◦N to 65◦N and
65◦S to 20◦S. The “polar summer” and “polar winter” groups cover all measurements
north of 65◦N or south of 65◦S during the months January to March and October to
December or April to September, respectively. For each case we report the CFC-11
25
ACPD
8, 4561–4602, 2008 Envisat MIPAS Measurements of CFC-11 L. Hoffmann et al. Title Page Abstract Introduction Conclusions References Tables Figures ◭ ◮ ◭ ◮ Back Close Full Screen / EscPrinter-friendly Version Interactive Discussion
EGU grid (Table 2, Fig. 10). We only report the data if statistics are based on at least 25 000
individual measurements.
Individual CFC-11 volume mixing ratios are not taken into account in this analysis if they contain more than 10% a priori information. The contribution of a priori information to the retrieval results are derived from the averaging kernel data (see Sect.3.6). The
5
filtering removes all observations where the volume mixing ratios drop below ≈5 ppt. In this case the radiance signal is low compared to the measurement errors and does not provide sufficient information for the retrieval. Filtering also removes all altitudes where the MIPAS line-of-sight was obscurred by clouds and the retrieval result corresponds to the a priori data. Selecting a strict threshold of 10% for the maximum amount of a
10
priori information ensures that the bias in the averaged profiles due to neglected trends in the a priori data is less than 0.5 to 1% (Hoffmann et al.,2005).
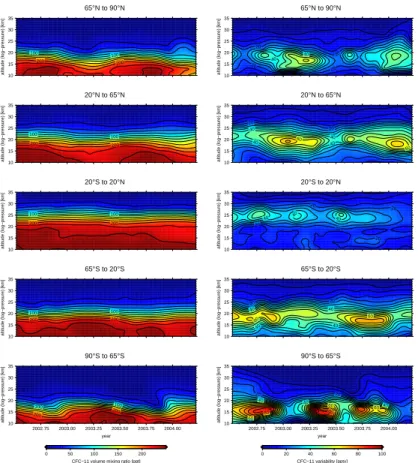
5.2 Seasonal variability
The time series of CFC-11 mean volume mixing ratio and corresponding variability shown in Fig. 11 illustrate in more detail the atmospheric variability captured in the 21
15
months of nearly continuous Envisat MIPAS measurements. CFC-11 is upwelling from the troposphere into the stratosphere mainly at tropical latitudes. Accordingly, the time series for tropical latitudes shows the highest average concentrations. In the strato-sphere tropical air masses are driven to higher latitudes by the residual mean circula-tion and large-scale eddy transport. However, CFC-11 is destroyed by photolytical
de-20
composition and concentrations decrease with increasing altitudes. At polar latitudes the CFC-11 abundances decrease especially in the winter months due to subsidence of air masses in the polar vortex. This effect is more pronounced in the southern polar winter hemisphere due to the more stable polar vortex. The rather rapid increase in mean CFC-11 abundance at south polar latitudes in late spring (November/December
25
2003 and November/December 2004) indicates very strong mixing of mid-latitude and polar air masses when the polar vortex breaks down.
ACPD
8, 4561–4602, 2008 Envisat MIPAS Measurements of CFC-11 L. Hoffmann et al. Title Page Abstract Introduction Conclusions References Tables Figures ◭ ◮ ◭ ◮ Back Close Full Screen / EscPrinter-friendly Version Interactive Discussion
EGU maximum monthly variability of 40 to 50 ppt was seen around 25 km altitude. The
vari-ability increases towards mid and polar latitudes due to increased mixing of CFC-11 rich tropical air masses and CFC-11 poor polar air masses by planetary wave activity. The CFC-11 variability reaches up to 60 to 70 ppt around 15 to 20 km altitude. The highest variabilities are found in the winter months, i.e. during November to April in the
5
Northern Hemisphere and August to December in the Southern Hemisphere. A hemi-spheric difference in variability can be observed at polar latitudes. A maximum CFC-11 variability up to 90 to 100 ppt is found at south polar latitudes, which is about twice the variability of the north polar latitudes. This enhanced variability is most likely due to the more stable vortex in the Southern Hemisphere and much stronger gradients of
CFC-10
11 across the vortex boundary. The enhanced variability in the Southern Hemisphere is mainly due to the activity of the planetary wave-1, i.e. the vortex is shifted away from the pole and crosses the 65◦S latitude boundary used to define the south polar region.
Reports on CFC-11 variance are rather rare and comparisons are often difficult. However, in a comparison of Envisat MIPAS CFC-11 variability for August 2003 and
15
measurements of the CRISTA-2 satellite experiment in August 1997 we found excel-lent agreement (Kuell et al.,2004;Hoffmann,2006). This gives confidence that both satellite experiments are capable of capturing the atmospheric variability on synoptic and planetary scales. However, the Envisat MIPAS time series presented here pro-vide additional information about the seasonal dependence over a period of nearly two
20
years.
6 Conclusions
Envisat MIPAS radiance measurements are well-suited to retrieving the global distri-bution of CFC-11 in the upper troposphere and lower stratosphere. Utilizing a newly developed rapid radiative transfer model and an accompanying optimal estimation
re-25
trieval processor we analyzed more than 425 000 Envisat MIPAS limb scans measured in the time period from July 2002 to March 2004. The total error of the retrieved CFC-11
ACPD
8, 4561–4602, 2008 Envisat MIPAS Measurements of CFC-11 L. Hoffmann et al. Title Page Abstract Introduction Conclusions References Tables Figures ◭ ◮ ◭ ◮ Back Close Full Screen / EscPrinter-friendly Version Interactive Discussion
EGU volume mixing ratios is typically below 10% in our retrieval scheme. The retrieval error
is dominated by noise and offset calibration errors at upper altitudes and uncertainties of temperature data and gain calibration data at lower altitudes. Retrieval errors due to the use of the rapid approximative forward model are rather small. Retrieval results typically contain less than 5 to 10% a priori information. The vertical resolution of the
5
observations is about 3 to 4 km. Several validation activities, i.e. internal quality mea-sures, comparison with other satellite measurements, an air-borne in-situ instrument, and ground-based measurements, suggest that the retrieved CFC-11 data are reliable. We compiled all retrieved data to provide a new climatology of CFC-11 for four climatological cases (tropical latitudes, mid-latitudes, polar summer and
po-10
lar winter). The new climatology shows significantly lower CFC-11 abundances in the lower stratosphere compared with data provided in the RAMstan V3.1 cli-matology. The observed differences are up to 45 to 150% at 19 to 27 km altitude. The new climatological data set will be provided as an electronic supplement to this paper (http://www.atmos-chem-phys-discuss.net/8/4561/2008/
15
acpd-8-4561-2008-supplement.zip). Time series of CFC-11 mean abundance and variability for five latitude bands were derived from the measurements and can be ex-plained by the residual mean circulation and large-scale eddy-transports in the upper troposphere and lower stratosphere. CFC-11 variability is strongly influenced by the planetary wave activity near the boundary of the polar vortex. The new CFC-11 data
20
set has a great potential for model validation and case studies of transport and mixing processes in the upper troposphere and lower stratosphere on synoptic or planetary scales and up to the inter-seasonal time scale. It is well suited for further scientific studies.
Acknowledgements. Envisat MIPAS data was provided by the European Space Agency (Cat-1
25
project 2515). We thank A. Dudhia, University of Oxford, United Kingdom, for providing the MIPAS Reference Forward Model. We thank A. Grimsdell, NWRA/CoRA, Boulder, CO, United States, for comments on the manuscript.
ACPD
8, 4561–4602, 2008 Envisat MIPAS Measurements of CFC-11 L. Hoffmann et al. Title Page Abstract Introduction Conclusions References Tables Figures ◭ ◮ ◭ ◮ Back Close Full Screen / EscPrinter-friendly Version Interactive Discussion
EGU
References
Baehr, J., Volk, C. M., Ivanova, E., Werner, A., Wetter, T., Engel, A., Haase, H.-P., M ¨obius, T., Schmidt, U., Stiller, G., von Clarmann, T., Glatthor, N., Kellmann, S., Grunow, K., and Levin,
I.: Validation of MIPAS-Envisat CH4, N2O, CFC-11 and CFC-12 by airborne in situ
obser-vations, in: Proceedings of the 2004 Envisat & ERS Symposium, ESA SP-572, Salzburg, 5
Austria, 2004. 4577
Bingham, G. E., Zhou, D. K., Bartschi, B. Y., Anderson, G. P., Smith, D. R., Chetwynd, J. H., and Nadile, R. M.: Cryogenic Infrared Radiance Instrumentation for Shuttle (CIRRIS 1A) Earth
limb spectral measurements, calibration, and atmospheric O3, HNO3, CFC-12, and CFC-11
profile retrieval, J. Geophys. Res., 102, 3547–3558, 1997. 4563,4576
10
Blake, D.: Methane, Nonmethane Hydrocarbons, Alkyl Nitrates, and Chlorinated Carbon Com-pounds including 3 Chlorofluorocarbons (CFC-11, CFC-12, and CFC-113) in Whole-air Sam-ples, in: Trends: A Compendium of Data on Global Change, Tech. rep., Carbon Dioxide In-formation Analysis Center, Oak Ridge National Laboratory, U.S. Department of Energy, Oak
Ridge, Tenn., USA, 2005. 4576
15
Blake, N. J., Blake, D. R., Simpson, I. J., Lopez, J. P., Johnston, N. A. C., Swanson, A. L., Katzenstein, A. S., Meinardi, S., Sieve, B. C., Colman, J. J., Atlas, E., Flocke, F., Vay, S. A., Avery, M. A., and Rowland, F. S.: Large-scale latiduinal and vertical distributions of NMHCs and selected halocarbons in the troposphere over the Pacific Ocean during the March-April 1999 Pacific Exploratory Mission (PEM-Tropics B), J. Geophys. Res., 106, 32 627–32 644, 20
2001. 4563
Carli, B., Alpaslan, D., Carlotti, M., Castelli, E., Ceccherini, S., Dinelli, B. M., Dudhia, A., Flaud, J. M., H ¨opfner, M., Jay, V., Magnani, L., Oelhaf, H., Payne, V., Piccolo, C., Prosperi, M., Raspollini, P., Remedios, J., Ridolfi, M., and Spang, R.: First results of MIPAS/ENVISAT with
operational Level 2 code, Adv. Space Res., 33, 1012–1019, 2004.4564
25
Carlotti, M., H ¨opfner, M., Raspollini, P., and Ridolfi, M.: MIPAS Level 2 Algorithm Theoretical Baseline Document, Tech. Rep. TN-IROE-RSA9601, Istituto di Ricerca sulle Onde
Elettro-magnetiche Nello Carrara (IROE), Firenze, Italy, 2001. 4564
Coheur, P. F., Clerbaux, C., and Colin, R.: Spectroscopic measurements of halocarbons and hydrohalocarbons by satellite-borne remote sensors, J. Geophys. Res., 108(D4), 4130, 30
doi:10.1029/2002JD002649, 2003. 4563
ACPD
8, 4561–4602, 2008 Envisat MIPAS Measurements of CFC-11 L. Hoffmann et al. Title Page Abstract Introduction Conclusions References Tables Figures ◭ ◮ ◭ ◮ Back Close Full Screen / EscPrinter-friendly Version Interactive Discussion
EGU
Satellite and Its Integration, ESA Bull., 106, 26–45, 2001. 4564
Dudhia, A.: RFM Software User’s Manual, Department of Atmospheric, Oceanic and Planetary
Physics, University of Oxford, United Kingdom,http://www.atm.ox.ac.uk/RFM, 2004.4567
Dudhia, A., Jay, V. L., and Rodgers, C. D.: Microwindow selection for high-spectral-resolution
sounders, Appl. Optics, 41, 3665–3673, 2002.4565
5
Elkins, J. W., Fahey, D. W., Gilligan, J. M., Dutton, G. S., Baring, T. J., Volk, C. M., Dunn, R. E., Myers, R. C., Montzka, S. A., Wamsley, P. R., Hayden, A. H., Butler, J. H., Thompson, T. M., Swanson, T. H., Dlugokencky, E. J., Novelli, P. C., Hurst, D. F., Lobert, J. M., Ciciora, S. J., McvLaughlin, R. J., Thompson, T. L., Winkler, R. H., Fraser, P. J., Steele, L. P., and Lucarelli, M. P.: Airborne gas chromatograph for in situ measurements of long-lived species in the 10
upper troposphere and lower stratosphere, Geophys. Res. Lett., 23, 347–350, 1996. 4563
Endemann, M.: MIPAS Instrument Concept and Performance, in: Proceedings of ESAMS ’99 –
European Symposium on Atmospheric Measurements from Space, pp. 29–43, 1999. 4564
Fischer, H. and Oelhaf, H.: Remote sensing of vertical profiles of atmospheric trace
con-stituents with MIPAS limb-emission spectrometers, Appl. Optics, 35, 2787–2796, 1996.4564
15
Fischer, H., Birk, M., Blom, C., Carli, B., Carlotti, M., von Clarmann, T., Delbouille, L., Dudhia, A., Ehhalt, D., Endemann, M., Flaud, J. M., Gessner, R., Kleinert, A., Koopmann, R., Langen, J., Lpez-Puertas, M., Mosner, P., Nett, H., Oelhaf, H., Perron, G., Remedios, J., Ridolfi, M., Stiller, G., and Zander, R.: MIPAS: an instrument for atmospheric and climate research, Atmos. Chem. Phys. Discuss., 7, 8795–8893, 2007,
20
http://www.atmos-chem-phys-discuss.net/7/8795/2007/. 4564
Francis, G. L., Edwards, D. P., Lambert, A., Halvorson, C. M., Lee-Taylor, J. M., and Gille, J. C.: Forward modeling and radiative transfer for the NASA EOS-Aura High Res-olution Dynamics Limb Sounder (HIRDLS) instrument, J. Geophys. Res., 111, D13301,
doi:10.1029/2005JD006270, 2006. 4567
25
Glatthor, N., von Clarmann, T., Fischer, H., Funke, B., Gil-L ´opez, S., Grabowski, U., H ¨opfner, M., Kellmann, S., Linden, A., L ´opez-Puertas, M., Tsidu, G. M., Milz, M., Steck, T., Stiller, G. P., and Wang, D.-Y.: Retrieval of stratospheric ozone profiles from MIPAS/ENVISAT limb emission spectra: a sensitivity study, Atmos. Chem. Phys., 6, 2767–2781, 2006,
http://www.atmos-chem-phys.net/6/2767/2006/. 4568
30
Golombek, A. and Prinn, R. G.: A global three-dimensional model of the circulation and
chem-istry of CFCl3, CF2Cl2, CH3CCl3, CCl4and N2O, J. Geophys. Res., 91, 3985–4001, 1986.
ACPD
8, 4561–4602, 2008 Envisat MIPAS Measurements of CFC-11 L. Hoffmann et al. Title Page Abstract Introduction Conclusions References Tables Figures ◭ ◮ ◭ ◮ Back Close Full Screen / EscPrinter-friendly Version Interactive Discussion
EGU
Gordley, L. L. and Russel, J. M.: Rapid inversion of limb radiance data using an emissivity
growth approximation, Appl. Optics, 20, 807–813, 1981.4567
Grossmann, K. U., Offermann, D., Gusev, O., Oberheide, J., Riese, M., and Spang, R.: The CRISTA-2 mission, J. Geophys. Res., 107(D23), 8173, doi:10.1029/2001JD000667, 2002.
4576
5
Gunson, M. R., Abbas, M. M., Abrams, M. C., Allen, M., Brown, L. R., Brown, T. L., Chang, A. Y., Goldman, A., Irion, F. W., Lowes, L. L., Mahieu, E., Manney, G. L., Michelsen, H. A., Newchurch, M. J., Rinsland, C. P., Salawitch, R. J., Stiller, G. P., Toon, G. C., Yung, Y. L., and Zander, R.: The Atmospheric Trace Molecule Spectroscopy (ATMOS) experiment: De-ployment on the ATLAS Space Shuttle missions, Geophys. Res. Lett., 23, 2333–2336, 1996. 10
4576
Hartley, D. E., Kindler, T., Cunnold, D. M., and Prinn, R. G.: Evaluating chemical transport models: Comparison of effects of different CFC-11 emission scenarios, J. Geophys. Res.,
101, 14 381–14 385, 1996. 4563
Hervig, M. E., Russell III, J. M., Gordley, L. L., Park, J. H., Drayson, S. R., and Deshler, T.: 15
Validation of aerosol measurements from the Halogen Occultation Experiment, J. Geophys.
Res., 101, 10 267–10 276, 1996. 4570
Hoffmann, L.: Schnelle Spurengasretrieval f ¨ur das Satellitenexperiment Envisat MIPAS, Tech.
Rep. JUEL-4207, Forschungszentrum J ¨ulich, Germany, ISSN 0944-2952, 2006. 4567,4580
Hoffmann, L., Spang, R., Kaufmann, M., and Riese, M.: Retrieval of CFC-11 and CFC-12 from 20
Envisat MIPAS observations by means of rapid radiative transfer calculations, Adv. Space
Res., 36, 915–921, 2005.4579
IPCC: Climate Change 2007: The Physical Science Basis. Contributions of Working Group I to the Fourth Assessment Report of the Intergovernmental Panel on Climate Change,
Cam-bridge University Press, 2007. 4563
25
Kao, C.-Y., Tie, J. X., Mroz, E., Cunnold, D., and Alyea, F.: Simulations of the global CFC-11 using the Los Alamos chemical tracer model, J. Geophys. Res., 95, 15 827–15 838, 1992.
4563
Kiefer, M., von Clarmann, T., Grabowski, U., Laurentis, M. D., Mantovani, R., Milz, M., and
Ridolfi, M.: Characterization of MIPAS elevation pointing, acp, 7, 1615–1628, 2007. 4565,
30
4571
Kleinert, A., Aubertin, G., Perron, G., Birk, M., Wagner, G., Hase, F., Nett, H., and Poulin, R.: MIPAS Level 1B algorithms overview: operational processing and characterization, Atmos.
ACPD
8, 4561–4602, 2008 Envisat MIPAS Measurements of CFC-11 L. Hoffmann et al. Title Page Abstract Introduction Conclusions References Tables Figures ◭ ◮ ◭ ◮ Back Close Full Screen / EscPrinter-friendly Version Interactive Discussion
EGU
Chem. Phys., 7, 1395–1406, 2007, http://www.atmos-chem-phys.net/7/1395/2007/. 4564,
4565,4570
Kuell, V., Olschewski, F., Jarisch, M., Offermann, D., and Grossmann, K. U.: Trace gas
variabil-ity in the stratosphere, Adv. Space Res., 34, 1722–1730, 2004. 4580
Kuell, V., Offermann, D., Jarisch, M., Schaeler, B., Engel, A., Claude, G., Smit, H. G. J., Ebel, A., 5
and Feldmann, H.: Tropopause region temperatures and CFC 11 mixing ratios from CRISTA
2, J. Geophys. Res., 110, D16104, doi:10.1029/2004JD005592, 2005. 4563
Lachance, R. L.: MIPAS Level 1B Algorithm Technical Baseline Document: An Overview, in: Proceedings of ESAMS ’99 – European Symposium on Atmospheric Measurements from
Space, pp. 51–63, 1999. 4564
10
Louet, J.: The Envisat Mission and System, ESA Bull., 106, 11–25, 2001.4564
Marshall, B. T., Gordley, L. L., and Chu, D. A.: BANDPAK: Algorithms for Modeling Broadband
Transmission and Radiance, J. Quant. Spectrosc. Radiat. Transfer, 52, 581–599, 1994.4567
McDaniel, A. H., Cantrell, C. A., Davidson, J. A., Shetter, R. E., and Calvert, J. C.: The Tenper-ature Dependent, Infrared Absorption Cross-Sections for the Chlorofluorocarbons: CFC-11, 15
CFC-12, CFC-13, CFC-14, CFC-22, CFC-113, CFC-114, and CFC-115, J. Atmos. Chem.,
12, 211–227, 1991.4565
Moore, D. P. and Remedios, J. J.: Growth rates of stratospheric HCFC-22, Atmos. Chem. Phys.,
8, 73–82, 2008,http://www.atmos-chem-phys.net/8/73/2008/. 4574
Moore, D. P., Waterfall, A. M., and Remedios, J. J.: The potential for radiometric retrievals of 20
halocarbon concentrations from the MIPAS-E instrument, Adv. Space Res., 37, 2238–2246,
2006. 4574
Morgenstern, O., Lee, A. M., and Pyle, J. A.: Cumulative mixing inferred from stratospheric tracer relationships, J. Geophys. Res., 107, 8321, doi:10.1029/2002JD002098, 2002 (printed
108(D5), 2003).4563
25
M ¨uller, R., McKenna, D. S., Schmidt, U., Engel, A., and Proffitt, M. H.: The O3–N2O relation
from balloon-borne observations as a measure of Arctic ozone loss in 1991/92, Q. J. Roy.
Meteorol. Soc., 127, 1389–1412, 2001. 4563
Nett, H.: MIPAS Data Products, in: Proceedings of ESAMS ’99 – European Symposium on
Atmospheric Measurements from Space, pp. 45–49, 1999.4564
30
Nett, H., Perron, G., Sanchez, M., Burgess, A., and Mosner, P.: MIPAS In-Flight Calibration and Processor Verification, in: Proceedings of the Envisat Calibration Review, SP-520, ESA Publications Division, ESTEC, Keplerlaan 1, 2200 AG Noordwijk, The Netherlands, 2002.
ACPD
8, 4561–4602, 2008 Envisat MIPAS Measurements of CFC-11 L. Hoffmann et al. Title Page Abstract Introduction Conclusions References Tables Figures ◭ ◮ ◭ ◮ Back Close Full Screen / EscPrinter-friendly Version Interactive Discussion
EGU 4565,4570
Norton, R. H. and Beer, R.: New apodizing functions for Fourier spectrometry, J. Opt. Soc. Am.,
66, 259–264, see errata, 1976. 4567
Norton, R. H. and Beer, R.: Errata for ‘New apodizing functions for Fourier spectrometry’, J.
Opt. Soc. Am., 67, 419, 1977. 4567
5
Notholt, J.: FTIR measurements of HF, N2O and CFCs during the Arctic polar night with the
moon as light source, subsidence during winter 1992/93, Geophys. Res. Lett., 21, 2385–
2388, 1994. 4563
Offermann, D., Grossmann, K.-U., Barthol, P., Knieling, P., Riese, M., and Trant, R.: Cryogenic Infrared Spectrometers and Telescopes for the Atmosphere (CRISTA) experiment and middle 10
atmosphere variability, J. Geophys. Res., 104, 16 311–16 325, 1999. 4576
Piccolo, C. and Dudhia, A.: Precision validation of MIPAS-Envisat products, Atmos. Chem.
Phys., 7, 1915–1923, 2007,http://www.atmos-chem-phys.net/7/1915/2007/. 4565,4571
Plumb, R. A., Waugh, D. W., and Chipperfield, M. P.: The effects of mixing on tracer
relation-ships in the polar vortices, J. Geophys. Res., 105, 10 047–10 062, 2000.4563
15
Prinn, R. G., Weiss, R. F., Fraser, P. J., Simmonds, P. G., Cunnold, D. M., Alyea, F. N., O’Doherty, S., Salameh, P., Miller, B. R., Huang, J., Wang, R. H. J., Hartley, D. E., Harth, C., Steele, L. P., Sturrock, G., Midgley, P. M., and McCulloch, A.: A history of chemically and radiatively important gases in air deduced from ALE/GAGE/AGAGE, J. Geophys. Res., 105,
17 751–17 792, 2000. 4563
20
Purser, R. J. and Huang, H.-L.: Estimating Effective Data Density in a Satellite Retrieval or an
Objective Analysis, J. Appl. Meteor., 32, 1092–1107, 1993. 4572
Raspollini, P., Belotti, C., Burgess, A., Carli, B., Carlotti, M., Ceccherini, S., Dinelli, B. M., Dudhia, A., Flaud, J.-M., Funke, B., H ¨opfner, M., L ´opez-Puertas, M., Payne, V., Piccolo, C., Remedios, J. J., Ridolfi, M., and Spang, R.: MIPAS level 2 operational analysis, Atmos. 25
Chem. Phys., 6, 5605–5630, 2006, http://www.atmos-chem-phys.net/6/5605/2006/. 4564,
4571
Remedios, J. J., Leigh, R. J., Waterfall, A. M., Moore, D. P., Sembhi, H., Parkes, I., Greenhough, J., Chipperfield, M., and Hauglustaine, D.: MIPAS reference atmospheres and comparisons to V4.61/V4.62 MIPAS level 2 geophysical data sets, Atmos. Chem. Phys. Discuss., 7, 9973– 30
10 017, 2007.4569,4571,4577,4578,4601
Ridolfi, M., Carli, B., Carlotti, M., von Clarmann, T., Dinelli, B. M., Dudhia, A., Flaud, J.-M., H ¨opfner, M., Morris, P. E., Raspollini, P., Stiller, G., and Wells, R. J.: Optimized forward
ACPD
8, 4561–4602, 2008 Envisat MIPAS Measurements of CFC-11 L. Hoffmann et al. Title Page Abstract Introduction Conclusions References Tables Figures ◭ ◮ ◭ ◮ Back Close Full Screen / EscPrinter-friendly Version Interactive Discussion
EGU
model and retrieval scheme for MIPAS near-real-time data processing, Appl. Optics, 39,
1323–1340, 2000. 4564
Ridolfi, M., Blum, U., Carli, B., Catoire, V., Ceccherini, S., Claude, H., Clercq, C. D., Fricke, K. H., Friedl-Vallon, F., Iarlori, M., Keckhut, P., Kerridge, B., Lambert, J.-C., Meijer, Y. J., Mona, L., Oelhaf, H., Pappalardo, G., Pirre, M., Rizi, V., Robert, C., Swart, D., von Clarmann, 5
T., Waterfall, A., and Wetzel, G.: Geophysical validation of temperature retrieved by the ESA processor from MIPAS/ENVISAT atmospheric limb-emission measurements, Atmos. Chem.
Phys., 7, 4459–4487, 2007,http://www.atmos-chem-phys.net/7/4459/2007/. 4565
Riediger, O., Volk, C. M., Strunk, M., and Schmidt, U.: HAGAR – A new in situ tracer instrument for stratospheric balloons and high altitude aircraft, Eur. Comm. Air Pollut. Res. Report, 73, 10
727–730, 2000. 4577
Riese, M., Spang, R., Preusse, P., Ern, M., Jarisch, M., Offermann, D., and Grossmann, K. U.: Cryogenic Infrared Spectrometers and Telescopes for the Atmosphere (CRISTA) data processing and atmospheric temperature and trace gas retrieval, J. Geophys. Res., 104,
16 349–16 367, 1999a. 4563
15
Riese, M., Tie, X., Brasseur, G., and Offermann, D.: Three-dimensional simulation of strato-spheric trace gas distributions measured by CRISTA, J. Geophys. Res., 104, 16 419–16 435,
1999b.4576
Roche, A. E., Nightingale, R. W., Kumer, J. B., Mergenthaler, J. L., Jackman, C. H., and Flem-ing, E. L.: Distribution and seasonal variation of CFCs in the stratosphere: Comparison of 20
satellite global data and a 2-D model, Adv. Space Res., 21, 1383–1391, 1998. 4569,4577
Rodgers, C. D.: Retrieval of Atmospheric Temperature and Composition From Remote
Mea-surements of Thermal Radiation, Rev. Geophys. Space Phys., 14, 609–624, 1976. 4568
Rodgers, C. D.: Characterization and Error Analysis of Profiles Retrieved From Remote
Sound-ing Measurements, J. Geophys. Res., 95, 5587–5595, 1990. 4568,4570
25
Rodgers, C. D.: Information Content and Optimizitaion of High Spectral Resolution Remote
Measurements, Adv. Space Res., 21, 361–367, 1998. 4565
Rodgers, C. D.: Inverse Methods for Atmospheric Sounding: Theory and Practice, vol. 2 of
“Series on Atmospheric, Oceanic and Planetary Physics”, World Scientific, 2000. 4568,
4569,4570,4572,4573
30
Rothman, L. S., Barbe, A., Benner, D. C., Brown, L. R., Camy-Peyret, C., Carleer, M. R., Chance, K., Clerbaux, C., Dana, V., Devi, V. M., Fayt, A., Flaud, J.-M., Gamache, R. R., Goldman, A., Jacquemart, D., Jucks, K. W., Lafferty, W. J., Mandin, J.-Y., Massie, S. T.,