All-Fiber-Based Ultrashort Pulse Generation and Chirped
Pulse Amplification Through Parametric Processes
The MIT Faculty has made this article openly available.
Please share
how this access benefits you. Your story matters.
Citation
Zhou, Yue et al. “All-Fiber-Based Ultrashort Pulse Generation and
Chirped Pulse Amplification Through Parametric Processes.” IEEE
Photonics Technology Letters 22.17 (2010): 1330–1332. Web. 30 Mar.
2012. © 2010 Institute of Electrical and Electronics Engineers
As Published
http://dx.doi.org/10.1109/lpt.2010.2055557
Publisher
Institute of Electrical and Electronics Engineers (IEEE)
Version
Final published version
Citable link
http://hdl.handle.net/1721.1/69894
Terms of Use
Article is made available in accordance with the publisher's
policy and may be subject to US copyright law. Please refer to the
publisher's site for terms of use.
1330 IEEE PHOTONICS TECHNOLOGY LETTERS, VOL. 22, NO. 17, SEPTEMBER 1, 2010
All-Fiber-Based Ultrashort Pulse Generation
and Chirped Pulse Amplification Through
Parametric Processes
Yue Zhou, Qin Li, Kim K. Y. Cheung, Sigang Yang, P. C. Chui, and Kenneth K. Y. Wong
Abstract—We experimentally demonstrate, for the first time
to the best of our knowledge, the use of optical fiber for optical parametric chirped pulse amplification to amplify subpicosecond pulses. We use this system to amplify a subpicosecond signal at 1595 nm generated by a fiber-optical parametric oscillator. The 750-fs signal from the oscillator output is stretched to 40 ps, amplified by an all-fiber optical parametric amplifier and then compressed to 808 fs. The peak power of the signal is amplified from 93 mW to 10 W.
Index Terms—Optical parametric amplifier, optical parametric
oscillator, optical pulse generation.
I. INTRODUCTION
O
PTICAL parametric chirped pulse amplification (OPCPA), first demonstrated by Dubietis et al. [1], has been investigated comprehensively [2], [3] and is recog-nized as a key technique to amplify ultrafast pulses. Using OPCPA configuration, people can achieve extremely high peak power pulses [4], [5]. OPCPA has some advantages over other CPA techniques, such as a broad bandwidth, good thermal properties, and access to arbitrary wavelength ranges. OPCPA in optical fibers, which is called fiber-optical parametric chirped pulse amplification (FOPCPA), has been proposed and numer-ical simulated by Hanna et al. [6]. Compared with conventional OPCPA systems based on nonlinear effect of crystals, FOPCPA based on nonlinear effect of optical fibers allows a longer interaction length, eliminates the need for alignment, and offers further integration with other fiber components. The chirping stages here simply stand for stretching and com-pressing stages, which are the same as those in conventional OPCPA systems. In our previous work [7], FOPCPA has been experimentally demonstrated to amplify 1.5-ps pulses. What is more, at the same time another group also demonstrated Manuscript received February 28, 2010; revised May 20, 2010; accepted June 19, 2010. Date of publication June 28, 2010; date of current version August 13, 2010. This work was supported in part by a grant from the Research Grants Council of the Hong Kong Special Administrative Region, China (Project HKU 7179/08E and HKU 7183/09E).Y. Zhou, Q. Li, K. K. Y. Cheung, S. Yang, and P. C. Chui are with the Departement of Electrical and Electronic Engineering, the University of Hong Kong, Hong Kong (e-mail: [email protected]).
K. K. Y. Wong is with the Massachusetts Institute of Technology, Cambridge, MA 02139 USA, on leave from the Departement of Electrical and Electronic Engineering, the University of Hong Kong, Hong Kong (e-mail: kywong@eee. hku.hk).
Color versions of one or more of the figures in this letter are available online at http://ieeexplore.ieee.org.
Digital Object Identifier 10.1109/LPT.2010.2055557
FOPCPA to amplify 6.4-ps pulses [8]. However, to the best of our knowledge, FOPCPA with subpicosecond pulsewidth has not yet been experimentally demonstrated. Thus, to experimen-tally demonstrate an FOPCPA system which can be used to amplify subpicosecond pulses is highly desirable.
One of the key parameters of ultrashort pulsed fiber-optical parametric oscillators (FOPOs) [9] is the output peak power. In the wavelength region around 1000 nm, peak power of 1.2 kW can be achieved using high-power Ti : sapphire oscillator as the pump [10]. However, in the spectral region around 1550 nm, where most of the telecommunications applications require, the peak power of the output signal of FOPO was less than 1 W as demonstrated in previous work [11]–[14]. Thus, it is desir-able to further increase the output power of the FOPO, using an additional amplifier. Due to the remarkable amplification per-formance of fiber-optical parametric amplifier (FOPA) [15] in both conventional and nonconventional bands, it is logical for us to use this configuration to further amplify the signal.
In this letter, the combination of FOPO and FOPCPA is demonstrated. We use the signal output of the FOPO with a pulsewidth of 750 fs and wavelength of 1595 nm as the input signal of the FOPCPA system. The peak power of the signal is amplified from 93 mW to 10 W. The proof-of-concept demon-stration of FOPCPA may lead to further development of the OPCPA system. The totally fiber-integrated nature of the whole system allows complete self-alignment and further integration to other fiber-based systems. These techniques have potential applications in generation and high energy amplification of ultrashort pulses. Furthermore, as opposed to an erbium-doped fiber amplifier (EDFA), the arbitrary gain regions of FOPA [15] allows ultrafast signal generation and amplification in nonconventional wavelength bands.
II. PULSEGENERATIONUSINGFOPO
The experimental setup of the FOPO is shown in Fig. 1, which is similar to our previous work in [14]. The pump was a mode-locked fiber laser (MLFL), which generated short pulse with pulsewidth of 1.5 ps and repetition rate of 10 GHz at 1555 nm. The output from pulsed laser was intensity-modu-lated by a 100-MHz electrical pulse with duty ratio of 1/100 to increase the peak power of the pump in the later stage. It was then amplified, filtered and further coupled into the cavity for parametric amplification. The peak power of the pump was measured to be 17.6 W after the wavelength-division-multi-plexing coupler (WDMC1) which had a separation wavelength at 1565 nm. A spool of 10-m HNL-DSF1 which had nonlinear 1041-1135/$26.00 © 2010 IEEE
ZHOU et al.: ALL-FIBER-BASED ULTRASHORT PULSE GENERATION AND CHIRPED PULSE AMPLIFICATION 1331
Fig. 1. Experimental setup of the FOPO. MLFL: mode-locked fiber laser; VBTBPF: variable bandwidth tunable bandpass filter; HNL-DSF: highly non-linear dispersion-shifted fiber; EDFA: erbium-doped fiber amplifier; TBPF: tun-able bandpass filter; OSA: optical spectrum analyzer; MZM: Mach–Zehnder modulator; ODL: optical delay line; CIR: circulator.
coefficient of 14 W km , zero-dispersion wavelength of 1554.7 nm and dispersion slope of 0.035 ps/nm /km was de-ployed as the gain medium inside the cavity. A 50/50 coupler in the cavity provided 50% feedback and 50% output. The signal was filtered out by the variable-bandwidth tunable bandpass filter (VBTBPF1) with a bandwidth of 10 nm. Tuning was achieved by adjusting the center wavelength of VBTBPF1. The polarization controller PC2 inside the cavity was used to align the state of polarization (SOP) of the signal with that of the pump, while the ODL1 in the cavity was used to synchronize the signal with the pump. The FOPO output spectrum was mon-itored by an OSA through a 1/99 coupler. Another VBTBPF2 with a 5-nm bandwidth was used to filter out the desired signal, and its pulsewidth was measured by an autocorrelator. Since the power of the signal was relatively small due to the loss of the VBTBPF2 ( 10 dB), it was required to use an -band EDFA to amplify it to a peak power of 5 W before launching it into the autocorrelator to measure its pulsewidth.
Fig. 2 shows the pulsewidth and the time-bandwidth product (TBP) as a function of signal wavelength. Insets are autocor-relation traces at some wavelengths measured by the autocorre-lator. The real full-width at half-maximum (FWHM) pulsewidth is calculated by assuming a sech pulse shape, multiplied the FWHM correlation width using a deconvolution factor of 0.648. Since the pulses have the same spectral bandwidth (5-nm), the curve for pulsewidth and the curve for TBP can be plotted into one curve. The pulsewidth increases when the signal detunes further from the pump, due to the walk-off between the signal and pump becomes larger which broaden the signal pulsewidth [16]. It can be observed that the pulsewidths of the signal (from 570 to 964 fs) are narrower than that of the pump (1.5 ps) be-cause of the pulse compression effect [17]. The TBP is calcu-lated to be around 0.36 to 0.60, which is larger than that of the transform-limited soliton pulse, 0.315. The tuning range of the FOPO is as wide as 30 nm. The peak power of the FOPO output signal is measured to be 93 mW at 1595 nm, corresponding to an efficiency of 0.53%. The relatively low efficiency is primarily due to the large insertion loss of the VBTBPF2, which is around 10 dB at 1600 nm.
III. CHIRPEDPULSEAMPLIFICATIONUSINGFOPA In the previous section, we used an FOPO to realize sub-picosecond signal generation. To increase the peak power of
Fig. 2. Pulsewidth and time-bandwidth product versus signal wavelength. In-sets are autocorrelation traces at some wavelengths.
Fig. 3. Experimental setup of the FOPCPA.
the signal, we sent the output of the FOPO as the input of the FOPCPA system. The signal we chose had a center wavelength of 1595 nm, pulsewidth of 750 fs, and linewidth of 5 nm. The experimental setup of FOPCPA is shown in Fig. 3. The red dashed line shows the directions of optical path in the system. PC4 was used to align the SOP of the signal with that of the pump so as to maximize the parametric gain. A spool of 1-km single-mode fiber (SMF) with a dispersion of 20 ps/nm/km at 1595 nm was used to stretch the signal from 750 fs to 40 ps, with a stretching ratio of larger than 50. The peak power of the signal decreased from 93 to 1.5 mW after the stretcher. The pump source was a tunable laser source (TLS), which was fixed at 1555 nm, the same as the pump wavelength of the FOPO. The continuous-wave (CW) output of the TLS was intensity-modu-lated by the same electrical pulse used to drive MZM1 in Fig. 1 to generate pump pulse with pulsewidth of 100 ps and repe-tition rate of 100 MHz. It was then amplified by EDFA3 and EDFA4 and filtered by TBPF2 with a linewidth of 1-nm to pro-duce a low-noise, high power pump. The ODL2 was used to synchronize the pump with the signal. The pump and signal were combined by WDMC2 with a separation wavelength at 1565 nm and launched into a 50-m HNL-DSF2 for parametric amplification. Other parameters of the fiber were the same as the HNL-DSF1. After parametric amplification, the signal was fil-tered by WDMC3, and compressed by a 100-m dispersion com-pensation fiber (DCF) with a dispersion of 96.6 ps/nm/km at 1595 nm to achieve a high peak power. The pulsewidth of the compressed signal was measured using an autocorrelator.
1332 IEEE PHOTONICS TECHNOLOGY LETTERS, VOL. 22, NO. 17, SEPTEMBER 1, 2010
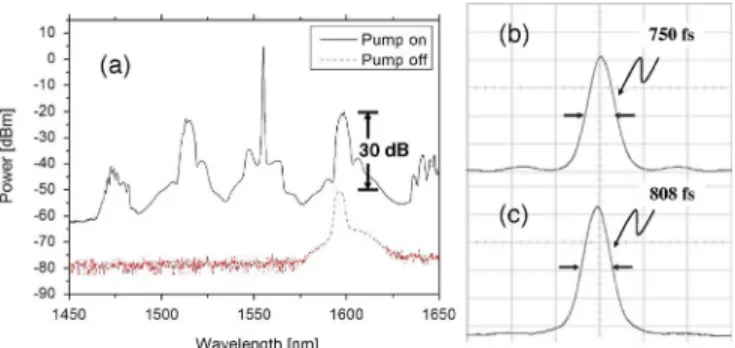
Fig. 4. (a) Optical spectra measured at HNL-DSF2 output when the pump is
OFF(red dashed line) and when the pump isON(black solid line); (b) autocor-relation trace of the original signal pulse; and (c) autocorautocor-relation trace of the amplified signal after compression.
Fig. 4(a) shows the signal spectra measured at the HNL-DSF2 output when the pump is switchedOFF(red dashed line) andON (black solid line). The wavelength of the signal is 1595 nm. It can be observed that the signal receives a parametric gain of 30 dB, and a strong idler at 1514 nm is also generated. The smaller peaks are due to the spurious FWM. The pedestal at the bottom of the pump is due to the ASE noise from the EDFA4. The peak power of the output signal pulse after HNL-DSF2 is measured to be 1 W.
Fig. 4 also shows the autocorrelation traces of the original signal pulse (b) and the amplified signal pulse after compression (c). The amplified signal, which has a pulsewidth of 40 ps and peak power of 1 W, is compressed by the DCF. The compressed pulse has a peak power of 10 W, and a pulsewidth of 808 fs, slightly larger than that of the original signal pulse. Thus, the peak power we can obtain using FOPCPA configuration can be 10 times larger than simply amplification without chirping the pulse. The peak power enhancement ratio is less than the com-pression ratio because of the loss in the compressor.
The FOPCPA system also allows the use of idler for potential optimal compression. Since the signal and idler are phase-con-jugated, the same copy of the signal stretcher can be used as the idler compressor. Thus, the use of the idler not only allows wavelength conversion, but also offers potentially simple com-pression design. Note that we use a stretching ratio of 50 to demonstrate the feasibility of FOPCPA with available equip-ments in our laboratory. It is expected that the performance of the FOPCPA system (the signal output peak power) can be im-proved if much longer stretched signal pulses are used, in which case much higher pump pulse energies can be applied.
IV. CONCLUSION
We first demonstrated a subpicosecond pulse generator based on FOPO. Ultrashort pulses were generated with a tuning range from 1585 to 1615 nm, with subpicosecond pulsewidth. We then made use of the generated signal at wavelength of 1595 nm as the input signal of a FOPCPA. The 750-fs signal was stretched
to 40 ps, amplified by an all-fiber optical parametric amplifier and then compressed to 808 fs. The peak power of the signal was amplified from 93 mW to 10 W. These techniques have potential applications in generation and amplification of ultrafast pulses in nonconventional wavelength bands.
ACKNOWLEDGMENT
The authors would like to acknowledge Sumitomo Electric Industries for providing the HNL-DSF and Alnair Laboratories for providing the VBTBPF.
REFERENCES
[1] A. Dubietis, G. Jonusauskas, and A. Piskarskas, “Powerful fem-tosecond pulse generation by chirped and stretched pulse parametric amplification in BBO crystal,” Opt. Commun., vol. 88, pp. 437–440, 1992.
[2] R. Butkus, R. Danielius, A. Dubietis, A. Piskarskas, and A. Stabinis, “Progress in chirped pulse optical parametric amplifiers,” Appl. Phys.
B, vol. 79, pp. 693–700, 2004.
[3] A. Dubietis, R. Butkus, and A. Piskarskas, “Trends in chirped pulse optical parametric amplification,” IEEE J. Sel. Topics Quantum
Elec-tron., vol. 12, no. 2, pp. 163–172, Mar./Apr. 2006.
[4] I. N. Ross, J. L. Collier, P. Matousek, C. N. Danson, D. Neely, R. M. Allot, D. A. Pepler, C. Hernandez-Gomez, and K. Osvay, “Generation of terawatt pulses by use of optical parametric chirped pulse amplifi-cation,” Appl. Opt., vol. 39, pp. 2422–2427, 2000.
[5] X. Yang, Z. Xu, Y. Leng, H. Lu, L. Lin, Z. Zhang, R. Li, W. Zhang, D. Yin, and B. Tang, “Multiterawatt laser system based on optical para-metric chirped pulse amplification,” Opt. Lett., vol. 27, pp. 1135–1137, 2002.
[6] M. Hanna, F. Druon, and P. Georges, “Fiber optical parametric chirped-pulse amplification in the femtosecond regime,” Opt. Express, vol. 14, pp. 2783–2790, 2006.
[7] Y. Zhou, K. K. Y. Cheung, P. C. Chui, and K. K. Y. Wong, “Experi-mental demonstration of fiber optical parametric chirped-pulse ampli-fication,” Proc. SPIE, vol. 7582, 2010, Paper 75820T.
[8] C. Caucheteur, D. Bigourd, E. Hugonnot, P. Szriftgiser, A. Kudlinski, M. G.-Herraez, and A. Mussot, “Experimental demonstration of optical parametric chirped pulse amplification in optical fiber,” Opt. Lett., vol. 35, no. 11, pp. 1786–1788, 2010.
[9] J. E. Sharping, “Microstructure fiber based optical parametric oscilla-tors,” J. Lightw. Technol., vol. 26, no. 14, pp. 2184–2191, Jul. 15, 2008. [10] J. E. Sharping, M. A. Foster, A. L. Gaeta, J. Lasri, O. Lyngnes, and K. Vogel, “Octave-spanning, high-power microstructure-fiber-based optical parametric oscillators,” Opt. Express, vol. 15, pp. 1474–1479, 2007.
[11] D. K. Serkland, G. D. Bartolini, A. Agrawal, P. Kumar, and W. L. Kath, “Pulsed degenerate optical parametric oscillator based on a nonlinear-fiber Sagnac interferometer,” Opt. Lett., vol. 23, pp. 795–797, 1998. [12] D. K. Serkland and P. Kumar, “Tunable fiber-optic parametric
oscil-lator,” Opt. Lett., vol. 24, pp. 92–94, 1999.
[13] J. Lasri, P. Devgan, R. Tang, J. E. Sharping, and P. Kumar, “A microstructure-fiber-based 10-GHz synchronized tunable optical parametric oscillator in the 1550-nm regime,” IEEE Photon. Technol.
Lett., vol. 15, no. 8, pp. 1058–1060, Aug. 2003.
[14] Y. Zhou, K. K. Y. Cheung, S. Yang, P. C. Chui, and K. K. Y. Wong, “Widely-tunable picosecond optical parametric oscillator using highly-nonlinear fiber,” Opt. Lett., vol. 34, no. 7, pp. 989–991, 2009. [15] M. E. Marhic, Fiber Optical Parametric Amplifiers, Oscillators and
Related Devices. Cambridge, U.K.: Cambridge Univ. Press, 2007. [16] Y. Zhou, B. P. P. Kuo, K. K. Y. Cheung, S. Yang, P. C. Chui, and K. K.
Y. Wong, “Wide-band generation of picosecond pulse using fiber op-tical parametric amplifier and oscillator,” IEEE J. Quantum Electron., vol. 45, no. 11, pp. 1350–1356, Nov. 2009.
[17] T. Torounidis, M. Karlsson, and P. A. Andrekson, “Fiber optical para-metric amplifier pulse source: Theory and experiments,” J. Lightw.