Publisher’s version / Version de l'éditeur:
Vous avez des questions? Nous pouvons vous aider. Pour communiquer directement avec un auteur, consultez la première page de la revue dans laquelle son article a été publié afin de trouver ses coordonnées. Si vous n’arrivez pas à les repérer, communiquez avec nous à [email protected].
Questions? Contact the NRC Publications Archive team at
[email protected]. If you wish to email the authors directly, please see the first page of the publication for their contact information.
https://publications-cnrc.canada.ca/fra/droits
L’accès à ce site Web et l’utilisation de son contenu sont assujettis aux conditions présentées dans le site LISEZ CES CONDITIONS ATTENTIVEMENT AVANT D’UTILISER CE SITE WEB.
Research Paper (National Research Council of Canada. Division of Building
Research); no. DBR-RP-651, 1974-11
READ THESE TERMS AND CONDITIONS CAREFULLY BEFORE USING THIS WEBSITE. https://nrc-publications.canada.ca/eng/copyright
NRC Publications Archive Record / Notice des Archives des publications du CNRC :
https://nrc-publications.canada.ca/eng/view/object/?id=a0f92655-faef-470f-af7b-d836d46bb317 https://publications-cnrc.canada.ca/fra/voir/objet/?id=a0f92655-faef-470f-af7b-d836d46bb317
NRC Publications Archive
Archives des publications du CNRC
This publication could be one of several versions: author’s original, accepted manuscript or the publisher’s version. / La version de cette publication peut être l’une des suivantes : la version prépublication de l’auteur, la version acceptée du manuscrit ou la version de l’éditeur.
For the publisher’s version, please access the DOI link below./ Pour consulter la version de l’éditeur, utilisez le lien DOI ci-dessous.
https://doi.org/10.4224/40001760
Access and use of this website and the material on it are subject to the Terms and Conditions set forth at
Characteristic temperature curves for various fire severities
15
I--;.;: /_.i C
J
Ser
no.
651
NATIONAL RESEARCH COUNCIL O F CANADAc . 2
3NSEIL NATIONAL D E RECHERCHES D U CANADA BLDG
Characteristic Temperature Curves
for Various Fire Severities
by T. T. Lie
Reprinted from F I R E TECHNOLOGY Vol. 10, No. 4, November 1974
p. 315-326
Research Paper No. 651 of the
Division of Building Research
GOURBES DE TEMPERATURE CARACTERISTIQUES DES INCENDIES DE PROPORTIONS DIFFERNTES
SOMMAIRE
L'auteur presente des expressions qui definissent la shverith de l'incendie dans un edifice en fonction de parametres signifi- catifs. Les courbes de temperature que dhcrivent ces expres- sions caracthrisent des incendies de proportions diffhrentes dans des cas de ventilation surveillee. Elles doivent servir de courbes d'exposition de base dans le calcul de la resistance a u feu.
FIRE TECHNOLOGY
Characteristic Temperature Curves
for Various Fire Severities
T. T. LIE
Division of Building Research
National Research Council of Canada
The temperature curves described here characterize the tempera- ture course of ventilation controlled fires of various severities. They are intended as basic exposure curves for fire-resistive design.
T
H E severity of fire in buildings can vary in a wide range, and several studies have been carried out to investigate the determining factors. At present it is possible t o estimate the temperature course of fire in enclosures under various conditions, provided the values of the parameters t h a t deter- mine it are known.Several of these parameters, however, such as amount and surface area of the combustible materials, are unpredictable as they change with time and often vary from compartment to compartment in a building. It is not possible, therefore, to know a t the time a building is erected the temperature course of a fire to which objects in that building might be exposed during its service life. I n fact, an infinite number of temperature courses are possible, each having a certain probability of occurrence.
It is possible, however, to indicate for any enclosure a characteristic temperature-time curve that, with reasonable likelihood, will not be ex- ceeded during the lifetime of the building. Such curves are useful as a basis for the fire-resistive design of buildings. They can also facilitate studies of fire resistance of building components exposed to fires of different severity.
We intended to develop in the present study characteristic temperature- time curves for situations that commonly occur in practice and t o derive analytical expressions that define these curves for any situation as a function of the significant parameters.
P A R A M E T E R S D E T E R M I N I N G T H E F I R E T E M P E R A T U R E C O U R S E
The most important parameters that determine the temperature course of a fire were first shown by Kawagoe and Sekinel and by Odeen,2 who estimated the heat balance for fires in enclosed spaces. Usually
Copyright 1974, NATIONAL FIRE PROTECTION ASSOCIATION, 4 7 0 ATLANTIC AVE., BOSTON, MASS. 02210 Printed in U.S.A.
part of the heat produced during a fire in an enclosure will be absorbed by the walls and contents, a part by the gases, and a part will be lost by radiation and convection from windows. There is also loss of chemical energy that could have been released as heat because of outflow of un- burned gases, which burn outside the enclosure. In addition there is loss of unburned particles.
T o be able to determine the temperature course, it is necessary to know a t each moment during a fire the rate a t which heat is produced and the rate a t which heat is lost to exposed materials and surroundings. Several of the parameters that determine heat production and heat losses, such as material properties, room dimensions, wall constiuction, window area, and emissivity of the flames and exposed materials, can be determined with reasonable accuracy. Others that are known approximately are the amount of gases that burn outside the room, the loss of unburned particles through windows, and the temperature differences in the room.
There are several parameters, however, whose magnitude cannot be predicted. Usually they change with time, and therefore their value a t the time of occurrence of a fire is determined by chance. Such parameters include the amount, surface area and arrangement of the combustible contents, velocity and direction of wind and t h e outside temperature. The influence of wind3 and that of fire load can be substantial. Surveys show, for instance, that the variability of fire loads in various types of buildings is such that deviations in the order of 50 percent or more from the most probable fire load are c ~ r n r n o n . ~ As a consequence, variability of fire load alone may easily cause deviations from the most probable temperature course of several hundred degrees Fahrenheit in temperature and 50 percent or more in fire duration. If other uncertain factors are taken into account, such as change of fuel surface area due to collapse of furniture and other contents during a fire, presence or formation of unaccounted openings in walls, ceilings or doors, and creation of local hot zones due to fire load concentrations, the deviations may be even greater.
P O S S I B L E F I R E S E V E R I T I E S
Owing t o the substantial influence of uncertain factors, i t is impossible to predict accurately the temperatures to which building components will be exposed during their service life. Even if the analysis t o predict fire temperatme courses in enclosures is perfect, the chance that a certain predicted temperature course will occur is infinitely small. Therefore in establishing a temperature-time curve that is suitable as a basis for the fire-resistance design of buildings, it is not essential to find a curve that realistically represents the most probable fire curve. The essence is to find a curve whose effect, with reasonable probability, will not be exceeded during the use of the building.
The temperatures to wlich building components will most likely be exposed during the use of a building are room temperatures or those corre-
Temperature Curves 317 sponding to a fire of low severity t h a t has been extinguished. There is a small although not insignificant chance of occurrence of a fully developed fire. I n this case, and assuming that the fire cannot be influenced b y action of the fire brigade, the fire will be controlled either by the surface area of the materials that can participate in the burning or by the rate of air supply through the opening^.^
Whether the fire will be largely controlled by surface area or ven- tilation depends on t h e amount of combustible contents. Unless its quantity, surface area and arrangement are controlled, or the size of the windows and floor area made such t h a t the possibility of a ventilation- controlled fire becomes remote, 6 * the type of fire that may occur is un- predictable. According t o statistical data, combustible contents of 10 t o 60 kg per m2 of floor area are normal, and there is a considerable probability of enclosures having a combustible content of 40 t o 100 kg/m2.4 I t is probable that in the latter range, a s confilmed by experiments," the fire will be mainly ventilation controlled, even when large window openings are present. I t is likely t h a t the greater the space behind the windows, or t o a certain extent, the deeper the enclosure, the more material or surface area i t wiU contain and therefore the greater will be the probability of a ventilation-controlled fire. Usually a ventilation-controlled fire is t h e more severe fire, and because of the substantial probability of its occurrence, it
is appropriate to base fire resistance requirements for buildings on the assumption that fire severities will be controlled b y ventilation.
C H A R A C T E R I S T I C F I R E T E M P E R A T U R E C U R V E S
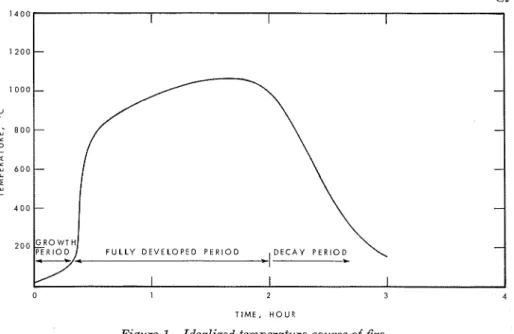
The temperature course of a fire can, in general, be divided into a growth period, a fully developed period and a decay period (Figure 1). During the growth period the temperatures in the enclosure are relatively low and their influence on the fire resistance of building components is negligible. I n fire resistance studies, therefore, t h e growth period can be disregarded. Actual risk of failure of structural elements or fire separations begins when the fire reaches the fully developed stage. This risk also exists in the decay period.
There are several reports which present the temperature course of fires in fully developed and decay periods.lP 2 t 7 r 9 , l o I n all of these studies a
procedure is followed in which the fire temperatures are determined by solving a heat balance for the enclosure under consideration.
For the fully developed period and ventilation-controlled fires, there is reasonable agreement in the temperatures found in the various studies, except for rather shallow rooms of limited size. I n the latter case, th2 amount of combustible gases that burn outside may increase in such a way with increasing ventilation that the temperature decrea~es.~
There is less agreement in the results of the various studies for the decay period due, partly, to the complexity of t h e processes t h a t deter-
TIME, H O U R
Figure 1. Idealized temperature course of fire.
mine the temperature in that period. So far, rates of decay of temperature could only be established empirically or by making conservative or highly idealized assumptions. Because of the different approaches in deriving the rates of decay, there is a rather wide spread in the results of the various studies. Fortunately the influence of temperature variation in the decay period on the maximum temperatures reached in building components is relatively small.ll For the purpose of deriving a temperature-time curve that, with reasonable probability, will not be exceeded during the lifetime of the building, it will be sufficient to use a curve that only approximately reflects the effect of heating in the decay period. This is further explained in Figure 2.
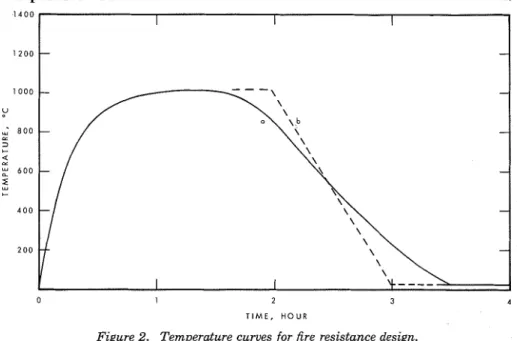
Curve a illustrates a fire temperature curve derived theoretically for a certain building. The probability of occurrence of a fire with a more severe effect than shown by the curve is once in 50 years. Curve b il-
lustrates a fire temperature curve for the same building, but it is assumed that the rate of burning remains constant until all combustible materials are consumed, whereupon the fire temperature drops linearly to room temperature. Although curve b differs in shape from curve a, their heating effect is approximately the same. If curve b is used instead of curve a the probability of occurrence of a more severe fire than that represented by the relevant curve may change somewhat, for instance, from once in fifty years to a few years more or less. In practice this means that virtually the same fire safety will be provided whether curve a or curve b is used for the fire-resistance design of a building.
The use of curve b instead of curve a has the advantage that it is easier to define. Therefore in the present study, curves of the b type will be
Temperature Curves
1 4 0 0
0 I 2 3 4
T I M E , HOUR
Figure 2. Temperature curves for fire resistance design.
chosen to characterize the fire severity of ventilation-controlled fires in the fully developed and decay periods.
E X P R E S S I O N S F O R
C H A R A C T E R I S T I C T E M P E R A T U R E C U R V E S
I t is intended to derive analytical expressions that describe character- istic temperature curves as a function of the significant parameters for various fire conditions commonly met with in practice. For the fully developed period, the derivation of these curves will be based on the tem- perature curves for ventilation-controlled fires calculated according to the method described by Kawagoe and Sekine.l
The temperatures attained in ventilation-controlled fires are described (in addition to the thermal properties of the material bounding the en- closure) by a parameter, known as the opening factor F:
F = A (H)
+*
AT
where A is area of the openings in the enclosure, H is height of the openings, and AT is area of the bounding surfaces (walls and floor and ceiling).
The rate of burning, R, of the combustible materials in the enclosure is given by
R = 330 A(H)* (2)
* The method of calculating A ( H ) i for openings of unequal height is described in References 9 and 11. See list of nomenclature on page 325.
and thus, if Q is the fire load per unit area of the surfaces bounding the en- closure, the duration of the fire T is determined by
T = &AT - - -
Q
330 A (H) : 330FFor given thermal properties of the material bounding the enclosure, the heat balance can be solved for the temperature as a function of the opening factor F. Besides depending on F, the temperature course is also a function of the thermal properties of the material bounding the en- closure. Except for large variations of the thermal properties, however, their influence is relatively small and can easily be offset by several un- certain factors, such as the presence of a few pieces of furniture. For practical purposes, therefore, it is not warranted to differentiate between the effects of small variations in the thermal properties of the bounding material.
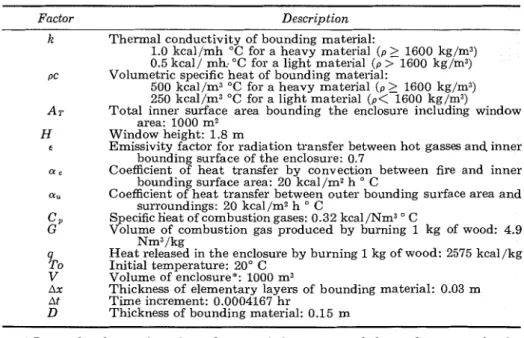
In this study, two materials have been chosen as representative bound- ing materials - one with thermal properties resembling those of a heavy material (high heat capacity and conductivity) and one representing those of a light material (low heat capacity and conductivity). The thermal properties of these materials are given in Table 1. In practice, materials with a density of approximately 1600 kg/m3 or more, e.g., normal weight concretes, sand lime brick and most clay bricks, can be considered as belonging to the group of heavy materials. Those with a density of less
TABLE 1. Information on the Enclosure
Factor Description
Thermal conductivity of bounding material:
1.0 kcal/mh "C for a heavy material ( p 2 1600 kg/m3) 0.5 kcall m h "C for a light material ( p > 1600 kg/m3)
Volumetric specific heat of bounding material:
500 kcal/m3 "C for a heavy material (p >_ 1600 kg/m3) 250 kcal/m3 "C for a light material ( p < 1600 kg/m3) Total inner surface area bounding the enclosure including window
area: 1000 m2 Window height: 1.8 m
Emissivity factor for radiation transfer between hot gasses and, inner bounding surface of the enclosure: 0.7
Coefficient of heat transfer by convectitn between fire and inner bounding surface area: 20 kcal/mz h C
Coefficient of heat transfer between outer bounding surface area and surroundings: 20 kcal/m2 h " C
Specific lieat of combustion gases: 0.32 kcal/Nm3 " C
Volume of combustion gas produced by burning 1 kg of wood: 4.9 Nm3/kg
Heat released in t h e enclosure by burning 1 kg of wood: 2575 kcal/kg Initial temperature: 20" C
Volume of enclosure": 1000 m3
Thickness of elementary layers of bounding material: 0.03 m Time increment: 0.0004167 hr
Thickness of bounding material: 0.15 m
* I t can be shown that the influence of the volume of the enclosure on the fire temperature is negligible.
Temperature Curves 321 than 1600 kg/m3, e.g., lightweight and cellular concretes and plasterboard, can be regarded as belonging to the group of light materials.
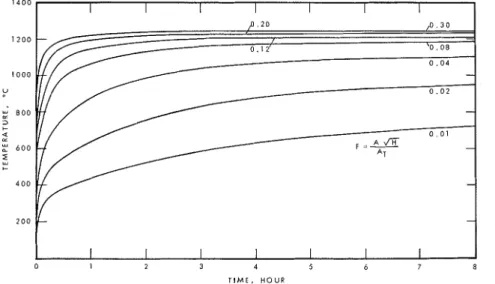
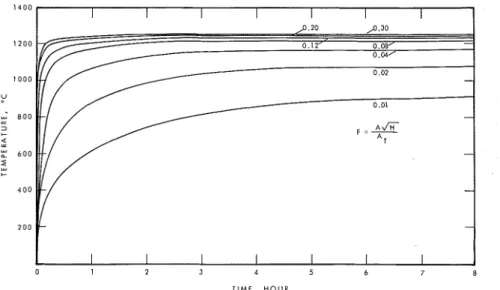
Using the method described in Reference 11, the temperature course of fires in enclosures has been calculated for the two chosen bounding materials and for various values of the opening factor. The conditions for which the calculations have been performed are shown in Table 1 and the results of the calculations in Figures 3 and 4.
The curves in these figures will be used as a basis for the derivation of temperature curves for fire resistance design. I t is intended to derive an analytical expression that approximately describes the curve for any value of the opening factor normally encountered in practice. By preference, the expression should have the form of a sum of exponential functions because, when it is used as a boundary condition in heat flow calculations, the heat transfer equations are integrable.12
I t was found that the temperature curves given in the Figures 3 and 4 could be reasonably described by the expression
where T = the fire temperature, t = time, and C = a constant taking into account the influence of the properties of the boundary material on the temperature. C = 0 for heavy materials ( p >_ 1600 kg/m3), and C = 1 for light materials ( p
<
1600 kg/m3).TIME, HOUR
Figure 3. Temperature-time curves for ventilation-controlled fires i n enclosures bounded by dominantly heavy materials (p 2 1600 k g / m 3 ) , calculated for various opening factors by solvzng a heat balance for the enclosure.
1 4 0 0 I 2 0 0 I 0 0 0 U ; s o 0 3
-
2 6 0 0 ? 4 0 0f
TIME, H O U RFigure 4. Temperature-time curves for ventilation-controlled fires i n enclosures bounded by dominantly light materials (p <I600 kg/m3), calculated for various opening factors by solving a heat balance for the enclosure.
The expression is valid for
0 08 t < - - + I
F (5)
and
0.01
<
F<
0.15If t
>
0.08/F+
1, a value o f t = 0.08/F+
1 should be used. If F>
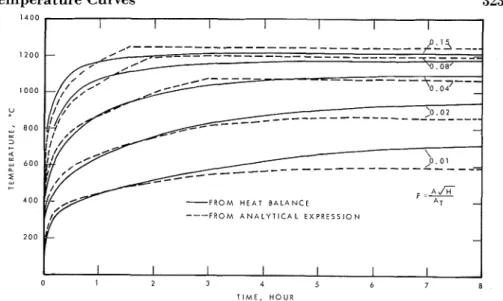
0.15, a value of F = 0.15 should be used.The temperature-time curves, evaluated from Equation 4 and those obtained by solving the heat balance for the enclosure are shown in Figures 5 and 6 for various values of the opening factor.
It is seen that with the aid of the analytical expression temperature curves can be developed that reasonably describe the curves derived from solving the heat balance.
As discussed previously the temperatures in the decay period are more difficult to calculate due to the complexity of the processes t h a t determine the temperature in this period. On the other hand, if t h e temperature variations are not very large, the influence of such variations in the decay period on the temperature attained in exposed building com- ponents are in general relatively small. Therefore, describing the tem- perature course in the decay period by a temperature-time relation that approximately reflects the decrease of temperature in this period is suf- ficient.
According to experimental data of Kawagoe8 the rate of decrease of a fire with a fully developed period of less than one hour is roughly 10" C per minute and that of a fire with a fully developed period of more than one
Temperature Curves 323 1 4 0 0 1 2 0 0 1 0 0 0 U ; a 0 0 = 3 + Q "00 L
z
4 0 0 F R O M H E A T B A L A N C E F R O M A N A L Y T I C A L E X P R E S S I O N 2 0 0 0 1 2 3 4 5 6 7 T I M E , H O U RFigure 5. Comparison between temperature-time curves obtained by solving a heat balance and those described by an analytical expression for ventilation-controlled fires i n enclosures bounded by dominantly heavy materials (p 2 1600 kg/m3).
hour is 7" C per minute. The Swedish code assumes a rate of decrease of 10" C per minute irrespective of the duration of the fully developed period of the fire." comparison with semi-empirical data developed by Magnusson and Thelandersson~hows that the assumption of a rate of decrease of 10" C per minute is too fast for fires of long duration and too slow for fires of short duration. According to Harmathy,' who studied several experimental fires of relatively short duration,13, l4 the rate of de-
crease of temperature for such fires is in the order of 15 to 20" C per minute.
1 4 0 0 I I I I / - - - I - ,o,?
-!
- - - - ! ~ L L - - ,' / - - - - - - - - - - - - - - - - - - -_ _ _ _ _ -
- - -- _ _ _ _ _ _ _
'0.02/ - ' o . o l , _ _ _ _ _ - - - - F.&E A T - - F R O M H E A T B A L A N C E - ---- F R O M A N A L Y T I C A L E X P R E S S I O N - 1 2 3 4 5 6 7 a T I M E , H O U RFigure 6. Comparison between temperature-time curves obtained by solving a heat balance and those described by a n analytical expression for ventilation-controlled fires i n enclosures bounded by dominantly light materials (p< 1600 k g / m 3 ) .
In general, the longer the duration of the fully developed period the lower the rate of decrease of temperature. Using this information the following expressions have been derived for the temperature course of fire in the decay period:
T = -600
(:
- - 11
+
TT(7)
with the condition
T = 20 if T
<
20 (8)In the above equations T = fire temperature, T = time a t which the decay starts as given by Equation 3, t = time under consideration (t
>
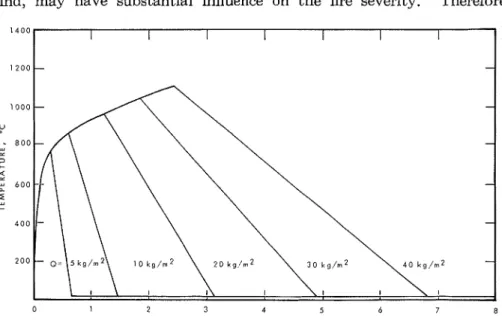
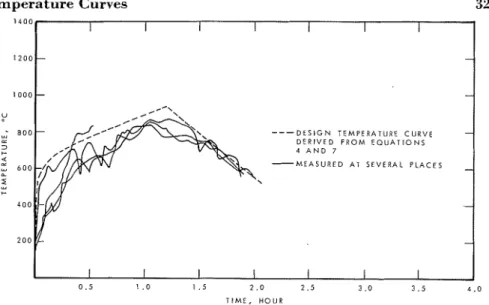
T), and T T = temperature given by Equation 4 a t the time t = T.The temperature curves obtained from Equations 4 and 7 are illustrated in Figure 7 for various fire loads and an opening factor of 0.05. In Figure 8 these curves are compared with the temperatures measured at several places in a room during an experimental fire.' I t is seen t h a t the curve developed from the analytical expression reasonably characterizes the temperatures obtained during the experimental fire. I t is somewhat conservative but satisfactory .to use as a design curve for fire resistance.
C O N C L U S I O N
Expressions are derived that describe characteristic fire temperature curves for various fire severities.
Many factors that usually cannot be controlled in practice, such as amount, surface area and arrangement of fire load, and occurrence of wind, may have substantial influence on the fire severity. Therefore
0 I 2 3 4 5 6 7 8
TIME, HOUR
Figure 7. Characteristic temperature curves for various fire loads Q (opening factor F
Temperature Curves 325
1 4 0 0
1 2 0 0
1 0 0 0
V
; SO0 D E S I G N TEMPERATURE CURVE
w D E R I V E D F R O M E O U A T I O N S 3 +- 4 A N D 7 4 "00 M E A S U R E D AT SEVERAL P L A C E S & 2 4 0 0 2 0 0 0 . 5 1 .O I . j 2 . 0 2 . 5 3 .O 3 . 5 4 .O T I M E , HOlJR
Figure 8. Comparison of design temperature curve derived from analytical expressions with temperatures measured during an experimental fire (fire load per unit internal area of the bounding surfaces Q = 18.75 kglm3, opening factor F = 0.0472, heavy bounding material).
curves are chosen that reflect fire temperatures reached under unfavorable conditions, i.e., in ventilation-controlled fires. The use of these curves as basic exposure curves for fire-resistive design will reasonably assure that building components will not be exposed t o temperatures higher than those represented by the curves during the life of the building.
The expressions are intended to fill the need for well defined tem- perature-time relations that characterize the severity of fires t h a t com- monly occur. With the aid of these expressions, prediction of the fire resistance of building components exposed to fire of any severity will be simpued. They will also make i t possible to convert fire resistances for standard fire conditions to those for any other fire severity.
NOMENCLATURE
A = area of the openings in the enclosure, m2
AT = area of the internal bounding surfaces, m2
C = constant
F
= opening factor, m 4H = height of openings in the enclosure, m
Q = fire load per unit area of the internal bounding surfaces, kg/m2
R
= rate of burning, kg/hr T = fire temperature, CTT = fire temperature a t the time T, O C
t = time, hr
R E F E R E N C E S
1 K;wagoe, K., and Sekine, T., "Estimation of Fire Temperature-Time Curve in
Rooms, B. R. I. Occasional Report No. 11, Building Research Institute, Ministry of Construction, Tokyo (1963).
2 odeen, K., "Theoretical Study of Fire Characteristics in Enclosed Spaces,"
Bulletin 10, Division of Building Construction, Royal Institute of Technology, Stock- holm (1963).
3 Thomas, P. H., and Heselden, A. J. M., "Fully-Developed Fires in Single Com-
partments," Fire Research Note No. 923, Building Research Establishment, Fire Research Station, Borehamwood (1972).
4 Lie, T. T., Fire and Buildings, Applied Science Publishers Limited, London
(1972), pp. 19-22.
6 Thomas, P. H., Heselden, A. J. M., and Law, M., "Fully-Developed Compart-
ment Fires; Two Kinds of Behaviour," Fire Research Technical Paper No. 18, H. M.
Stationery Office, London (1967).
G Lie, T . T., Fire and Buildings, Applied Science Publishers Ltd., London (1972),
pp. 9-11.
7 Harmathy, T . Z., "A New Look a t Compartment Fires, Part I and Part 11," Fire Technology, Vol. 8, Nos. 3 and 4 (1972).
8 Kawagoe, K., "Fire Behaviour in Rooms," Building Research Institute, Ministry
of Construction, Report No. 27, Tokyo (1958).
Wagnusson, S. E., and Thelandersson, S., "Temperature-Time Cuives of Com- plete Process of Fire Development. Theoretical Study of Wood Fuel Fires in En- closed Spaces," Acta Polytechnica Scandinavica, Civil Engineering and Building Construction Series No. 65, Stockholm (1970).
10 Tsuchiya, Y., and Sumi K., "Computation of t h e Behaviour of Fire in an E n -
closure," Combustion and Flame, Vol. 16 (1971), p. 131.
fl Kawagoe, K., "Estimation of Fire Temperature-Time Curve in Rooms," Building Research Institute, Japan, Research Paper No. 29 (1967).
12 Lie, T . T., "Bekledingsmaterialen en Bouwconstructies by Brand," Heron, No.
2 (1965), pp. 57-81.
13 Butcher, E . G., Chitty, T. B., and Ashton, L. A., "The Temperature Attained
by Steel in Building Fires," Fire Research Technical Paper No. 15, H. M. Stationery Office, London (1966).
14 Butcher, E. G., Bedford, G. K., and Fardell, P. J., "Further Experiments on
Temperatures Reached by Steel in Buildings," Symposium No. 2, Behauiour of Structural Steel i n Fire, Paper No. 1, H. M. Majesty's Stationery Office, London (1968).
---
NOTE: This paper is a contribution from the Division of Building Research, Na- tional Research Council of Canada, and is published with the approval of the Director of the Division.
This publication is being distributed by the Division of
Building Research of the National Research Council of Canada. I t should not be reproduced in whole or in part without permission of the original publisher. The Division would be glad to be of assistance in obtaining such permission. Publications of the Division may be obtained by mailing the appropriate remittance (a Bank, Express, or Post Office Money Order, or a cheque, made payable to the Receiver General of Canada, credit NRC) to the National Research Council of Canada, Ottawa. KIA 0R6. Stamps are not ac- ceptable.
A list of all publications of the Division is available and may be obtained from the Publications Section, Division of Build- ing Research, National Research Council of Canada, Ottawa.