Publisher’s version / Version de l'éditeur:
ECS Transactions, 33, 1, pp. 1355-1364, 2010-10-15
READ THESE TERMS AND CONDITIONS CAREFULLY BEFORE USING THIS WEBSITE.
https://nrc-publications.canada.ca/eng/copyright
Vous avez des questions? Nous pouvons vous aider. Pour communiquer directement avec un auteur, consultez la
première page de la revue dans laquelle son article a été publié afin de trouver ses coordonnées. Si vous n’arrivez pas à les repérer, communiquez avec nous à PublicationsArchive-ArchivesPublications@nrc-cnrc.gc.ca.
Questions? Contact the NRC Publications Archive team at
PublicationsArchive-ArchivesPublications@nrc-cnrc.gc.ca. If you wish to email the authors directly, please see the first page of the publication for their contact information.
Archives des publications du CNRC
This publication could be one of several versions: author’s original, accepted manuscript or the publisher’s version. / La version de cette publication peut être l’une des suivantes : la version prépublication de l’auteur, la version acceptée du manuscrit ou la version de l’éditeur.
For the publisher’s version, please access the DOI link below./ Pour consulter la version de l’éditeur, utilisez le lien DOI ci-dessous.
https://doi.org/10.1149/1.3484627
Access and use of this website and the material on it are subject to the Terms and Conditions set forth at
Effects of water vapor proportion in generated water on performance of polymer electrolyte fuel cells under dry operating conditions
Zhang, Xu; Hu, Guilin; Wang, Qianpu; Song, Datong; Liu, Zhong-sheng
https://publications-cnrc.canada.ca/fra/droits
L’accès à ce site Web et l’utilisation de son contenu sont assujettis aux conditions présentées dans le site LISEZ CES CONDITIONS ATTENTIVEMENT AVANT D’UTILISER CE SITE WEB.
NRC Publications Record / Notice d'Archives des publications de CNRC:
https://nrc-publications.canada.ca/eng/view/object/?id=cd27ea54-a3a4-4691-ac6b-5774be884187 https://publications-cnrc.canada.ca/fra/voir/objet/?id=cd27ea54-a3a4-4691-ac6b-5774be884187
Effects of Water Vapor Proportion in Generated Water on Performance of Polymer Electrolyte Fuel Cells under Dry Operating Conditions
Xu Zhanga*, Guilin Hua,b, Qianpu Wanga Datong Songa and Zhong-sheng Liua
a
Institute for Fuel Cell Innovation, National Research Council Canada, 4250 Wesbrook Mall, Vancouver, BC, Canada, V6T 1W5
b
School of Light Industry, Zhejiang University of Science and Technology, Hangzhou, China, 210023
*Corresponding author. Tel: +1 604 221 3000 ext 5601; Fax: +1 604 221 3001 E-mail address: xu.zhang@nrc.gc.ca (X. Zhang)
A one-dimensional, non-isothermal, single-phase, steady-state model is developed for dry operating conditions to investigate the effects of different types of generated water as liquid or vapor in electrochemical reaction on the proton exchange membrane fuel cell (PEMFC) performance, A parameter (Γ) denoting vapor phase fraction in generated water is employed in the model. The agglomerate model with thin film was employed in catalyst layers. Water transport and its effects on cell performance were discussed under different operating conditions such as reactants relative humidity, vapor phase fraction and micro-porous layer thickness. The results indicated that the net water transport coefficients were positive under equal feeding gas humidity in both anode and cathode. At high current density, the more the proportion of water vapor in generated water is, the better cell performance is. However, at low current density, the effect of vapor phase proportion on cell performance is not very obvious.
1. Introduction
Proton exchange membrane fuel cell (PEMFC) is a promising candidate for power sources of portable equipment and vehicle for its advantage characteristics as high-energy conversion efficiency and fast startup under conventional temperature. However, high cost and low performance are still two main barriers to its large-scale commercialization. The appropriate water and heat management in the core component membrane electrode assembly (MEA) of PEMFC is significantly important to the performance optimization because either dry or flood in MEA will greatly affect cell performance, stability and durability of fuel cell.
During past two decades, many researchers were involved in developing different computational models for PEMFC [1-12]. The models were developed from simple to complex; from one-dimensional [1-3], two-dimensional [4-6] to three-dimensional [7-10]; from single-phase to two-phase; from macro-scale to meso-scale [11], and even micro-scale [12-13]. Water management of PEMFC plays an important role for operation and optimization of cell performance of PEMFC. Thus, many models focus on the water
management. Bernardi and Verbrugge [2] developed the hydraulic model with
assumptions that the membrane is fully hydrated with liquid water. However, this model is not suitable for a partially dry membrane. Yi [14] developed one model for interdigitated flow fields considering liquid water. However the liquid water flow induced by capillary forces and gas flow induced drag was addressed by semi-heuristic equations. Natarajan et
al [15] developed a pseudo-three-dimensional model by extending their two-dimensional
isothermal model. This model can be used to obtain qualitative insight into the distribution of liquid water in the backing layer. Janssen [16] developed a two-dimensional, phenomenological model based on concentrated solution theory to describe the transport of water in the membrane, and of water vapour and liquid water in the electrodes. Two-phase flow modeling in the porous air cathode of a PEMFC was attempted by Wang et al [17]. The transport coefficients in the stationary numerical two-phase model are parameterized as functions of the liquid water saturation. However, this model only considered the cathode half cell. Later, this model was further developed to include the whole cell by You et al [18]. Berning et al [7] developed a 3D, two-phase PEMFC model based on computational fluid dynamics multiphase. Transport of liquid water inside the gas-diffusion layers is modeled using viscous forces and capillary pressure terms. Shimpalee et al [19] developed a complete three-dimensional model, which treated the liquid water as component of the gas mixture. K. Steinkamp et al [20] presented
ECS Transactions, 33 (1) 1355-1364 (2010)
a 2-D dynamic two-phase flow model accounting for all important transport processes in a PEM fuel cell. Unfortunately, the computational cost for simulation was quite high because of the high complexity of the model. Siegal et al. [21] presented a 2-D model to account for the transport of liquid water in the electrode and treat all three forms of water as a separate phase and allow mass transport among them. Zhang [22] developed a model including three forms of water: dissolved water in the electrolyte or membrane, and liquid water and water vapour in the void space. A one-dimensional model of water transport across the entire cell is presented for the proton exchange membrane fuel cell [23]. In the model, the water vapor in the pore is coupled with liquid water in the ionomer phase by the isotherm sorption. A one-dimensional analytical solution of liquid water transport across the CCL is derived from the fundamental transport equations [24]. Based on a dimensionless time constants analysis, it has been shown that liquid water production from the phase change process is negligible compared to water production from the electrochemical process.
Among above modeling studies on water management, some researchers assumed that the generated water is in liquid form, some authors believed that water is generated in vapor form. Because it is almost impossible to detect which form the generated water is by current experimental technology, in this paper, we introduce a parameter, Γ, which is water vapor percentage to all of the generated water. By using our one-dimensional, non-isothermal MEA model, we investigate the effects of the proportion of water vapor in generated water on water transport and cell performance.
2. Model Description
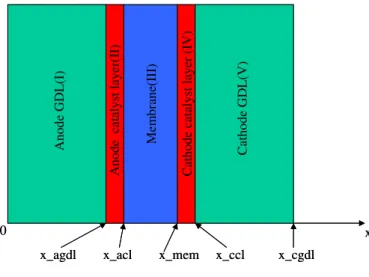
A one-dimensional, non-isothermal model of a MEA including five subdomains: gas diffusion layers and catalyst layers in both anode and cathode sides, and membrane in the middle is presented. The schematic of computation domain is showed in Figure 1.
x_agdl x_acl x_mem x_ccl x_cgdl
0 x C ath od e GD L(V) Cathode catalyst layer (IV) M e m b rane(I II) An od e cat aly st l ayer(I I) Ano d e GDL( I)
x_agdl x_acl x_mem x_ccl x_cgdl
0 x C ath od e GD L(V) Cathode catalyst layer (IV) M e m b rane(I II) An od e cat aly st l ayer(I I) Ano d e GDL( I)
Figure 1 Schematic of computation domain Following assumptions are considered during the model development:
(1) The PEM fuel cell operates under steady state.
(2) A one-dimensional approximation is used in the model formulation by neglecting the variation of reactant concentrations along flow channels.
(3) The porous media such as gas diffusion layers and catalyst layers are isotropic and homogeneous, characterized by effective permeability and uniform porosity. (4) Agglomerate model is employed in both anode and cathode catalyst layers. (5) The membrane is impermeable to gas species.
2.1 Model Equations
The general equation system after modifying the source/sink terms to reflect the corresponding physical phenomena in each subdomian is used in this model. The general governing equations of mass, momentum, energy, specie and charge transportation are described as follows.
2.1.1 Mass Conservation of Species in Gas Phase. Taking into account of electrochemical reaction, diffusion and convection, the mass conservation equations for reactive species are given as:
2 ) 2 ( ) 2 ( 2 O S O w eff D g O w u g g −∇⋅ O ∇ = ⋅ ∇ ρ ρ [1]
2 ) 2 ( ) 2 ( 2 H S H w eff D g H w u g g −∇⋅ H ∇ = ⋅ ∇ ρ ρ
[2] WP S WV w eff v D g WV w g u g −∇⋅ ∇ = ⋅ ∇ (ρ ) (ρ ) [3]
The summary of all the species is unit, so at cathode side
WV O N
w
w
w
=
−
−
2 21
[4]and the continuum equation can be written as
∑
= ⋅
∇(ρgu )g Sj [5] where
u
g is the superficial velocity of gas phase.S
j is the source/sink term for each gas species. For the small permeability in the porous diffusion and catalyst layers, the inertia and viscous terms is so small comparing with source term caused by friction between gas and solid, Darcy’s equation can be employed to describe the gas velocitydx g dp g i K g u µ − = [6] where K is the absolute permeability of subdomain i , i µg is the dynamic viscosities of gas phase, and p is the partial pressure of gas phase. g
Source terms 2 O S , 2 H S andSHO
2 are the consumption of species O2 and H2, and the production of H2O, which are related to the cathode and anode electrochemical reaction
rates according to Faraday’s law. The gas species source terms can be written as following, ⎪ ⎪ ⎪ ⎩ ⎪ ⎪ ⎪ ⎨ ⎧ + Γ − − = cathode at O H for R 2 O for R 4 H for R 2 2 c 2 c 2 2 a 2 e/c W O H j S M M M S [7]
where Se/c is the source/sink for water vapor coming from evaporation or condensation. We assumed that Γ parts of water is produced in vapor form, (1-Γ) parts of water is produced in liquid form. Because the catalyst layer of PEM fuel cell is a hydrophilic material, liquid water will first fill the small pores and then the big pores. We assumed that the generated liquid water will stay at the small pores in the cathode catalyst layer and evaporate or condensate according to the local pressure conditions. Gas transport mostly goes through the big pores in the catalyst layer. Therefore, the small pores blocked by liquid water will not affect the mass transport significantly in the cathode catalyst layer.
R and c R in Eq. [7] are the reaction rates of ORR and (hydrogen oxidation reaction) a HOR, and given by Bulter-Volmer law as,
) ( ) ( ref, N,k F /RT F /RT j s e j ref j k k k c k a e e C C F i a R = ε α η − −α η [8]
where j=O2 andk =c or j=H2 and k=a . iOref2 and ref H i
2 are the cathode and anode exchange current densities. COref2 and
ref H C
2 are the oxygen and hydrogen reference
concentrations, αc and αa are the cathodic and anodic transfer coefficients,
R
is the universal gas constant, ηc and ηa are the surface overpotentials for the cathode and anode sides, respectively. COs2,e ands e H C ,
2 are oxygen and hydrogen concentrations at the surface of agglomerates, which depends on the bulk values (CO2,e,CH2,e) according to Henry’s law, 2 2 2 2 2 2,e O O , H,e H H O H C C H C C = = [9]
2.1.2 Energy Conservation Equation. The local thermal equilibrium between phases: gas phase and solid phase is assumed, i.e. Tg=Ts=T. The conversation equation can be
described as follows
Q
T
u
c
dx
d
dx
dT
k
dx
d
g g p g eff i+
=
−
(
)
(
ρ
)
[10]where
k
ieff stands for the effective thermal conductivity of subdomains i ,Q
is the sum of the volumetric heat source/sink, including Ohmic heat, irreversible electrochemical reaction heat, entropic reaction heat.⎪ ⎪ ⎩ ⎪⎪ ⎨ ⎧ + + + = Membrane GDLs CLs e ohm c ohm reaction entropic c ohm e ohm Q Q Q Q Q Q Q [11]
Each heat source/sink term in detail can be found in literature [22].
2.1.3 Electronic and Ionic Charge Transfers. The electrons and protons can transport inside carbon phase and membrane phase respectively, the conservation equations as
i s c c
S
cdx
d
dx
d
, 7 . 1)
(
ε
σ
φ
=
φ−
[12] i e e N S e dx d dx d , 7 . 1 ) (ε
σ
φ
= φ − [13] where φc is the electronic potential in carbon phase, φe is the protonic potential in electrolyte or membrane phase, σc and σeare the electron and proton conductivities,ε
c is the volume fraction of carbon phase andε
N is the volume fraction of Nafion. In the diffusion layers, just electron transport, and proton just transport inside membrane, but electron and proton can transport inside the catalyst.c
Sφ and
e
Sφ are the source/sink terms of electron and proton in the anode and cathode catalyst layer respectively, can be easily written as ⎩ ⎨ ⎧ − = cathode At , anode At , c a FR FR S e φ [14] ⎩ ⎨ ⎧ − = cathode At , anode At , c a FR FR S c φ [15] 2.2 Constitutive Relations
Bruggeman relation is used here to estimate the effective diffusion coefficients of gas species in porous media, respectively.
O H N H O j D D i j eff j 2 2 2 2 5 . 1 and , , ∈ =ε [16]
where the bulk diffusivities are in relation to temperature and pressure. The absolute permeability can be approximated by Kozeny-Carman law,
subdomains
different
)
1
(
16
2 3 2∈
−
=
i
k
d
K
i K i i iε
ε
[17] Wherek
K is a Kozeny-Carman constant,d
i is the mean pore diameter of subdomaini
. The membrane conductivity is highly dependent on the water uptake of the membrane and given by Springer et al [1] as,) 326 . 0 514 . 0 ( ) 1 303 1 ( 1268 exp − ⎥⎦ ⎤ ⎢⎣ ⎡ − = λ σ T e [18] e N eff e ε σ σ 1.5 = [19] The relation between water content at membrane surface and water vapor activity can be described by experiential equation as:
(
)
⎪ ⎪ ⎩ ⎪ ⎪ ⎨ ⎧ ≥ ≤ ≤ − + < < + − + = existence water liquid , 22 3 16.8, 3 1 , 1 4 . 1 14 1 0 , 0 . 36 85 . 39 81 . 17 043 . 0 2 3 a a a a a a a λ [20]where a stands for the water vapor activity at the membrane surface, sat p p X a= w [22] and log10 psat =−2.1794+0.02953T −9.1837×10⁻⁵T2+1.4454×10⁻⁷T3 [23]
The density of gas mixture can be expressed as,
RT
W
X
p
j k j k j k g k g∑
=
ρ
[24] where k jX is the mole fraction for each species. The dynamic viscosities of gas mixture are
∑
∑
=
j j k j j j j k j k gW
X
W
X
µ
µ
[25] when k =c,then j=O2,N2,andH2O , or when k =a,then j=H2,andH2O .2.3 Boundary Conditions
Von Neumann boundary condition is applied to membrane phase potential for all boundaries of the computational domain equation, i.e. zero flux at the interfaces between
GDLs and CLs: ∂ ∂ =0
n
e
φ . Similarly, membrane is not an electron conducting material;
the fluxes of electrons at the interfaces between the CLs and membrane are zero.
The thermal boundary conditions of interfaces between channels and diffusion layers of both the cathode and anode are considered in the fixed temperature conditions, i.e., the temperature on these surfaces equals to the cell temperature.
At the interfaces between diffusion layers and channels, a given value of species concentration is set as boundary. Of course, this value is set according to the average of channel inlet and outlet value. At interfaces of CLs and membrane, because of water transport through the membrane, the boundary conditions of water vapor concentration and gas phase pressure are as follows:
at the interface of membrane and cathode catalyst layer,
O H V eff v g V g g M F I dx dw D w u ρ β 2 ρ ⎥⎦⎤= ⎢⎣ ⎡ − − [26] O H g g th g M F I dx dp K 2 β µ ρ ⎟⎟= ⎠ ⎞ ⎜⎜ ⎝ ⎛ − [27]
at the interface of membrane and anode catalyst layer, O H g g th g M F I dx dp K 2 β µ ρ ⎟⎟=− ⎠ ⎞ ⎜⎜ ⎝ ⎛ − [28]
where β is the net water transport coefficient which implies the net flux of water transported from anode to cathode per flux of proton.
3. Results and Discussion
The model equations with boundary conditions described above are solved by COMSOL 3.4. The simulation is done by decreasing cell voltage from open circuit potential U0 until the vapor partial pressure is larger than the saturation pressure of water
vapor. A set of parameter value used in this simulation can be found in [22]. A parametric study regarding the effects of relative humidity, water vapor proportion in generated water and the thickness of micro-porous layer on cell performance is discussed in the followings.
3.1 Effect of water vapor proportion Γ in generated water,
In this paper, a parameter, Γ, is introduced to account for the water vapor percentage
Cell Voltage (V )
to all of the generated water at the cathode catalyst layer. If all of the generated water is in liquid form, Γ=0; if all of the generated water is in vapor form, Γ=1. We also defined β is the net water transport coefficient, which implies the net flux of water transported from anode to cathode
N
H2O per proton fluxN
H+ ,+
=
H O HN
N
2β
. Two mechanisms areconsidered here regarding the water transport through the membrane: one is diffusion due Figure 2 The effect of Γ on the net water transport coefficient versus at RH=0.5
Figure 3 The effect of Γ on cell performance at RH=0.5 Current density (A/cm2)
Net water tr
ansport co
ef
ficient
β
to water concentration gradient across the membrane; another is electro-osmotic drag due to proton flux. According to the sign of β values, we can tell the direction of net water transport through the membrane.
When Γ increases from 0 to 1, at the same current density, much more water is in vapor form. It will increase the concentration of water vapor at the cathode side. Increased water vapor concentration will enhance water to diffuse back to the anode side. Therefore, β decreases as shown in Figure 2. The smaller value of β results in anode side hydrated and higher proton conductivities. Figure 3 conforms that at high current density, the case of Γ=1 has the best cell performance compared to other cases of Γ<1
3.2 Effect of relative humidity
In order to investigate the effect of relative humidity on cell performance,
we assume that the relative humidities on both sides of the anode and
cathode are always same and generated water is in vapor phase (
Γ
=1).
Relative humidities have a significant impact on the water transport. Figure 4 and Figure 5 show the variation of net water transport coefficient, β, along with current density and the polarization curve for different relative humidities, respectively. As shown in Figure 4, the values of β are positive. It means that water transport is always from anode side to cathode side. The bigger the positive value of β is, the easier the membrane gets dehydrated. Except for RH=0.3, at the same current density, β decreases as relative humidity increases. Therefore, increasing relative humidity can improve cell performance as shown in Figure 5. Although the values of β for RH=0.3 is smaller than the value of β for RH=0.5 and RH=0.7, because the proton conductivities for RH=0.3 is much lower than that for RH=0.5 and RH=0.7, cell performance for RH=0.3 is still the lowest one.
Figure 4
Value of β versus current density for different relative humidities.Current density (A/cm2)
Net water transport co
efficient,
β
3.3Effect of the thickness of MPL
Many researchers have used several different design approaches to get the better-performing PEM fuel cells. Adding a hydrophobic-rich micro-porous layer (MPL) with fine pores is one of the approaches. In the following part, we will discuss the effects of the thickness of MPL on water transport and cell performance.
Figure 5 Polarization curves for different relative humidities
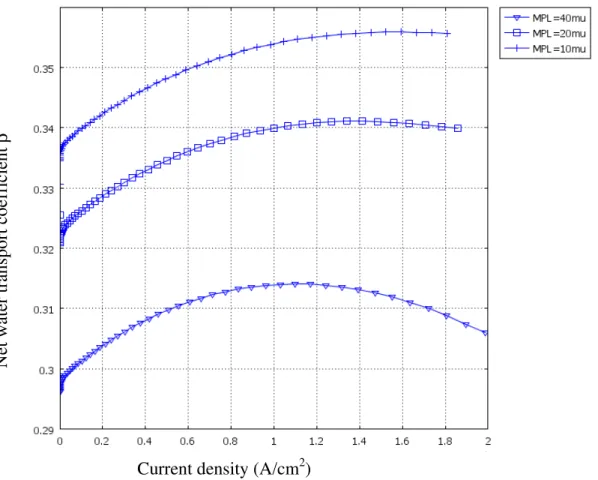
Figure 6 The value of β versus current density for different thicknesses of MPLs at RH=0.5, Γ=1
Current density (A/cm2)
Cell voltage (V)
Current density (A/cm2)
Net water transport co
efficient
Cell Voltage
(V)
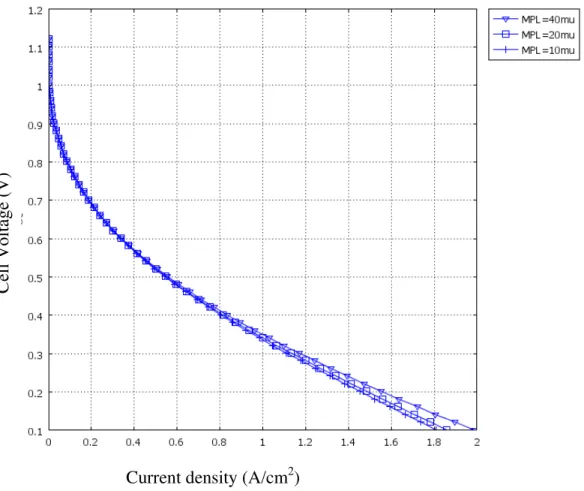
Figure 6 and Figure 7 show that the net water transport coefficient, β, versus current density and polarization curves for different thickness of MPLs at RH=0.5, Γ=1, respectively. It is clearly shown that adding an MPL can significantly improve water transport. Because a MPL has lower diffusivity, it is harder for water vapor to escape from the catalyst layer to the channels. As a result, the thicker MPL can enhance back diffusion and the value of β is lower. At the same time, cell performance should be improved. However, the lower diffusivity will impede oxygen to reach to the catalyst layer. Eventually, cell performance is improved slightly for the thicker MPL as shown in Figure 7.
4. Conclusions
A one-dimensional, non-isothermal, single-phase, steady-state model for the proton exchange membrane fuel cell (PEMFC) is developed for dry operating conditions in this paper. The effects of the proportion of water vapor in generated water on water transport and cell performance were investigated using a parameter (Γ) which is vapor phase fraction in the generated water. Water transport and its effects on cell performance were discussed under different operating conditions such as reactants relative humidity, vapor phase fraction and micro-porous layer thickness. The results indicate that the value of the net water transport coefficient is positive when relative humidities of feeding reactants at both anode side and cathode are equal. When the proportion of water vapor in generated water was increased from zero to one, the net water transport coefficient decreased at the same current density. Lower and positive net water transport coefficient indicates that much more water diffused back to the anode side. Under dry operating conditions, the more the proportion of water vapor in generated water is, the better cell performance is at high current density. However, at low current density, the effect of vapor phase proportion on cell performance is not very obvious.
References
1. T. E. Springer, T. A. Zawodinski, and S. Gottesfeld, J. Electrochem. Soc., 138, 2334 (1991).
2. D. M. Bernardi and M. W. Verbrugge, J. Electrochem. Soc., 139, 2477(1992).
3. M. Eikerling, A. A. Kornyshev, Y. Kharkats and Y. Volfkovich, J. Electrochem. Soc.,
145, 2684(1998).
4. T. F. Fuller and J. Newman, J. Electrochem. Soc., 140, 1218 (1993). 5. D. Singh, D. M. Lu and N. Djilali, Int. J. Eng. Sci., 37, 431(1999). Figure 7 Polarization curve for different thicknesses of MPL at RH=0.5, Γ=1
Current density (A/cm2)
6. A. Kazim, H. T. Liu and P. Forges, J. Appl. Electrochem., 29, 1409(1999). 7. T. Berning, D. M. Lu and N. Djilali, J. Power Sources, 106, 284(2002).
8. S. Dutta, S. Shimpalee and J. W. Van Zee, J. Appl. Electrochem., 30, 135(2000). 9. G. L. Hu, J. R. Fan, S. Chen, Y. J. Liu and K. F. Cen, J. Power Sources, 136, 1(2004). 10. H. Meng and C. Y. Wang, J. Electrochem. Soc., 151, A358 (2004).
11. S. Mukherjee, J. Vernon Cole, K. Jain, and A. Gidwani, in Engineering and
Technology Conference FuelCell/2009, P. 85182, Proceedings of ASME 2009
Seventh International Fuel Cell Science, Newport Beach, California (2009).
12. E. Kim, P. F. Weck, N. Balakrishnan and C. Bae, J. Phys. Chem. B, 112 (11), 3283 (2008).
13. P. P. Mukherjee and C. Y. Wang, J. Electrochem. Soc., 153(5), A840 (2006). 14. J. S. Yi and T. V. Nguyen, J. Electrochem. Soc., 146, 38(1999).
15. D. Natarajan and T. V. Nguyen, J. power sources, 115, 66 (2003). 16. G. J. M. Janssen, J Electrochem. Soc., 148, A1313 (2001).
17. Z. H. Wang, C. Y. Wang and K. S. Chen, J. Power Sources, 94, 40(2001). 18. L. You and H. Liu, Int. J. Heat and Mass Transfer, 45, 2277(2002).
19. S. Shimpalee and S. Dutta, Numerical Heat Transfer, Part A, 8, 111(2003).
20. K. Steinkamp, J. O. Schumacher, F. Goldsmith, M. Ohlberger and C. Ziegler, J Fuel
Cell Science and Technology, 5, 011007(2008).
21. N. P. Siegel, M. W. Ellis, D. J. Nelson and M. R. von Spakovsky, J Power Sources,
128(2), 173(2004).
22. X. Zhang, D. Song, Q. Wang, C. Huang, Z.-S. Liu, J fuel cell science and technology,
7, 021009-1(2010).
23. J. Liu, N. Oshima, E. Kurihara, and L. Saha, in Engineering and Technology
Conference FuelCell/2009, P. 85061, Proceedings of ASME 2009 Seventh
International Fuel Cell Science, Newport Beach, California (2009).
24. Prodip K. Das, Xianguo Li, and Zhong-Sheng Liu, in Engineering and Technology
Conference FuelCell/2009, P. 85189, Proceedings of ASME 2009 Seventh