HAL Id: hal-01535340
https://hal.archives-ouvertes.fr/hal-01535340
Submitted on 11 Jul 2017HAL is a multi-disciplinary open access
archive for the deposit and dissemination of sci-entific research documents, whether they are pub-lished or not. The documents may come from teaching and research institutions in France or abroad, or from public or private research centers.
L’archive ouverte pluridisciplinaire HAL, est destinée au dépôt et à la diffusion de documents scientifiques de niveau recherche, publiés ou non, émanant des établissements d’enseignement et de recherche français ou étrangers, des laboratoires publics ou privés.
Comment on new mathematical model for interpreting
pH-Stat digestion profiles: impact of lipid droplet
characteristics on in vitro digestibility
Sebastien Gaucel, Ioan-Cristian Trelea, Steven Le Feunteun
To cite this version:
Sebastien Gaucel, Ioan-Cristian Trelea, Steven Le Feunteun. Comment on new mathematical model for interpreting pH-Stat digestion profiles: impact of lipid droplet characteristics on in vitro digestibility. Journal of Agricultural and Food Chemistry, American Chemical Society, 2015, 63 (47), pp.10352-10353. �10.1021/acs.jafc.5b03573�. �hal-01535340�
Correction to New Mathematical Model for Interpreting pH-Stat Digestion
Profiles: Impact of Lipid Droplet Characteristics on in Vitro Digestibility
Sebastien Gaucel
1,2, Ioan Cristian Trelea
1,2, Steven Le Feunteun
1,2, Yan Li
3,4and David Julian McClements
5J. Agric. Food Chem. 2010, 58, 8085-8092. DOI: 10.1021/jf101325m
1 INRA, UMR782, Génie et Microbiologie des Procédés Alimentaires, F-78850 Thiverval-Grignon 2 AgroParisTech, UMR782, Génie et Microbiologie des Procédés Alimentaires, F-78850
Thiverval-Grignon
3 Huazhong Agricultural University, Coll Food Sci & Technol, Wuhan 430070, Peoples R China
4 Huazhong Agricultural University, Minist Educ, Key Lab Environm Correlat Dietol, Wuhan 430070,
Peoples R China
5 Biopolymers and Colloids Research Laboratory, Department of Food Science, University of
Massachusetts, Amherst, MA 01003 USA
Abstract
There is an inconsistency between the modeling assumptions (equations 1-6) and the main ordinary differential equation (equation 7). Indeed, the exponent in equation (7) should be 2/3 instead of 3/2, leading to several changes in subsequent equations.
In this note, we derive the corrected equations and compare them to the original ones, which show similar dynamical behavior.
Assumptions and equations from the original article
In order to make this note self-sufficient, we first recall the assumptions and equations from the original article. Numbering was kept identical to the original article, using an additional prime symbol ( ' ) for the corrected equations.
Assuming that two free fatty acid (FFA) molecules are produced per triacylglycerol molecule, the percentage of released FFA, %𝐹𝐹𝐴, is given by
%𝐹𝐹𝐴 = 100 × �𝑉𝑁𝑎𝑂𝐻 × 𝑚2 × 𝑤𝑙𝑖𝑝𝑖𝑑𝑁𝑎𝑂𝐻 × 𝑀𝑙𝑖𝑝𝑖𝑑� (1) where 𝑉𝑁𝑎𝑂𝐻 is the volume of added sodium hydroxide solution (m3), 𝑚𝑁𝑎𝑂𝐻 is its molarity (kmol.m-3), 𝑤𝑙𝑖𝑝𝑖𝑑 is the initial mass of the triacylglycerol oil (kg) and 𝑀𝑙𝑖𝑝𝑖𝑑 is its molar mass (kg.kmol-1).
Assumption 1 The rate of FFA release from lipid droplets is proportional to the droplets surface
area per unit volume of the emulsion, Sd (m2.m-3)
𝑑𝑚𝑑
where 𝑚𝑑(𝑡) is the number of moles of digestible FFA in the droplets, 𝑑𝑚𝑑/𝑑𝑡 is the number of moles of FFA leaving the droplets per unit time, 𝑘 the rate constant (kmol.s-1.m-2) and 𝑉
𝐸the volume of the emulsion (m3).
Remark: it is important to notice that equation (2) has a physical meaning if and only if 𝑚𝑑 ≥ 0.
Assumption 2 The total number of lipid droplets remains constant and their diameter 𝑑(𝑡)
decreases when the products of the lipolysis leave the droplet. The specific surface area of the droplets per unit volume of the emulsion is then given by
𝑆𝑑(𝑡) = 𝑛0𝜋 𝑑2(𝑡) (3)
where 𝑛0 is the number of droplets per unit volume of emulsion (m-3). 𝑛0 is computed from the
initial state of the emulsion 𝑛0= 6 𝜙0
𝜋 𝑑03 (4)
where 𝜙0is the initial droplet volume fraction and 𝑑0the initial droplet diameter (m).
Assuming that all of the digested lipids leave the droplets, the ratio of the droplet volume during
digestion to the initial droplet volume is given by 𝑉𝑑(𝑡) 𝑉0 = 1 6 𝜋 𝑑3(𝑡) 1 6 𝜋 𝑑03 = 𝑚𝑚𝑑 0 (5)
where 𝑚0 is the initial number of moles of FFA in the droplets. Hence 𝑑(𝑡) = 𝑑0�𝑚𝑚𝑑
0
3
(6)
Remark: from equation (6), 𝑑(𝑡) could become negative if the nonnegativity of 𝑚𝑑(𝑡) is not ensured, which would lead to inconsistent results.
From this point, a discrepancy occurs between the article and the actual solution, due to a misprint in the exponent. Indeed, substituting equations (3) to (6) in equation (2), the article gives
𝑑𝑚𝑑 𝑑𝑡 = −𝑘 6 𝜙0 𝑑0 � 𝑚𝑑 𝑚0� 𝟑 𝟐 � 𝑉𝐸 (7)
while one should obtain 𝑑𝑚𝑑 𝑑𝑡 = −𝑘 6 𝜙0 𝑑0 � 𝑚𝑑 𝑚0� 𝟐 𝟑 � 𝑉𝐸 (7')
Note the modification of the exponent between equations (7) and (7'): 3/2 versus 2/3.
Analytical solutions
𝑑𝑚𝑑 𝑑𝑡 = −𝑘 6 𝜙0 𝑑0 � 𝑚𝑑 𝑚0� 𝟑 𝟐 � 𝑉𝐸 𝑑𝑚𝑑𝑡 = −𝑘 𝑑 6 𝜙𝑑 0 0 � 𝑚𝑑 𝑚0� 𝟐 𝟑 � 𝑉𝐸 The analytical solution writes
𝑚𝑑(𝑡) = �𝑑3 𝑘 𝜙0 0 𝑚03/2 𝑉𝐸 𝑡 + 𝑚0 −1/2�−2 (8) 𝑚𝑑(𝑡) = �𝑚01/3 − 2 𝑘 𝜙0 𝑑0 𝑚02/3 𝑉𝐸 𝑡� 3 (8') which leads to Φ = 1 −𝑚𝑑𝑚 0= 1 − �1 + 3 𝑘 𝜙0 𝑉𝐸𝑡 𝑑0𝑚0 � −2 (9) Φ = 1 −𝑚𝑑 𝑚0= 1 − �1 − 2 𝑘 𝜙0𝑉𝐸𝑡 𝑑0𝑚0 � 3 (9') Rewriting 𝜙0 as 𝜙0=𝑉𝑤𝑑 𝐸𝜌 = 𝑚0𝑀 2 𝑉𝐸 𝜌 with 𝜌 the density of the triacylglycerol oil (kg.m-3), it leads to
Φ = 𝜙𝑚𝑎𝑥�1 − �1 +2 𝑑0 𝜌 𝑡�3 𝑘𝑀 −2� (10) Φ = 𝜙𝑚𝑎𝑥�1 − �1 −𝑑0 𝜌 𝑡�𝑘 𝑀 3� (10') where 𝜙𝑚𝑎𝑥 is the asymptotic maximal percentage of released FFA.
Dynamical behaviors of the solutions
A parameter estimation has been performed on equation (10') in order to fit the equation (10). We added a condition of nonnegativity for 𝑚𝑑 in equation (10') which then became
Φ = 𝜙𝑚𝑎𝑥�1 − 𝑚𝑎𝑥 �0, �1 −𝑑0 𝜌 𝑡�𝑘 𝑀 3�� (11') The results are depicted in Figure 1 and show similar dynamics for both solutions (10) and (11').
Qualitatively, both solutions have a similar shape but the corrected one reaches a constant plateau more quickly.
Figure 1. Comparison between original (continuous line) and corrected (dashed line) solutions. The corrected solution included a condition for md≥0.
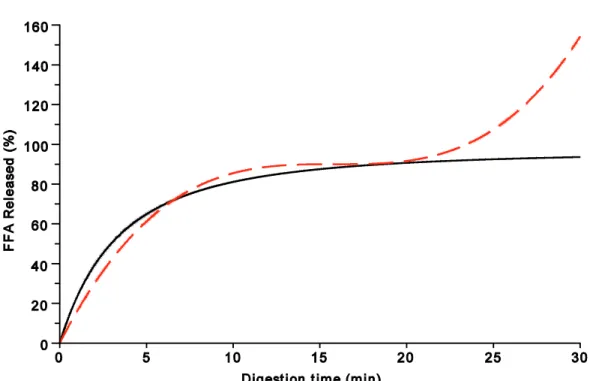
If nonnegativity is not preserved, equation (10') shows a totally different behavior. Indeed, mathematically, this solution is monotonically increasing, with an inflection point, but goes to infinity (Figure 2). In contrast, the original solution, equation (10), does not need an explicit condition of nonnegativity.
Figure 2. Comparison between original (continuous line) and corrected (dashed line) solutions when nonnegativity of md is not explicitly preserved.
Conclusion
Both original and corrected equations are able to fit in vitro lipolysis data reasonably well. The original equation (10) reproduces the observed trend of experimental data somewhat better than the corrected equation (11') and has no need to explicitly enforce the nonnegativity of number of moles (or mass) to avoid unphysical results.
Equation (10) does not correspond to the physical hypotheses described in the original article, however.