HAL Id: hal-00436326
https://hal.archives-ouvertes.fr/hal-00436326
Submitted on 26 Nov 2009HAL is a multi-disciplinary open access archive for the deposit and dissemination of sci-entific research documents, whether they are pub-lished or not. The documents may come from teaching and research institutions in France or abroad, or from public or private research centers.
L’archive ouverte pluridisciplinaire HAL, est destinée au dépôt et à la diffusion de documents scientifiques de niveau recherche, publiés ou non, émanant des établissements d’enseignement et de recherche français ou étrangers, des laboratoires publics ou privés.
Molecular Dynamics Simulations of Cytochrome c
unfolding in AOT Reverse Micelles: the first steps
Stéphane Abel, Marcel Waks, Massimo Marchi
To cite this version:
Stéphane Abel, Marcel Waks, Massimo Marchi. Molecular Dynamics Simulations of Cytochrome c unfolding in AOT Reverse Micelles: the first steps. European Physical Journal E: Soft matter and biological physics, EDP Sciences: EPJ, 2010, 32 (1), pp.399-409. �10.1140/epje/i2010-10635-x�. �hal-00436326�
1
Molecular Dynamics Simulations of Cytochrome c
un-folding in AOT Reverse Micelles: the first steps
Stéphane Abel+*, Marcel Waks‡,§ and Massimo Marchi+
+
Commissariat à l’Energie Atomique, DSV/iBiTecS/SB2SM, CNRS URA2096, Gif sur Yvette, F-91191, France; ‡UPMC, Laboratoire Imagerie Paramétrique, F75006 Paris, France §CNRS, LIP UMR7623, F-75006, Paris, France.
*
2 This paper explores the reduced form of horse cytochrome c confined in reverse micelles (RM) of so-dium bis-(2-ethylhexyl) sulfosuccinate (AOT) in isooctane by molecular dynamics simulation. RMs of two sizes were constructed at a water content of Wo = [H2O]/[AOT] = 5.5 and 9.1. Our results show that
the protein secondary structure and the heme conformation both depend on micellar hydration. At low hydration, the protein structure and the heme moiety remain stable, whereas at high water content the protein becomes unstable and starts to unfold. At Wo = 9.1, according to the X-ray structure,
conforma-tional changes are mainly localized on protein loops and around the heme moiety, where we observe a partial opening of the heme crevice. These findings suggest that within our time window (10 ns), the structural changes observed at the heme level are the first steps of the protein denaturation process, pre-viously described experimentally in micellar solutions. In addition, a specific binding of AOT molecules to a few lysine residues of the protein was found only in the small-sized RM.
3
I. Introduction
Reverse micelles (RM) are stable, isotropic, water microemulsions suspended in organic solvents1. One of the most described RM systems is formed by sodium bis-(2-ethylhexyl) sulfosuccinate (AOT) and water in isooctane. This ternary system has been widely studied in last decades by various physical methods (see refs. 2-4 for data and references). The size of the water pool (i.e. the water content of the system) can be varied from 10 to 100 Å by changing Wo, the water-to-AOT molar ratio: [H2O]/[AOT] 5.
In many cases, the secondary structure of confined proteins is conserved in these systems which are con-sidered as a biomimetic microenvironment and provide thus a simple model for the study of the re-stricted microenvironment effects on the structure and dynamics of confined peptides and proteins 6-8.
Recently, molecular dynamic simulations (MD) have been successfully used to gather additional in-formation about AOT RM structure and dynamics at the atomic level 9-16. These studies have underlined the effect of the charged, restricted microenvironment on the confined water structural 13,14,16 and dy-namical properties 13,14,17 existing in RM. More recently molecular simulations have been extended to examine the influence of hydration on peptides and small proteins confined in AOT surfactant RM 17 or in fluorosurfactants 18. In the former study, we have examined the structural changes of an alanine oc-tapeptide (A8) in its canonical α-helix conformation, in small-sized AOT RM at Wo < 7.0. We have
shown that the secondary structure stability of the confined peptide depends on the water pool size, the surfactant headgroup and the peptide backbone polar groups hydration balance, as suggested by recent experimental 19 and theoretical studies 20.
Cytochrome c (CYTC) is a small (104 residues), globular, basic (pI = 10.5) hemoprotein associate with the inner membrane of the mitochondrion. It plays a crucial role in the electron transfer (ET) within the respiratory chain 21 and in other cellular mechanisms, such as apoptosis 22. According to the STRIDE program 23, the protein displays 5 α-helices (α1-5), 2 β-sheets (β1-2) and 4 major loop (L1-4) domains
(Figure 1). Most of the positively charged residues are located around the heme crevice 24. Depending on the microenvironment, CYTC can adopt a number of conformational states. For example, membrane-bound CYTC has been thoroughly investigated 25-27. It was shown that the membrane anionic
environ-4 ment disrupts the native protein structure, leading to molten globule-like states 26,28. In such states the absence of the characteristic heme absorbance band at 695 nm, is paralleled with the disruption of the Met-80 ligation to the iron atom 29,30. In AOT reverse micelles, it was suggested that the protein is lo-cated at the micellar interface, with its positively charged residues close to the AOT head groups 31,32. As in membranes, electrostatic interactions also occur between the AOT anionic polar head groups and the positively charged protein residues leading to identical spectral characteristics, reported at different RM water contents 29,30. Such results have been interpreted by the opening of the CYTC heme crevice and the successive disruption of the Met80-Fe and His18-Fe bonds under the electrostatic field. How-ever, it was also pointed out 32,33 that despite the possible absence of the Met80-Fe ligation to the iron atom, the secondary structure of the protein remains close to the native state at Wo ≤ 10, whereas it
be-comes unstable with increasing values of Wo, displaying a lower α-helix content. To examine at the
atomic level these phenomena, we have extended our previous atomistic model of AOT RM with con-fined peptides, to explore the conformation changes of CYTC in AOT RM at Wo = 5.5 and 9.1. We have
compared these results with those of the protein in bulk water or in the crystal.
This paper is organized as follows: in the next sections, we will describe the preparation procedure of the systems and the potential used to model these systems. It will be followed by a section covering the MD procedures, the results and interpretations of our simulations.
II. Methods
For this study, the protein starting structure consists of the X-ray structure of the horse cytochrome c (PDB: 1HRC) refined at 1.94 Å by Bushnell et al. 34 (Figure 1). The protein contains 104 residues with an acetylated N-terminus and a net charge of +6. Three MD were performed with the reduced form of CYTC. Two simulations (CW) were carried out for the protein in water solution. In the next two, desig-nated as CW-M1 and CW-M2, the protein was solvated inside RM of different sizes, at Wo = 5.5 and
5
A. Cytochrome c in water. The preparation of the solvated protein (CW) simulation was made as
fol-lows: firstly, the crystal structure of the protein was minimized in vacuum with a few hundred steps of conjugated gradient, at a spherical cut-off of 10 Å. Next, the protein was inserted in a truncated octahe-dral box (with a=b=c=65 Å and α=β=γ=109.472o) containing 6681 molecules of TIP3 35 water mole-cules, with 6 chloride ions to neutralize the system. The force field used to model the protein was based on CHARMM 36. We note that in the original CHARMM force field, the heme is modeled in its reduced state (FeII) and several parameters around the heme moiety are missing (such as Met(S)-Fe and His(N)-Fe bonds). In consequence it does not reproduce accurately geometries obtained from DFT calculations or experimental vibrational spectra 37. To deal with these problems, Autenrieth et al. 38 have recently developed new force fields in CHARMM and AMBER framework, for both oxidized and reduced states of heme to simulate more realistically the CYTC X-ray structure and the water-heme interaction ener-gies. In this force field, the His-18(N) and Met-80(S) atoms are explicitly bonded to Fe atom. Since ex-perimental results suggest these bonds are absent in AOT RM 30,31, the Autenrieth parameters cannot be used in the present study.
The system was then slowly heated from 0 K to 300 K by rescaling the atomic velocities to attain T = 300 K after 150 ps and by keeping the protein and the heme (including Fe ion) atoms frozen. An addi-tional equilibration in NVE ensemble at T = 300 K with all the atoms free was also performed during 500 ps. After this step, the system was equilibrated in NVT (T = 300 K) during 500 ps and simulated in the NPT (P = 0.1 MPa and T = 300 K) ensemble for 10 ns after an additional equilibration of 200 ps. To compare the influence of the force field and particularly the Met(S)-Fe and His(N)-Fe bonds on the sol-vated protein structure and stability, we have also carried out an additional MD (CW-b) in the same con-ditions as described above with CW simulated using the Autenrieth parameters.
B. Reverse Micelle Construction and Equilibration. For the RM system we have adopted an all atom
approach to model the AOT, water and isooctane molecules. Briefly, the force field and topology for the surfactant were derived from the CHARMM27 all atom parameters for lipids 39 and adapted for an
6 AOT/water system 40, previously used to simulate AOT RM in isooctane 9. We have applied the TIP3P model 35 to describe water. For the isooctane molecule, the bonded and non-bonded parameters were also taken from the CHARMM27 force field and tested to reproduce crucial properties of liquid isooc-tane (such as density, translational diffusion and isothermal compressibility) at P = 0.1 MPa and T = 300 K (data not shown).
To construct the starting configuration of the two RM, we have first estimated the number of AOT molecules per spherical micelle (nAOT) with a linear fit of the aqueous core radius of gyration of (i.e.
AOT headgroups and water), Rgw, obtained from SAXS ([AOT] = 0.1 M and [CYTC] = 0.01 M at 284
K) 29 (Figure 2). To reduce the system size, we choose two values of the water-to-surfactant molar ratio Wo = [H2O]/[AOT] of 7.5 and 10. For these sizes, the curve fit gives Rwg≈ 21.4 Å and 25.1 Å,
respec-tively. Using a surface area of 54 Å229 per AOT headgroup (SAOT) for Wo in the 5 – 45 range, using the
expression nAOT=(4π Rgw 2)/SAOT, we obtain nAOT ≈ 106 and 147 for Wo = 7.5 and Wo =10, respectively.
In the next step, we constructed two spherical clusters of the desired radius Rwg (i.e. 21.4 and 25.1 Å)
containing 795 and 1470 water molecules from a water final configuration, obtained from a 100 ps MD runs of 2000 TIP3 bulk water molecules in a cubic box simulated at T = 300 K and P = 0.1 MPa. The corresponding numbers of surfactant molecules (including Na+ ions) in an extended conformation were placed by hand around the water sphere surface, tail pointing toward the exterior using the visualization program DS ViewerPro by Accelrys. We are aware that building preassembled reverse micelle does not constitute an ideal approach to simulate a RM system, even if it is a common practice in MD studies of micelles 36,41-47 or reverse micellar structures 9,16,48,49,50 ,51, compared to a random approach where the surfactant monomers are randomly placed in the simulation box 52-56. But, as recently shown by 15, the micellization process in AOT RM is long (close to 60 ns or more) and computationally expensive when the aggregates are small and/or when the micellar environment is simulated in great detail to reproduce experimental data.
After this construction phase, the two RMs were equilibrated at 500 K with a spherical cutoff of 10 Å for 500 ps, during which the water and the AOT headgroups were blocked to randomize the
hydropho-7 bic chains of the surfactant. Then, the minimized structure of the protein was randomly inserted into the center of the micellar water core and all water molecules within 2 Å of protein atoms were removed within the two RMs of Wo = 5.5 and 9.1, obtaining the systems CW-M1 and CW-M2 respectively. The
RM-protein complex was again minimized with a few thousands steps of conjugated gradient and a cut-off 10 Å. Subsequently, the two micelles were inserted into a truncated octahedral box (with a=b=c=105 Å and a=b=c=110 Å and α=β=γ=109.472° for the smallest and the largest micelle, respectively) filled with 2587 and 3345 molecules of isooctane and six chloride ions to ensure electroneutrality of the sys-tem. The number of isooctane molecules was chosen to simulate a well defined L2 phase with a mass
fraction of isooctane larger than 20 % 2,29,57. Finally, the simulated systems, referred to as CW-M1 and CW-M2 through this paper, contained 106 and 147 molecules of AOT, 580 and 1339 molecules of wa-ter, corresponding to Wo = 5.47 and 9.1, respectively (see Table 1 for the system composition). To
equilibrate the solvated RMs, we have used three steps as described in Ref. 17. In a first time, the isooc-tane solvent was relaxed for 400 ps at 400 K with the RM-protein complex frozen. Then, the entire sys-tem was frozen at 0 K and then monotonically heated up to attain T = 300 K after 300 ps. These two systems were then equilibrated in the NVE ensemble during 300 ps and in NVT (T=300 K) during 200 ps. After these steps, the two micellar systems were simulated in the NPT ensemble for 10 ns each after an additional equilibration of 100 ps (CW-M1) and 200 ps (CW-M2), respectively.
C. Molecular Dynamics. All simulations described in this paper were performed in an
isobaric-isothermal (NPT) ensemble at T = 300K and P = 0.1 MPa with the sequential and parallel versions of the program ORAC 58. To simulate in the NPT ensemble, ORAC uses a method based on the extended system approach 59-61. This technique involves adding extra (virtual) dynamical variables to the system coordinates and momenta, to control temperature and pressure. An atom group scaling integrator algo-rithm was used throughout this study. It consists in a five time step r-RESPA (reversible Reference Sys-tem Propagation Algorithm) integrator to integrate the equation of motion of our sysSys-tems, with a 12 fs time step 62. It was combined with smooth particle mesh Ewald (SPME) to handle electrostatic
interac-8 tions and constraints on covalent bonds entailing hydrogen 63. The SPME parameters were chosen to maintain a relative error on the electrostatic interaction below 0.1 %. For this purpose, a converge pa-rameter = 0.43 Å-1 was used. For all systems a 5th order B-spline took care of the SPME charge interpo-lation. A 96-point grid in each Cartesian direction was employed for all micelles except for the protein in bulk water where a 64-point grid was adopted instead. As in 17 all our systems were simulated in a periodically replicated primitive body center cubic (bcc) box corresponding to a system with truncated octahedral boundary conditions. Finally, for each system (i.e. protein and micelles), we saved the atomic coordinates once every 240 fs for subsequent analyses.
III. Results
A. Structural Properties of the Reverse Micelles. We first focus on the shape and size of the two
ag-gregates containing the confined protein. In Figure 3, we present the final snapshots (i.e. tsim =10 ns) for
the CW-M1 and CW-M2 systems. It can be seen the two reverse micelles are not spherical but present an ellipsoidal shape. To examine this behavior, it is useful in MD to compute the average ratio a/c be-tween the major (a) and the minor (c) semi-axes lengths of the both micelles and their water core from the inertia tensor of an ellipsoid with an identical mass 9. For this purpose, we have computed at each point of the MD trajectories, the relative magnitudes of the three principal moments of inertia of the micelles, I1> I2> I3 and deduced the three semi-axe lengths a, b, c for an aggregate with an ellipsoid
ge-ometry with the following relations:
(1) Where MT is the total mass of the micelle or the water core (i.e. including only the water molecules). As
shown in Figure 4, the a/c values of the two micelles remain stable after typically 3 (CW-M1) and 4 na-noseconds (CW-M2) of production. For the both micelles, the water pool is found more ellipsoidal than
9 the micelle as previously observed for peptide-devoid 9,16 or peptide-containing micelle 17. The average values of a/c computed after discarding the first 3 and 4 ns of the runs, reported in Table 2, are close to 1.25 ± 0.02 and 1.34 ± 0.03 (CW-M1) and 1.41 ± 0.04 and 1.50 ± 0.06 (CW-M2) for the micelle and the water core, respectively. It is difficult to compare our results with experimental or MD studies since to the best of our knowledge, we did not find in literature reports concerning the shape changes of small AOT RM, after incorporation of cytochrome c. Nevertheless, in the past few years, several experimental studies have been carried out to examine the structure of AOT RM after different size proteins and charge incorporation 6-8. Recently, Gochman-Hecht and Blanco-Peled 64 and Kim and Dungan 65 have examined by SAXS measurements, the structural changes (in size and shape) of confined globular pro-teins: lysozyme (pI = 11.1) and bovine serum albumin (pI=4.3). They showed that the micellar shape transition (sphere to cylinder micelle) depends on protein size, charge and RM water content. For exam-ple in the case of lysozyme, incorporation of the protein into AOT cylindrical RM induced a shape tran-sition to spherical micelles. It was also shown by 65 that protein incorporation (α-lactalbumin) in AOT RM can change the spontaneous curvature of the surfactant wall and the micellar shape to an ellipsoidal aggregate. Since the above results have been carried out with large micelles (Wo > 20), it does not seem
appropriate to extrapolate these results to small ones. More recently, Chaitanya et al. 18 have examined by computer simulations, the structure of PFPE self assembled RM with a confined “mini-protein” the 20 residue Trp-Cage, solvated in supercritical carbon dioxide (scCO2). These authors have obtained
sta-ble spherical micelles. This result contrasts with our previous results 17 and those presented in this paper, but the discrepancy could be explained by the different type of the surfactant, the nature of solvent or the peptide used by the authors.
To compare the sizes of the two micelles with those obtained by SAXS experiments of 29, we have computed the radius of gyration of the aqueous core, Rgw,by including in the calculation only the SO3-,
hydrogen and oxygen atoms of the AOT headgroup and water. We find Rgw= 20.1 ± 0.5 Å and Rgw =
24.2 ± 0.3 Å, for CW-M1 and CW-M2, respectively. These values are close to values of Rgw obtained
10 2). Moreover, for CW-M2 we remark that the Rg value of the aqueous core increases by 2 Å during the
last ~3 ns, in contrast with the behavior of CW-M1 (not shown). This is in relation with the substantial structural changes of confined CYTC within the larger micelle (see below). It is interesting to note that in all cases, the two proteins are well confined within the two RM water cores. Indeed the surface con-tact by Voronoï construction (see Ref. 66 for description of the algorithm) between the confined protein and the solvent atoms remains close to zero during the simulation times. As suggested by Figures 3 and 5, we also find that the protein in the M1 system is more confined in the water pool than in CW-M2. In addition, we have explored the binding of the surfactant to the protein surface. For this purpose, AOT molecules were selected using a cutoff radius Rcut as described in 67. Briefly, an AOT molecule is
considered near a protein residue surface if the distance between the AOT and protein residue atoms is less than Rcut=f(RAOT+Rp), where RAOT and Rp are the force field van der Waals radii of the AOT atoms
and those of the protein respectively, and f is a coefficient taken arbitrarily equal to 1.1. We find no spe-cific sites for AOT binding in CW-M2, whereas in CW-M1 during the whole length of the trajectory, 4 AOT molecules remain attached to the protein, bound to 8 lysines (K7, K8, K22, K25, K27, K86, K87 and K88. Figure 6-a-b). As expected, in both RM, only negatively charged residues are never covered by AOT. For CW-M2 we also observe that the heme binding site is free of AOT molecules during the en-tire run length. Finally, we point out that on average 39 % and 14 % of the protein accessible surface is occupied by AOT molecules in CW-M1 and CW-M2, respectively.
B. Structure and Stability of Proteins in AOT Reverse Micelle. In this section we turn our attention
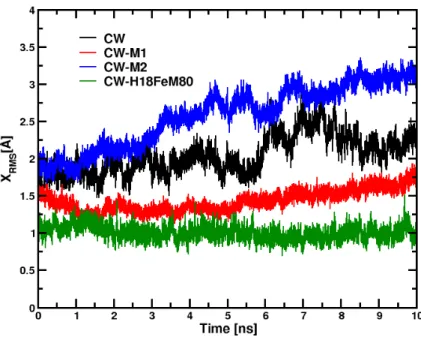
to the structure of the confined CYTC in the two systems and compare it with the same protein in water and in the crystal. At this end, we examine the root mean square deviation of our trajectories from the X-ray structure of the Cα carbon atoms of the protein, or Xrms. Figure 7 displays the instantaneous Xrms of
the three systems as a function of time. It shows that in the smallest RM (CW-M1), CYTC is stable with a Xrms value close to 1.4 Å while in the largest RM (CW-M2), Xrms increases due to the slight change of
11 the relatively high value, between 1.6 - 2.5 Å, of Xrms, for the protein in water (CW; black curve) is
strongly related to the force field used in this study. Indeed, an additional simulation performed with CW, under the same thermodynamic conditions and the same protocol (described in section IIA), with another CHARMM force field 38 represented in Figure 5 by a green curve, where the H18 and M80 at-oms are explicitly bonded to the Fe atom, is more stable than CW (and even CW-M1). This finding is in agreement the fact that these two bonds play a crucial role in the protein secondary structure stability as suggested by 68-70 and also with the fact that this force field better reproduces the heme moiety than the CHARMM default force field. We have also computed the structural alignment of the protein in CW-M1 and CW-M2 with the PyMOL alignment utility 71. The RMSD value obtained (2.7 Å) confirms that the protein secondary structure is slightly different in the two RM.
As previously mentioned, circular discroïsm spectra indicate that the α-helix content of CYTC in AOT RM, decreases with the increase of the water content 32,33. To investigate this aspect, we have ex-amined the protein secondary structure evolution as a function of time with the STRIDE program 23 im-plemented in VMD 72. Each time point was obtained by extracting every 10 ps the atomic coordinates of the protein (for a total of 10000 atomic configurations) and by computing the secondary structure ele-ments (not shown). It appears that CYTC secondary structures do not differ significantly from the crystal structure. Indeed, we find that in the three trajectories the secondary structure elements 23 of CYTC are conserved to a large extent, except for one α1helix, (residues 3 - 14) in the larger micelle. This finding
implies that structural changes occur mainly in the loop regions of the protein. We also remark that the length of our simulations (10 ns) is probably too short to observe any significant denaturation process of the protein. Recent NMR experiments 73 suggest that in RM at Wo = 10, CYTC is substantially
un-folded. However, within the time scale of our trajectories, we only observe the first steps of the denatu-ration process, which may take microseconds to be completed. Partial denatudenatu-ration of CYTC in CW-M2 may increase the size of the confined protein. We have computed the radius of gyration, of the CYTC (Rgp) as a function of time (not shown) and compared it with CYTC in water. We find that the value Rgp
12 %, higher than the value found for CYTC in CW-M1, or in water (13.1 ± 0.1 Å). Nevertheless, these values remain close to those found for CYTC in water by 74 using SAXS (13.8 ± 1.0 Å).
Protein flexibility was also examined as function of the residue number by computing the root mean square fluctuations (RMSF) from the last 4 ns of the simulations (Figure 8). For CW, a major peak is present in loop L1 (residues 15 - 38), showing a larger degreeof fluctuation as compared to the rest of
the protein. This peak is also present in CW-M2 with two additional peaks in two loops: the L2 loop
(residues 40 - 50) and the L4 loop (residues 74 - 88). These three regions contain residues (H18, G41,
Y48, T49, W59, T78, K79 and M80) which are hydrogen bonded to the propionate oxygen atoms, bound to the heme iron, and participate to the stabilization of the native heme state 34. For CW-M1, the RMSF value for each residue is smaller than ~ 0.4 Å2 indicating that the protein is in a “frozen-like” state in agreement with the Xrms curve obtained for CW-M1. These results suggest therefore that the
heme environment is not conserved when the protein is confined in the large micelle, which is in good agreement with previous spectroscopic findings 29,30.
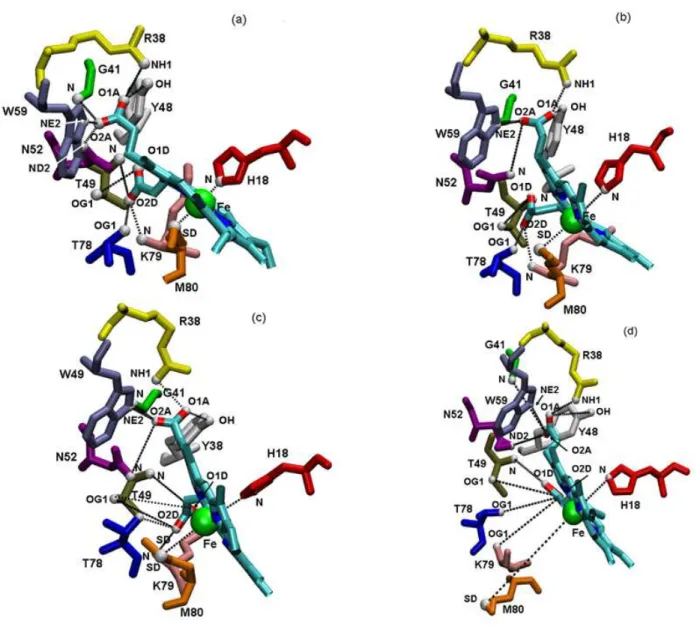
C. Structure of Heme. To gain insights on the structure of heme, we have compared the average
dis-tances between the hydrogen bond donors and acceptors of several residues, the oxygen propionate and the Fe atoms of CYTC in AOT RM, in the crystal form of CYTC and in water. These values are ob-tained from the last 4 ns of the three MD are reported in Table 4 and illustrated in Figures 8(a-d). We are aware that an hydrogen bond is generally characterized by a geometrical criterion such as the angle and distance between the hydrogen bond donor and acceptor, (see for example 75), but as in ref. 34, we have have used only a distance criterion between the two partners to determine the existence of the hydrogen bond. We first notice that the differences in the heme hydrogen bond distances are small between the X-ray structure and the CW simulation. Comparison between a, b, c, d in Figure 9, clearly shows a partial distortion of the heme pocket in the largest micelle. For CW-M2 we find a large increase in the length of the hydrogen bonds involving residues G41, Y48, W59, K79 and T78, whereas in CW-M1 these bonds are unaffected with respect to CW. Differences between CYTC in RM and the protein in solution are
13 more important for hydrogen bonds involving T49 and N52. It is interesting to note that the breaking of the hydrogen bond between residue W59 and the propionate oxygen atoms of the heme, with the in-crease of the water content in the AOT RM, has been also observed by alteration of circular dichroïsm and florescence spectra 29. Indeed circular dichroism spectra have shown that the 282-288-nm bands due to the tryptophan residue orientation and environment disappear with the incorporation of the protein into RM, at a large water content. Moreover, in fluorescence experiments, the low fluorescence intensity at 330 nm at Wo < 10 is attributed to the quenching of the excited tryptophan (W59) by the heme 76.
With the increase of Wo, the fluorescence intensity of W59 increases and suggests therefore that at Wo >
10 the tryptophan ring is now too far from heme to be quenched 77. Our results are consistent with these results.
The direct heme bond M80-Fe is also found much longer in M2, i.e. 10.9 Å, compared to CW-M1, 3.9 Å, and CW, 3.0 Å. This result is in agreement with spectroscopic data 29,30, which indicate the absence of the 695 nm absorption band (paralleled with the Met80-Fe bond disruption) observed at any water content (Wo < 10). Similarly, in both micelles the H18-Fe bond is around 1.4 Å longer than in
solution where its length is 3.0Å. Altogether these results show that the heme pocket is more deformed and open in the largest micelle than in the smallest or in solution.
D. Micellar Water Dynamics. Experimental techniques 57,78-81 and simulations 12,13,14 ,16 have shown that in AOT RM, the micellar water properties differ substantially from those of bulk water. In particular it was noted that the translational and rotational properties of the micellar water are slowed down in small AOT RM (Wo < 10 - 15) as compared to those in the bulk. Indeed as the water amount in the RM
water pool increases, the dynamics of confined and bulk water get more similar. To examine this aspect, we have computed the mean square displacement (MSD), <|r(t)-r(0)|2>, of the core water in protein-void and protein-filled RM as a function of time, and compared it with the results obtained with TIP3 bulk water. These functions are displayed in Figure 10. As previously observed for water molecules near pro-tein surfaces 82,83, micelles 84 and in AOT reverse micelles 9,13, their MSD is smaller than that of bulk
14 water and presents a subdiffusive regime which obeys a power law (i.e. <|r(t)-r(0)|2> ∝ tα with α < 1 denoting a dispersive diffusion. We observe the slowest diffusion for the smallest micelle (CW-M1), whereas in the largest one the water diffusion is similar to that of protein-void micelles. From these curves, we estimate the water residence time, τw, 32.6 ps and 12.0 ps for CW-M1 and CW-M2,
respec-tively. In contrast, we find values of 7.5 ps and 6.5 ps for protein-void micelles at Wo = 5 and 7 9,
re-spectively. Following Denisov and Halle 85, we define τw as the time needed by a water molecule to
cover a distance of 3 Å, i.e. corresponding to a water molecular diameter. Our calculations show that water in the first hydration shell around the protein is slowed down to a large extent with respect to wa-ter hydrating the protein surface in the bulk. Compared with τw = 13 ps for CYTC, we find a τw of 113 ps
and 59 ps for CW-M1 and CW-M2, respectively. In a previous work with an alanine octapeptide (A8)
confined in AOT RM 17, we showed that the secondary structure of the peptide is stable in a smaller RM, when all water present is assumed to be bound to the AOT head groups (and Na+ ions). We inter-preted this behavior by observingthat the stability of the A8 peptide in the small AOT RM is enhanced
by the effect of hydration competition between the surfactant head groups and the peptide polar groups, as well as by the confinement effect due to the small size of the water pool, favoring proximity between the surfactant headgroups and the protein surface (Figures 3 and 5). We notice that the slow dynamics observed in the water confined within the smallest micelle CW-M1, may also contribute to a significant extent to the protein stability. Furthermore, this effect illustrates the competition for water existing be-tween the protein and the micellar wall and can thus be considered as a marker of the observed changes.
IV. Conclusions
In this paper, we have examined by computer simulation the confinement of the reduced form of CYTC in AOT RM, at two levels of hydration. In AOT reverse micelles, strong electrostatic interactions occur between the anionic polar head groups and the positively charged protein residues (pI=10.5). The spectroscopic results previously reported by 29 have been interpreted as originating from the opening of the CYTC heme crevice under the electrostatic field generated by the micellar anionic head groups,
15 since most of the CYTC positive charges are located around the heme crevice 25-27. Our simulations support this picture. In CW-M1, where the size of the micelle is close to that of the protein molecule, our simulations display within its time window (10 ns), a confined, rather stable protein, despite the binding of four AOT molecules on the lysine residues. At a higher hydration level, we do observe a heme pocket distortion starting at Wo = 9.1, a lower value compared to the value of Wo= 20, reported by 29
. This distortion involves a partial opening of the prosthetic group crevice, which becomes accessible to water during the whole run. At the same hydration level we observe large fluctuations of L1, L2, and
L4, the loops involved in the stabilization of heme native state. The CYTC peptide chain itself exhibits
minor changes, with the exception of one α-helix (residues 2-15). It is clear that several parameters ac-count for the observed structural changes, the micelle-protein interactions constituting the major factor, compared to the membrane-protein interactions which disrupt the native protein structure, 26,28 including the disruption of the Met-80 ligation to the iron atom.
In contrast, the observed slowing down of water molecules at the protein surface can be considered a marker of the microenvironment experienced by water molecules. In this respect, we stress that the dy-namic slowing down increases at low water content, where the protein distortion is minimal. Thus, our simulations provide clues that the structural alterations observed at heme level are the first signals of CYTC denaturation, observed experimentally at high water content. Such unfolding may take microsec-onds to be completed in AOT RMs, a time too long to be explored by classical explicit molecular simu-lations.
Acknowledgements: We thank the Centre de Calcul Recherche et Technologie (CCRT) in Bruyères le
16 Tables System CW CW-M1 CW-M2 Wo - 5.5 9.1 n AOT - 106 147 nNa+ - 106 147 nCl- 6 6 6 nH2O 6681 580 1339 niso - 2587 3345 natoms 21796 77751 102338 mAOT/miso (%) - 83.7 81.1 tsim(ns) 10 10 10
Table 1. System composition. nx is the number of x molecules in the system; tsim , the simulation time
excluding the equilibration periods 100 ps for CW and 200 ps for CW-M1 and CW-M2.
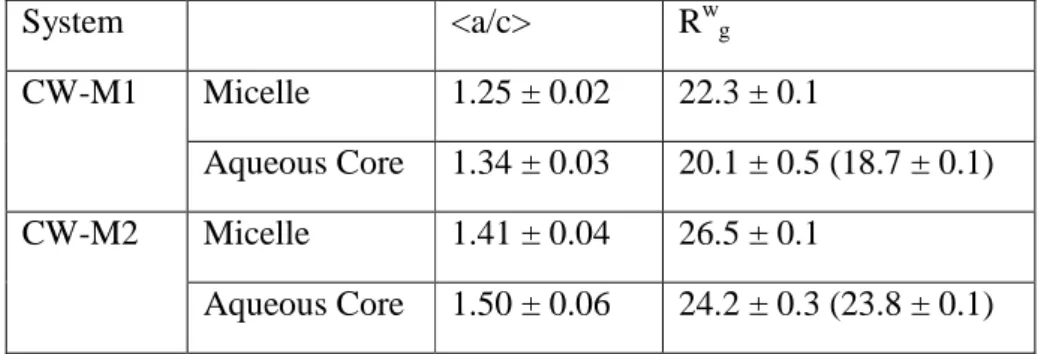
Table 2. Average reverse micelle and aqueous core shapes and dimensions, computed from the last 7
and 6 ns for CW-M1 and CW-M2 of the runs, respectively. The quantities labeled Micelle and Aqueous Core were computed by including all atoms of the micelle and those of water and AOT headgroup, re-spectively. Experimental values (in parenthesis) are calculated from the linear fit of Rwg as a function
Wo (Figure 1). System <a/c> Rwg Micelle 1.25 ± 0.02 22.3 ± 0.1 CW-M1 Aqueous Core 1.34 ± 0.03 20.1 ± 0.5 (18.7 ± 0.1) Micelle 1.41 ± 0.04 26.5 ± 0.1 CW-M2 Aqueous Core 1.50 ± 0.06 24.2 ± 0.3 (23.8 ± 0.1)
17
Table 4. Distances in Ǻ for selected residues atoms from the oxygen propionate and the iron of the
heme. See Figures 8 and 9 for the localization of each atom and residue in the protein backbone.
Table 5. Translational diffusion of the total water confined in AOT reverse micelles and in the
bulk. w is the water residence time, defined as the time (in ps) for a water to cover its own
diame-ter (i.e. 3 Å) 85. w/bw is the ratio between the water residence time in the micelle and in bulk
wa-ter and expresses the retardation compared to bulk wawa-ter (see main text).
System Crystal CW CW-M1 CW-M2 Average Distances R38NH1-O1A 3.42 3.60 2.95 2.87 G41N-O2A 2.94 3.22 3.09 5.81 Y48OH-O1A 2.36 2.76 2.66 8.01 T49OG1-O1D 3.12 3.69 6.22 7.47 T49N-O2D 2.93 3.62 5.39 7.22 N52ND2-O2A 3.22 3.32 4.46 4.17 W59NE2-O2A 2.74 2.83 3.01 4.65 T78OG1-O1D 2.56 3.61 2.58 6.25 K79N-O1D 3.06 3.34 4.00 6.75 M80SD-FE 2.30 3.04 3.90 10.89 H18NE2-FE 2.16 3.00 4.20 4.45 System CW-M1 CW-M2 Bulk τw 32.6 12.0 2.4 τw/τbw 13.6 5.0 1.0
18
Figures
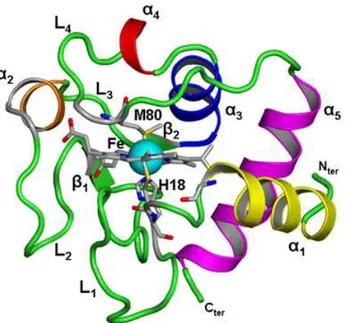
Figure 1. Crystal structure of horse cytochrome C (CYTC) (PDB code: 1HRC) exhibits 45 % helical
(α1-5), 5 %, 2 β sheets (β1-2) and 4 majors loops (L1-4). H18 and M80: Histidine 18 and Methionine 80.
Secondary structure was delimited with the STRIDE program 23 and according to 34.
Figure 2. Plot of the radius of gyration of the aqueous core (AOT headgroup and water) of the reverse
micelle, Rgw as function of Wo obtained from SAXS 29 with [AOT] = 0.1 M and [CYTC] = 0.01 M at
19
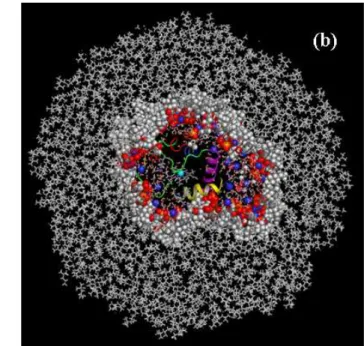
Figure 3. Final configurations (tsim = 10 ns) of CW-M1 (a) and CW-M2 (b). The atoms of AOT, water,
sodium and isooctane molecules are represented by spheres and sticks; the confined protein in cartoon representation. Figures produced with PyMol 71.
Figure 4. Semi-axial ratio a/c, of the whole micelle (black) and water core (red) as function of time.
20
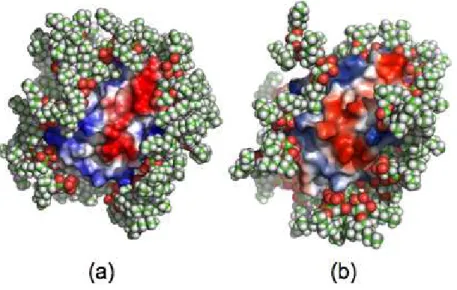
Figure 5. Snapshots of the micelles CW-M1 (a) and CW-M2 (b) at the end of the run. Hydrophobic and
hydrophilic protein residues accessible to AOT surfactant headgroup are plotted in red and blue, respec-tively.
Figure 6. Localization of the 4 permanently bound AOT molecules around the 8 lysines of the protein in
21
Figure 7. Computed instantaneous root mean square deviation from CYTC X-ray structure, or Xrms, of
the three systems as a function of time. The green curve is obtained from an additional MD with the M80-Fe and H18-Fe explicitly bonded (see main text for details).
Figure 8. Root Mean Square Fluctuations (RMSF) computed for each residue of the protein for the last
4 ns of the simulations. Experimental values, in green, are taken from the X-ray B-factor. Only Cα
back-bone atoms are considered. Residues bonded to heme are shown with a star and one code letter. The dashed lines represent limits of calculated secondary structures using STRIDE, according to Figure 1. Computing the RMSF with different procedures (i.e. averaged structures and fluctuations computed in
22 different regions of the trajectories) gives differences of at most 1.5 Å2 for the highest peaks, but much smaller, within the order of ~ 0.1 Å2, in the other regions of the plot.
Figure 9. Average conformations of the heme environment for the last 4 ns of the simulations of each
protein: Crystal (a), CW (b), CW-M1(c) and CW-M2 (d). Hydrogen atoms are not shown for visual clar-ity and atom types are labeled according to the CHARMM force field. Distances between the hydrogen bond donor and the propionate atoms of the heme and the iron are drawn as dashed lines. These pictures were produced with pyMOL 71.
23
Figure 10. Water mean square displacement (msd) as function of time. The dashed line indicates a msd
24
References and Notes
(1) Luisi, P. L.; Straub, J. Reverse Micelles Plenum: New York, 1984.
(2) Pileni, M. P. Structure and reactivity in reverse micelles; Elsevier Science B.V.: Amsterdam, 1989; Vol. 65.
(3) De, T. K.; Maitra, A. Adv. Colloid Interface Sci. 1995, 59, 95.
(4) López-Quintela, M. A.; Tojo, C.; Blanco, M. C.; García Rio, L.; Leis, J. R. Current Opinion in
Colloid & Interface Science 2004, 9, 264.
(5) Pileni, M. P. J. Phys. Chem. 1993, 97, 6961.
(6) Fendler, J. Membrane Mimetic Chemistry; Wiley: New York, 1982. (7) Waks, M. Proteins, Structure, function and genetics 1986, 1, 4.
(8) Chang, G. G.; Huang, E. M.; Hung, H. U. Proc. Natl. Sci. Counc. 2000, 24, 89.
(9) Abel, S.; Sterpone, F.; Bandyopadhyay, S.; Marchi, M. J. Phys. Chem. B 2004, 108, 19458. (10) Alaimo, M. H.; Kumosinski, T. F. Langmuir 1997, 13, 2007.
(11) Brodskaya, E. N.; Mudzhikova, G. V. Molecular Physics 2006, 104, 3635–3643. (12) Faeder, J.; Albert, M. V.; Ladanyi, B. M. Langmuir 2003, 19, 2514.
(13) Faeder, J.; Ladanyi, B. M. J. Phys. Chem. B 2000, 104, 1033. (14) Faeder, J.; Ladanyi, B. M. J. Phys. Chem. B 2005, 109, 6732.
(15) Gardner, A.; Vasquez, V. R.; Clifton, A.; Graeve, O. A. Fluid Phase Equilibria 2007, 262, 264– 270.
(16) Pomata, M., H. H.; Laria, D.; Skaf, M. S.; Elola, M. D. J. Chem. Phys. 2008, 129, 244503. (17) Abel, S.; Waks, M.; Urbach, W.; Marchi, M. J. Am. Chem. Soc. 2006, 128, 382.
(18) Chaitanya, V. S. V.; Senapati, S. J. Am. Chem. Soc. 2008, 130, 1866. (19) Mukherjee, S.; Chowdhury, P.; Gai, F. J. Phys. Chem. B 2006, 110, 11615. (20) Eggers, D. K.; Valentine, J. S. Protein Sci 2001, 10, 250.
(21) Moore, G. R.; Pettigrew, G. W. Cytochromes c. Evolutionary, Structural, and Physicochemical
Aspects. ; SpringerVerlag: Berlin - Heidelberg - New York., 1990.
(22) Liu, X.; Kim, C. N.; Yang, J.; R., J.; Wang, X. Cell 1996, 86, 147. (23) Frishman, D.; Argos, P. Proteins 1995, 23, 566.
(24) Koppel, D. E. J. Chem. Phys. 1972, 57, 4814.
(25) Hildebrandt, P.; Stockburger, M. Biochemistry 1989, 28, 6722.
(26) Pinheiro, T. J. T.; Elove, G. A.; Watts, A.; Roder, H. Biochemistry 1997, 36, 13122. (27) Cortese, J. D.; Voglino, A. L.; Hackenbrock, C. R. Biochemistry 1998, 37, 6402.
(28) Bychkova, V. E.; Dujsekina, A. E.; Klenin, S. I.; Tiktopulo, E. I.; Uversky, V. N.; Ptitsyn, O. B.
Biochemistry 1996, 35, 6058.
(29) Brochette, P.; Petit, C.; Pileni, M. P. J. Phys. Chem. 1988, 92, 3505. (30) Larsson, K. M.; Pileni, M. P. Eur. Biophys. J. 1993, 21, 409.
(31) Pileni, M.-P.; Zemb, T.; Petit, C. Chemical Physics Letters 1985, 118, 414.
(32) Vos, K.; Laane, C.; Weijers, S. R.; Hoek, A.; Veeger, C.; Visser, A. J. W. G. Eur. J. of Biochem.
1987, 169, 259.
(33) Naoe, K.; Noda, K.; Kawagoe, M.; Imai, M. Colloids and Surfaces B: Biointerfaces 2004, 38, 179.
(34) Bushnell, G. W.; Louie, G. V.; Brayer, G. D. Journal of Molecular Biology 1990, 214, 585. (35) Jorgensen, W., L. ; Chandrasekhar, J.; Madura, J. D.; Impey, R. W.; Klein, M. L. J. Chem. Phys.
1983, 79, 926.
(36) MacKerell, A. D. J. Phys. Chem. 1995, 99, 1846.
(37) Rai, B. K.; Durbin, S. M.; Prohofsky, E. W.; Sage, J. T.; Ellison, M. K.; Roth, A.; Scheidt, W. R.; Sturhahn, W.; Alp, E. E. J. Am. Chem. Soc. 2003, 125, 6927.
25 (38) Autenrieth, F.; Tajkhorshid, E.; Baudry, J.; Luthey-Schulten, Z. J. Comp. Chem. 2004, 25, 1613. (39) MacKerell, A. D.; Bashford, D.; Bellott, M.; Dunbrack, R. L.; Evanseck, J. D.; Field, M. J.; Fischer, S.; Gao, J.; Guo, H.; Ha, S.; Joseph-McCarthy, D.; Kuchnir, L.; Kuczera, K.; Lau, F. T. K.; Mattos, C.; Michnick, S.; Ngo, T.; Nguyen, D. T.; Prodhom, B.; Reiher, W. E.; Roux, B.; Schlenkrich, M.; Smith, J. C.; Stote, R.; Straub, J.; Watanabe, M.; Wiorkiewicz-Kuczera, J.; Yin, D.; Karplus, M. J.
Phys. Chem. B 1998, 102, 3586.
(40) Chanda, J.; Chakraborty, S.; Bandyopadhyay, S. J. Phys. Chem. B 2005, 109, 471.
(41) Shelley, J. W., K.; Klein, M. L. Int. J. Quantum Chem: Quantum Biol. Sym. 1990, 17, 103. (42) Tieleman, D. P.; van der Spoel, D.; Berendsen, H. J. C. J. Phys. Chem. B 2000, 104, 6380. (43) Sterpone, F.; Briganti, G.; Pierleoni, C. Langmuir 2001, 17, 5103.
(44) Bruce, C. D.; Senapati, S.; Berkowitz, M. L.; Perera, L.; Forbes, M. D. E. J. Phys. Chem. B
2002, 106, 10902.
(45) Chong, T. T.; Hashim, R.; Bryce, R. A. J. Phys. Chem. B 2006, 110, 4978.
(46) Konidala, P.; He, L.; Niemeyer, B. Journal of Molecular Graphics and Modelling 2006, 25, 77. (47) Sterpone, F.; Marchetti, G.; Pierleoni, C.; Marchi, M. J. Phys. Chem. B 2006, 110, 11504. (48) Tobias, D. J.; Klein, M. L. J. Phys. Chem. 1996, 100, 6637.
(49) Allen, R.; Bandyopadhyay, S.; Klein, M. L. Langmuir 2000, 16, 10547. (50) Senapati, S.; Berkowitz, M. L. J. Phys. Chem. B 2003, 107, 12906. (51) Abel, S.; Waks, M.; Marchi, M.; Urbach, W. Langmuir 2006, 22, 9112.
(52) Salaniwal, S.; Cui, S. T.; Cummings, P. T.; Cochran, H. D. Langmuir 1999, 15, 5188. (53) Marrink, S. J.; Tieleman, D. P.; Mark, A. E. J. Phys. Chem. B 2000, 104, 12165. (54) Lu, L.; Berkowitz, M. L. J. Am. Chem. Soc. 2004, 106, 10254.
(55) Jun, X.; Wenqi, S.; Ganzuo, L.; Gaoyong, Z. Chemical Physics Letters 2007, 438, 326. (56) Jorge, M. Langmuir 2008, 24, 5714.
(57) Amararene, A.; Gindre, M.; Le Huérou, J.-Y.; Urbach, W.; Valdez, D.; M., W. Phys. Rev. E
2000, 61, 682.
(58) Procacci, P.; Darden, T. A.; Paci, E.; Marchi, M. J. Comp. Chem. 1997, 18, 1848. (59) Andersen, H. C. J Chem. Phys. 1980, 72, 2384.
(60) Parrinello, M.; Rahman, A. J. of Applied Physics 1981, 52, 7182. (61) Nose, S. J. of Chem. Phys. 1984, 81, 511.
(62) Tuckerman, M. E.; Berne, B. J.; Martyna, G. A. J. Phys. Chem. 1992, 97, 1990.
(63) Essmann, U.; Perera, L.; Berkowitz, M. L.; Darden, T.; Lee, H.; Pedersen, L. G. Chem. Phys.
1995, 103, 8577.
(64) Gochman-Hecht, H.; Bianco-Peled, H. Journal of Colloid and Interface Science 2006, 297, 276. (65) Kim, J. Y.; Dungan, S. R. J. Phys. Chem. B 2008, 112, 5381.
(66) Procacci, P.; Scateni, R. Int. J. of Quantum Chem. 1992, 42, 1515.
(67) Marchi, M.; Sterpone, F.; Ceccarelli, M. J. Am. Chem. Soc. 2002, 124, 6787.
(68) Jordi, W.; Zhou, L. X.; Pilon, M.; Demel, R. A.; de Kruijff, B. J. Biol. Chem. 1989, 264, 2292. (69) De Jongh, H. H. J.; Killian, J. A.; De Kruijff, B. Biochemistry 1992, 31, 1636.
(70) Smith, L. J.; Davies, R. J.; van Gunsteren, W. F. Proteins-Structure Function and Bioinformatics
2006, 65, 702.
(71) DeLano, W. L.; ver. 0.99 ed.; DeLano Scientific: San Carlos, CA., 2002. (72) Humphrey, W., Dalke, A. and Schulten, K. J. Molec. Graphics 1996, 14, 33.
(73) Peterson, R. W.; Anbalagan, K.; Tommos, C.; Wand, A. J. J. Am. Chem. Soc. 2004, 126, 9498. (74) Akiyama, S.; Takahashi, S.; Kimura, T.; Ishimori, K.; Morishima, I.; Nishikawa, Y.; Fujisawa, T. Proceedings of the National Academy of Sciences 2002, 99, 1329.
(75) Luzar, A.; Chandler, D. J. Chem. Phys. 1993, 98, 8160.
(76) Scott, R. A.; Mauk, A. G. Cytochrome C : a multidisciplinary approach; University science books: Sausalito, 1996.
(77) Tsong, T. Y. J. Biol. Chem. 1974, 249, 1988. (78) Levinger, N. E. Science 2002, 298, 1722.
26 (79) Harpham, M. R.; Ladanyi, B. M.; Levinger, N. E. J. Phys. Chem. B 2005, 109, 16891.
(80) Falcone, R. D.; Correa, N. M.; Biasutti, M. A.; Silber, J. J. Journal of Colloid and Interface
Sci-ence 2006, 296, 356.
(81) Baruah, B.; Roden, J. M.; Sedgwick, M.; Correa, N. M.; Crans, D. C.; Levinger, N. E. J. Am.
Chem. Soc. 2006, 128, 12758.
(82) Bizzarri, A. R.; Cannistraro, S. Physical Review E 1996, 53, R3040. (83) Bagchi, B. Chemical Reviews 2005, 105, 3197.
(84) Balasubramanian, S.; Bagchi, B. J. Phys. Chem. B 2001, 105, 12529. (85) Denisov, V. P.; Halle, B. Faraday Discuss. 1996, 103, 227
27