Publisher’s version / Version de l'éditeur:
Construction and Building Materials, 17, April 3, pp. 153-164, 2003-04-01
READ THESE TERMS AND CONDITIONS CAREFULLY BEFORE USING THIS WEBSITE. https://nrc-publications.canada.ca/eng/copyright
Vous avez des questions? Nous pouvons vous aider. Pour communiquer directement avec un auteur, consultez la première page de la revue dans laquelle son article a été publié afin de trouver ses coordonnées. Si vous n’arrivez pas à les repérer, communiquez avec nous à [email protected].
Questions? Contact the NRC Publications Archive team at
[email protected]. If you wish to email the authors directly, please see the first page of the publication for their contact information.
NRC Publications Archive
Archives des publications du CNRC
This publication could be one of several versions: author’s original, accepted manuscript or the publisher’s version. / La version de cette publication peut être l’une des suivantes : la version prépublication de l’auteur, la version acceptée du manuscrit ou la version de l’éditeur.
For the publisher’s version, please access the DOI link below./ Pour consulter la version de l’éditeur, utilisez le lien DOI ci-dessous.
https://doi.org/10.1016/S0950-0618(02)00109-5
Access and use of this website and the material on it are subject to the Terms and Conditions set forth at
Investigation of thermally induced loads in modified bituminous roofing
membranes
Baskaran, B. A.; Katsman, R.; Sexton, M.; Lei, W.
https://publications-cnrc.canada.ca/fra/droits
L’accès à ce site Web et l’utilisation de son contenu sont assujettis aux conditions présentées dans le site
LISEZ CES CONDITIONS ATTENTIVEMENT AVANT D’UTILISER CE SITE WEB.
NRC Publications Record / Notice d'Archives des publications de CNRC:
https://nrc-publications.canada.ca/eng/view/object/?id=7a4e7a61-93c5-4962-9631-8744336960f4 https://publications-cnrc.canada.ca/fra/voir/objet/?id=7a4e7a61-93c5-4962-9631-8744336960f4
Investigation of thermally-induced loads in modified
bituminous roofing membranes
Baskaran, A.; Katsman, R.; Sexton, M.; Lei, W.
A version of this document is published in / Une version de ce document se trouve dans :
Construction and Building Materials, 2002, pp. 1-12
www.nrc.ca/irc/ircpubs
Paper Accepted for the International Journal of Construction and
Building Material
INVESTIGATION OF THERMALLY INDUCED LOADS IN MODIFIED
BITUMINOUS ROOFING MEMBRANES
A. Baskaran1, R. Katsman2, M. Sexton3 and W. Lei3 Bldg. M24 - National Research Council Canada
Ottawa, Ontario, Canada. K1A 0R6 613 - 990 - 3616
ABSTRACT
When exposed to various thermal conditions, installed roofing membrane experiences dimensional change, which creates induced, loads on the membrane material. These loads can cause a number of undesirable effects such as the membrane separating away from the parapet wall, seam components splitting, membrane tear at the vicinity of fasteners and membrane slag causing blistering. This paper deals with two kinds of thermally induced loads, namely, reversible thermal expansion/contraction and irreversible stress releasing. The mechanisms for each type of induced load have been explored in detail on two membrane types of different internal structure. Thermal conditions are configured in the experiments to simulate typical Canadian summer and winter temperatures on a black roofing membrane surface. This study also explores the role of the membrane’s length and pre-loading on the induced loads. Based on limited data, some practical recommendations are given such as, regarding the influence of the induced loads in the membrane and on the performance integrity of the roofing assembly constructions when subjected to various exposure conditions.
Keywords
Roofing, Membrane, Modified Bituminous, Thermal Stress, Induced Load, Pre-loading, Length, Failures, Seams, Expansion, Contraction.
1 Senior Research Officer and Group Leader, Corresponding Author 2 Formerly Visiting Fellow at NRC from Technion University, Israel 3
INTRODUCTION
In a conventional roofing system, the roofing membrane is at the top where it experiences such environmental forces as wind and temperature. Most conventional systems have five main components with associated functions:
1. Deck - Structural support
2. Barrier - Air and moisture control 3. Insulation - Thermal control 4. Membrane - Waterproofing 5. Attachment systems - Integration
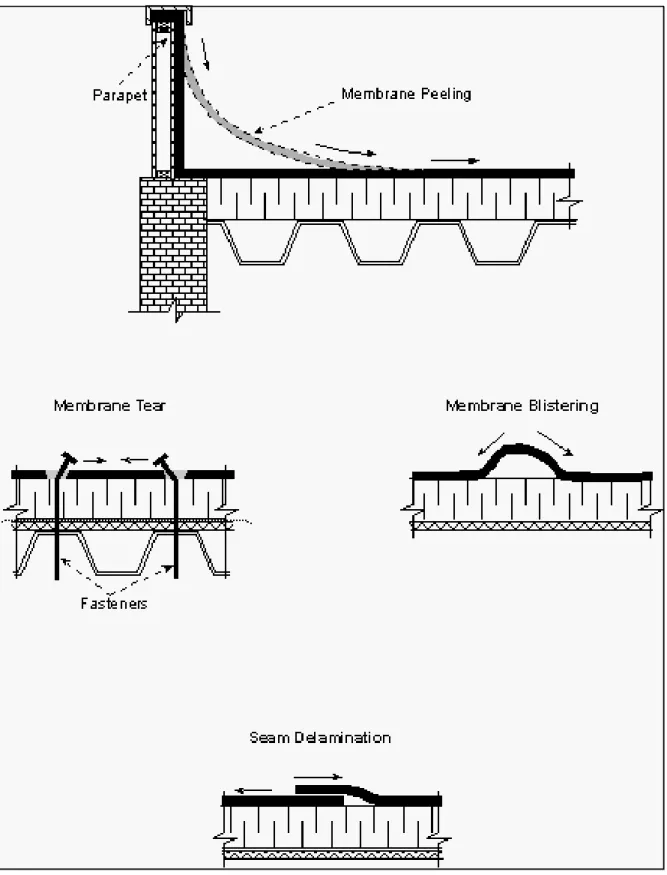
The service life of a roof depends on the characteristics (physical, chemical and mechanical properties) of the individual components and the performance of the whole assembly. For example, dimensional changes on an installed membrane can develop a number of adverse phenomena causing potential decay in the roofing system’s service life. Typical failure types are shown in Figure 1. These failures observed on rooftops have become an ever-increasing concern to many roofing membrane manufacturers, contractors, and insurers. It has led to many visual inspections of the failure mechanisms and surfaced much demand for their quantification of these mechanisms. Figure 1 represents three separate membrane responses that commonly occur due to the influence of thermally induced stresses. The three responses in the Fig 1 refer to the membrane peeling from the parapet wall attachment, membrane tear at the vicinity of the mechanical fastener attachment, and the bonded seam failure types characterized by either an inadequate seam separation or a delamination of the membrane/insulation bond. A possible cause of this type of failure is poor workmanship. To verify this possibility this paper attempts to quantify the contribution, if any, of the membrane in facilitating such types of failures.
Figure 1: Influence of thermally induced loads on the performance of roofing assemblies Thermally induced stresses occur in a material when it is not allowed to expand or contract freely because of a constraint, as it usually happens in the installed roofing membrane. The stresses induced in the membranes by simple thermal expansion/contraction are usually reversible and were studied previously (Rossiter and Batts, 1985; Turenne, 1976; Turenne et.al.,1994). At subfreezing temperatures, the bituminous roofing membrane becomes brittle and is subjected to cracking. Moreover, the stresses induced by the low temperatures were qualified as the most critical for the stability of the roofing construction due to the magnitude of the stresses induced. However, a more detailed investigation is needed to substantiate this assumption.
Advancement in material technology introduced a variety of composite membranes to the roofing market. The composite membranes may contain built-in stresses, which were originated during the membrane’s manufacturing process. These stresses may or may not release in response to the installed membrane’s exposure conditions. Once the stress releasing occurs, it is usually irreversible. Numerical studies conducted earlier (Rossiter and Batts, 1985; Dechaumphai-Pramote, 1996), were unable to
capture these stresses by the proposed models. Thus, a comprehensive analysis of these built-in stresses has not been conducted. As a result, the behavior of the systems with composite membranes under various thermal-exposure conditions cannot be easily predicted.
For elastic materials, the relations between stresses and strains might be represented by the combination of the mechanical and thermally induced stresses (Chawla, 1987 and 1998). Thermally induced stresses in the EPDM membranes were analysed in detail, while considering two major types of the membranes restraining mechanisms, namely, uniform adhesion and restraining along the perimeter (Rossiter and Batts, 1985). Turenne, (1976) reported that a membrane subjected in space of 2 hours to a temperature drop from 69°F (21°C) to -40°F (–40°C) within 2 hours developed stresses 20 and 30 pounds per inch measured at temperature of -0.4°F (–18°C) and -9°F (–23°C), respectively. The study also suggested that temperature-induced stresses tend to be smaller than the tensile strength of the material itself. These experiments were also carried out for 4-ply organic felt in asphalt membranes. Thermally induced stresses for mod bit systems have not been investigated to date. Therefore, an investigation of the influence of the different membranes on the corresponding thermally induced loads is of great interest (Katsman and Baskaran, 2001).
Turenne et al. (1994) studied thermally induced loads in single ply, non-adhered membranes. It was found that the membranes could undergo transition to the glass state, when cooled sufficiently. This condition reduces the membrane’s flexibility and can therefore result in a faster rate of increase in the induced tensile stresses. The study concluded that the temperature-induced stresses in untreated, non-reinforced EPDM membranes were relatively small. The stresses induced by the low temperatures in reinforced pre-conditioned PVC’s were quite large, reaching 20% of the material’s breaking strength. All the efforts of this study were focused only on small specimens. Considering the complex local geometry on the rooftop, the length of the installed membranes and thermally induced stresses may vary significantly.
To investigate the above-discussed issues at the National Research Council of Canada/Institute for Research in Construction (NRC/IRC), a joint research project was established with manufacturers, roofing associations representing contractors, consultants, and building owners. (Refer to the acknowledgment section for the consortium participants.) This paper presents a progress report from this on going study.
EXPERIMENTAL SETUP
Dynamic Roofing Facility
A North American roofing consortium, the Special Interest Group for Dynamic Evaluation of Roofing Systems – SIGDERS has established a Dynamic Roofing Facility (DRF) at the
NRC/IRC. Recently, the DRF has been commissioned as a facility that can simultaneously evaluate the dynamics of wind and thermal effects on roofing systems (Baskaran et al, 2002). The dimensions of both the bottom and top frames are 240“ (6100 mm) long, 86” (2200 mm) wide
and 32” (800 mm) high. The bottom frame is fixed tothe floor, while thetop chamber is movable, such that when positioned above the bottom frame, a closed, sealed unit is achieved. Both the top and bottom frames were well insulated to ensure minimal thermal losses through the chamber assembly and to maintain a near constant temperature gradient inside the chamber. Once assembled, the chamber can be configured to simulate either heating or cooling airflow patterns as shown in Figure 2.
Figure 2: Dynamic Roofing Facility (DRF) at the NRC/IRC
Using a circulating fan and a series of ducting hoses with dampers, air is preferentially distributed through the chamber. As shown in Figure 2, the air is simultaneously conditioned either by heating using a 30 kW heating unit or cooling using a 5 ton cooling unit and air compressor at specific locations in the duct working. The experimental set-up allows for the closed circuit flow of air through the test chamber, which is monitored by the use of an analog thermal controller with feedback signals, and a computer data acquisition system that measures continuous readings from thermocouples inside the chamber. Additional wind application testing can be configured to the experimental set-up utilising the 100 HP Blower and gust simulator flap both as a stand-alone component or combined together with the air temperature conditioning. The existing capacity of the DRF is as follows:
Table 1: Existing capacity of the DRF Specimens
For each test performed two membrane types were evaluated, membrane A and B. Although both membranes belong to the modified bituminous group, membrane A has a polyester reinforcement whereas B is a glass-mat type. The experimental setup design permitted the installation on the table surface of three specimens orientated width-wise (Figures 3) or two samples length-wise (Figures 4) for testing. According to the above setup, the specimens measured in length either 9’ (2.7 m - short ones, tested width-wise) or 21’ (6.4 m - long ones, tested length-wise), and 3.3’ (1 m) in width. Their thickness varied according to the manufacturing specification.
Short Membrane Installation
Figures 3 depicts the experimental set-up for the test conducted on the membranes with a widthwise layout, i.e., membrane sample length of 9’ (2.7 m). The 3 membrane specimens shown are loose-laid across the width of the table above two layers of 2” (5 cm) thickness rigid polyiso insulation boards and a typical 22 Gauge steel deck installed over wood joints. Thermo couples are embedded directly to the membrane surface at various locations and connected to a nearby computer system.
The photos show that one side of each membrane sample was clamped to the table edge to simulate the parapet wall attachment, while the opposite end is draped over a frictionless
aluminum roller, attached to a load measurement device connected to a load cell. The load measurement device was developed using friction clamps and a hanger that holds a connecting bolt firmly attached to a strain gauge controlled load cell. In doing so, the uniformly distributed load across the membrane is transferred to a point load. The point load is measured in the vertical direction as a unit weight of force. Each load cell is calibrated up to 700 lbf (3080 N) and is capable of measuring loads in the vertical direction.
Figure 3: Typical short membrane installation at the DRF
Once the membrane set-up is completed, the top chamber is then placed carefully on top of the bottom frame, as shown in the Figure 3. The top chamber is positioned carefully to avoid creating additional weight on the setup while maintaining efficient thermal resistance. To accomplish this task, a series of wooden blocks, rigid insulation and loose fiber insulation is placed beneath the chamber top along the perimeter of the table edge, ensuring that the specimen's surface within the chamber remained unsupported and uninterrupted. Prior to the conditioning, once the chamber is closed, a pre-load is applied to each non-stressed membrane by manually adjusting the tension applied to the load cell. The heating unit and ducting is then connected to the chamber and any area of potential heat loss minimized and insulated before testing.
Long Membrane Installation
In the Figure 4, two membranes, A and B, with a length of 21’ (6.4 m) are shown loose laid in a length-wise fashion, spanning the entire length of the test table. Similarly, with respect to the load measuring and temperature control, the test set-up followed the same approach as in the width-wise installation. Again, as depicted, the chamber top was carefully placed so that no friction between the samples and the top frame occurred. This was accomplished by transferring the weight of the chamber to the wooden blocks and rigid insulation shown in Fig. 4.
Figure 4: Typical long membrane installation at the DRF Thermal Conditions
The magnitude of temperature and thermal load imposed on a roofing system depends on several factors (Busching et. al.1981). For a black, sanded membrane, the average temperature on its surface usually reaches below -4°F (-20°C) in winter and above +176°F (+80°C) in summer throughout most regions of Canada (Turenne, 1976; Turenne et.al.1994). These temperatures may induce stresses, in addition to the structural stress, while the installed membranes are exposed to the outdoor conditions. To evaluate the stresses induced, both hot and cold conditions were simulated according to the local climatic data indicated in previous work (Turenne, 1976; Turenne et. al.1994) and within the capacity of the DRF. Note that there are several opinions (Pederson et. al.1991; Courville et. al.1991; Busching et. al.1981) concerning what is the appropriate temperature and how long is the conditioning period? Nevertheless, the following profiles are used for the present study.
Heat Conditioning or Hot Cycle
The selected heat conditioning profile is to simulate typical summer temperatures on the exposed black-sanded roofing membrane. The profile shown in the Figure 5 represented by several cycles. During each cycle, membrane temperature was maintained at –73°F± 5% (23°C± 5%) for 18 hr (ambient summer temperature) and then at 176°F± 5% (80°C± 5%) for 6hr (test temperature - the temperature on the top of the membrane considering the influence of solar radiation). This profile describes the daily temperature fluctuations on the top of the membrane. The initial relative humidity at the ambient conditions was about 50%.
Figure 5: Hot-conditioning profile used for the present study Cold Conditioning or Cold Cycle
The selected cold conditioning profile is to simulate typical winter temperatures on the exposed black-sanded roofing membrane. Cold conditions were performed using a step-function profile as depicted in Figure 6. From the ambient conditions, temperature was dropped to –9.4°F± 5% (23°C± 5%) and maintained for 24 hr. Then, the temperature was increased step-wise by 33.8°F (1°C) every 6hr. The experiment was stopped when the temperature on the top of the membrane reached –24.8°F (4°C). Similar to the hot-cycle conditions; the initial relative humidity at the ambient temperature was about 50%.
Figure 6: Cold conditioning profile used for the present study
RESULTS AND DISCUSSION
Membrane A and Membrane B were subjected to the hot-cycle conditioning. Experimental parameters were as follows:
Ø Membrane A: 8’ (2.7 m) long, subjected to 12 hot cycles starting with 50 lbf (220 N) pre-load.
Ø Membrane B: 8’ (2.7 m) long, subjected to 12 hot cycles starting with 50 lbf (220 N) pre-load.
Induced loads during both hot and cold conditioning were measured and analysed. Since the tested membranes are composites, their behaviour varies substantially mainly due to the reinforcement properties. A description of each membrane performance is specified in the following section.
Performance of Membrane A
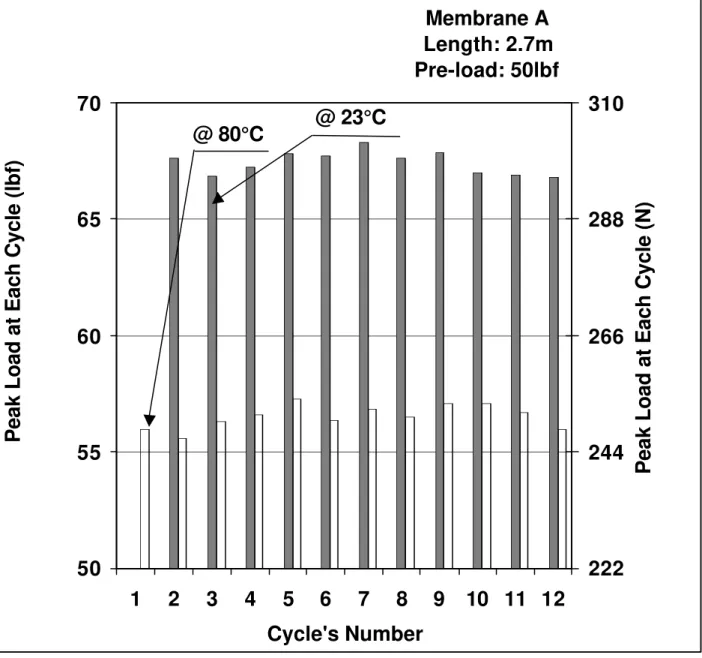
Figure 7 represents the measured peak loads for each cycle at both ambient and tests temperatures. In the first cycle, the stresses induced by test temperature 176°F (80°C) reached 56 lbf (246 N). Note that the initial load applied to the specimen at the ambient temperature 73.4°F (23°C) was only 50 lbf (220 N). In the second and additional cycles, the induced loads by the test temperature 176°F (80°C) reached an average 57 lbf (251 N). The induced loads by the ambient temperature 73.4°C (23°C) reached approximately 67 lbf (295 N). To understand the changes
between the first and additional cycles, the data are analysed as % and presented in Figure 8. The difference between the loads among the first and additional cycles at the ambient temperatures equalled 35% (17 lbf) [75 N] and 2% (2 lbf) [9 N] at test temperature. From this data, it is apparent that the membrane has experienced a stress releasing response to the thermal exposure, causing the
membrane to contract.
Figure 7: Performance of the Membrane A in hot conditioning Figure 8: Load changes of Membrane A between cycles in hot conditioning
The cause of those hidden stresses originates in the manufacturing process. To be more specific, during the process polyester reinforcements are pulled through liquid hot bitumen thus causing some reinforcement’s to thermal expansion due to high temperatures. Then, the manufactured membrane is advanced to the cooling unit, where the bitumen cools down and hardens. The polyester reinforcement has a fairly large coefficient of thermal expansion, surpassing that of the bitumen. Thus, hardened bitumen does not permit the polyester reinforcement to contract and return to its original length. This phenomenon creates the built-in stresses within the manufactured membrane. These stresses are released during the membrane’s utilisation, once the membrane has been exposed to hot conditions. Namely, when the membrane is exposed to the test temperature 176°F (80°C) in first cycle, the bitumen softened and the polyester reinforcement approached its original state. Additional cycles cause thermal expansion of the membrane due to the temperature fluctuations. An average differential load reached about 11 lbf (48 N) due to the temperature fluctuations.
Performance of Membrane B
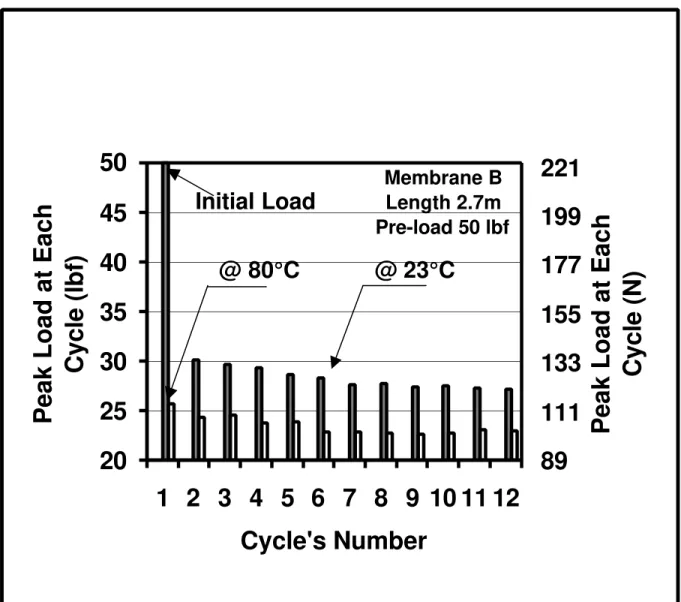
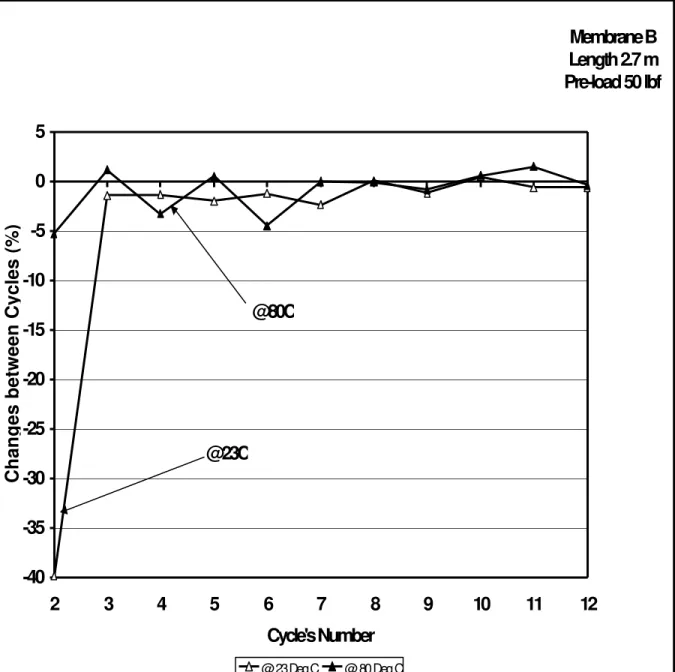
The results are depicted in Figure 9. Similar to Figure 7, Figure 9 represents the measured peak loads from each cycle at both ambient and test temperatures. In the first cycle, the induced load by test temperature 176°F (80°C) reached 26 lbf (114 N). Note that the initial load applied to the specimen at the ambient temperature 73.4°F (23°C) was 50 lbf (220 N). The induced loads by test temperature 176°F (80°C) were decreasing incrementally from the first to fifth cycles. At the ambient temperature 73.4°F (23°C) the induced loads were also decreasing incrementally from the first cycle. The measured load at the second cycle was about 30 lbf (132 N) at the test temperature. This is a drop of 20 lbf (88 N) from the initial loading. To understand the changes between the first and additional cycles, the data are analysed as % and presented in Figure 10. The difference between the loads at the ambient temperatures (cycles 1 to 7th) equalled -23 lbf (-101 N) or -46%. From cycle 1 to 2, it is –20 lbf (-88 N) or – 40% (see Figure 10). Contrary to Membrane A, the stress releasing in Membrane B caused the membrane to expand.
Figure 9:Performance of the Membrane B in hot conditioning Figure 10: Load changes of Membrane B between cycles in hot conditioning
Membrane B has glass-mat reinforcement. It has a small coefficient of thermal expansion in comparison to that of bitumen. Thus, during the manufacturing process, hardened bitumen did not permit the glass-mat reinforcement to expand and return to its original length. This created built-in contraction stresses after the manufacturing. During the hot conditioning from the first to sixth cycle, the bitumen softened. The glass-mat reinforcement expanded and approached its normal state. Note, that the stress releasing took much more time (six cycles) in Membrane B, than in Membrane A (only one cycle). Cycles seven to eleventh describe the regular thermal expansion of the membrane due to temperature fluctuations. An average differential stress reached about 5 lbf (22 N) due to the temperature fluctuations.
Performance Comparison of Membranes A with B
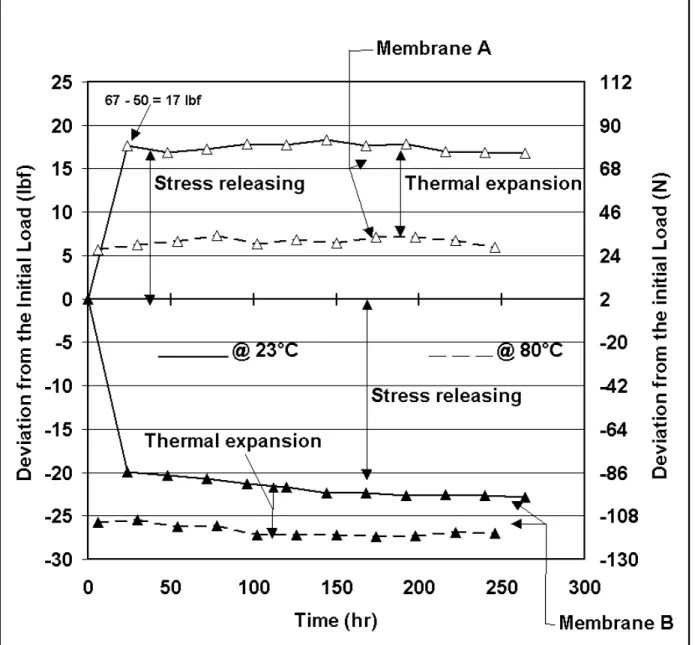
The results of a comparison analysis between Membrane A and Membrane B are depicted in Figure 11. This figure was constructed using the data shown in Figures 7 and 9. The data points (deviation from initial load) were calculated by subtracting the initial load from the measured peak load shown in Figure 7 and 9. For example, the first data point of Membrane A at the ambient temperature corresponds to a value of 17 lbf (75 N). This was calculated using the peak load of second cycle (67 lbf (295 N) – Figure 7) and the initial load of 50 lbf (220 N). A similar exercise was performed for Membrane B, using the peak loads reported in Figure 9. This resulted net positive data for Membrane A and negative changes for Membrane B. The following conclusions can be formulated from the results shown in the Figure 11:
Ø Comparison of Membrane A with Membrane B showed two essentially different stress-releasing mechanisms. Namely, Membrane A contracted whereas Membrane B expanded. At ambient temperature this resulted in differential stresses of 17 lbf (75 N) and –23 lbf (-101 N) for Membrane A and B, respectively.
Ø Time taken for stress releasing is also different for Membrane B compared to Membrane A. Membrane A was affected only by the first cycle whereas it took up to six cycles for Membrane B.
Ø Thermal expansion due to temperature fluctuations also affected the membranes differently. Comparing the stress at ambient conditions (solid line) to that of the test condition (dashed line) one can calculate the induced load due to thermal expansion. It reached about 11 lbf (48 N) in Membrane A, and 5 lbf (24 N) in Membrane B. This may be due to difference in the longitudinal thermal expansion coefficient between Membrane A and Membrane B. What is more interesting to note is the comparison of the thermal expansion with the stress releasing. In the case of Membrane A, the thermal expansion loads are subdued by the stress releasing. On the other hand for Membrane B, thermal expansion loads are additives to the stress releasing ones.
INVESTIGATION OF THE EXPERIMENTAL PARAMETERS
Due to the composite nature of the studied membranes, efforts were taken to carefully evaluate many of the experimental parameters that can influence the presented results. These parameters were selected to evaluate conditions typically encountered in field applications. The factors include the following:
Ø Conditioning temperature profile Ø Length of the membrane specimen Ø Application of a pre-load to the specimen Cold Conditioning
Since roofing membranes are consistently subjected to varying degrees of climatic exposure conditions and experience multiple induced thermal stresses, a comprehensive analysis for the effect of cold conditioning is necessary to better understand the overall behaviour. The following section presents the scope and limitations and discusses the measured data. Membrane A and Membrane B were subjected to the cold conditioning profile (see Figure 6). This figure shows that the membrane was exposed to a temperature of -9.4°F (–23°C) for the 24 hours and then subjected to temperature increase of 33.8°F (1°C) every subsequent 6 hours. This temperature profile can simulate a typical roof installation in Canada’s winter season. A temperature of -40°F (-40°C) would be a more appropriate condition to effectively evaluate the harsh Canadian winter climate exposure on a roof. Nevertheless, the present study data is relevant, since no such previous data is available. Also, mostly, in winter the rooftop is covered with snow. The experimental parameters are as follows:
Ø Membrane A: 21’ (6.4 m) long, subjected to cold conditions starting with 10 lbf (44 N) pre-load.
Ø Membrane B: 21’ (6.4 m) long, subjected to cold conditions starting with 10 lbf (44 N) pre-load.
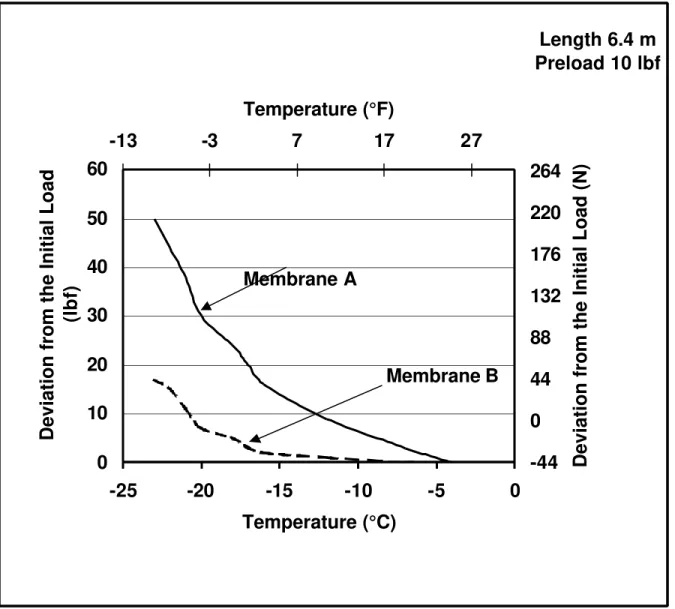
Similar to Figure 11, the same approach was followed when reporting the cold conditioning data, and the results are depicted in Figure 12. In both specimens, the stresses subsided, while the temperature increased. The maximum deviation from the initial load was induced at the minimal test temperature –9.4°F (-23°C) and reached about 50 lbf (220 N) and 17 lbf (75 N) in Membranes A and B, correspondingly. These results confirm the fact that the longitudinal thermal expansion/contraction coefficient of Membrane A is much greater than that of Membrane B, mainly due to the reinforcement’s properties. In both specimens, the induced load subsided, while the temperature increased and they vanished at the maximal test temperature 24.8°F (-4°C). This indicates that no stress releasing was observed in the cold conditioning.
Figure 12: Comparison between Membranes A and B performance in cold conditioning A reversibility of the stresses induced by the same temperature profile applied again was not checked here. In addition, during curing or solidification of the matrix around fibres, a high magnitude of shrinkage/expansion stresses can occur. Specifically, thermal stresses generated depend on the fibre volume fraction, fibre geometry, thermal mismatch between the composite’s components, and the modulus ratio. Once thermal contraction of the matrix on solidification during the manufacturing and further cooling exceeds than that of the fibres, then the fibres should experience an axial compression after the manufacturing. Contrary to this, once thermal contraction of the matrix in these conditions is smaller than that of the fibres, the fibres will experience an axial expansion after the manufacturing. The stress releasing may occur during further membrane utilisation. To account for this behaviour, experiments are in progress. This can be achieved by subjecting the membrane first with the cold conditioning and then with the hot conditioning profile.
Influence of Membrane Length
In the field, depending on the geometry, the length of the membrane used on the rooftop may vary considerably. Normally, membrane pieces of different lengths are installed together to cover the roof surface. The objective of this experiment is to effectively demonstrate the effect of length as a critical parameter in the investigation of induced thermal stresses. For each membrane studied, the experimental set-up mimics that shown in the Figures 3 and 4. In utilising the DRF’s full capacity, Figure 3 shows the set-up for three specimens at 9’ (2.7 m) each, whereas in Figure 4, two specimens at 21’ (6.4 m) each are shown. These two lengths can also be viewed as a short and long sample, respectively. All other conditions remained consistent throughout the tests so that the data can identify the performance trend for the variation in membrane lengths.
Under no circumstances, should this data be used to establish a direct correlation between length and induced load. The experimental parameters are as follows:
Ø Membrane A: 9’ (2.7 m) long, subjected to 6 hot cycles starting with 30 lbf (132 N) pre-load.
Ø Membrane A: 21’ (6.4 m) long, subjected to 6 hot cycles starting with 30 lbf (132 N) pre-load.
The results are depicted in Figure 13. Data from ambient conditions are shown in solid line and the data from non-ambient conditions are shown in dashed lines. Under ambient conditions, the induced load in 21’ (6.4 m) long specimen were by 20 lbf (88 N) greater than those induced in 9’ (2.7 m) long specimen. Under the test conditions, the difference reached 16 lbf (70 N). It is evident that the longer the membrane the higher the induced loads. Nevertheless, the length influence is evident only during the second cycle or after 24 hours of testing. This is due to the fact that it takes time to induce loads
on the longer membrane. Length influence demands amore detailed investigation than the one presented here.
Figure 13: Influence of length on Membrane A performance
Influence of Pre-loading
For each test performed on both membranes exposed to various conditions, the samples were manually pre-loaded (stressed) to different magnitudes at ambient temperature prior to the beginning of the test. As shown in Figure 11, the membranes' response to thermal exposure follows a specific pattern; i.e., a net positive or negative load is experienced. Since the capability of the load-measuring device is restricted to measuring tension, and a measurable positive response from each membrane is required, a pre-load is applied to the membrane beforehand. This process will ensure that the measured load change will never approach zero or less and will avoid registering any negligible values.
To more effectively measure the induced load, a device should be used that gives direct stress measurements, such as attaching strain gauges directly on the membrane surface. This process involves meticulous efforts and requires the skilled application of the delicate equipment. Also this can provide an exact quantification or the individual load. Alternately, the load measuring devices used could be retrofitted to measure compressive load, thus eliminating the requirement of applying a pre-load. In this study, the objective is to observe the overall behavior of the induced load. To do so, the set-up shown in the Figures 3 and 4 was followed and 2 such pre-loads were applied. These experiments were repeated with the following parameters:
Ø Membrane A: 9’ (2.7 m) long, subjected to 12 cycles of hot conditions starting with 50 lbf
(220 N) pre-load.
Ø Membrane A: 9’ (2.7 m) long, subjected to 12 cycles of hot conditions starting with 30 lbf
(132 N) pre-load.
The results are depicted in Figure 14. Data from ambient conditions are shown in solid line and the data from non-ambient conditions are shown in dashed lines. The figure indicates that under ambient conditions, the induced load in the specimen preloaded with 30 lbf (132 N) were larger by about 7 lbf (31 N) than those in the specimen preloaded with 50 lbf (220 N). Under the non-ambient conditions, this difference equaled about 9 lbf (39 N). Thus, the difference on the induced load is less than 10 lbf (44 N) due to the 20 lbf (88 N) difference in the pre-load.
Figure 14: Influence of pre-loading on Membrane A performance, L = 9’ (2.7 m)
Note that the Figure 14 data were derived from the short membrane 9’ (2.7 m) testing. To investigate the pre-load influence further, a second set of experiments was performed not only with further reduction on the pre-load to 10 lbf (44 N) but also by increasing the membrane length. The experimental parameters are as follows:
Ø Membrane A: 21’ (6.4 m) long, subjected to 6 cycles of hot conditions starting with 30 lbf
(132 N) pre-load.
Ø Membrane A: 21’ (6.4 m) long, subjected to 6 cycles of hot conditions starting with 10 lbf
(44 N) pre-load.
The results are depicted in Figure 15. In this experiment, under the ambient conditions, the stresses induced loads in the specimen pre-loaded with 10 lbf (44 N) were 11 lbf (48 N) larger than those in the specimen preloaded with 30 lbf (132 N). The difference was 11 lbf (48 N) under the non-ambient conditions as well. Therefore, it could be concluded that the changes in the pre-loading value have less influence on the induced stresses in Membrane A. A possible explanation for the 10 lbf (44 N) variation due to various pre-loading conditions is that under larger pre-loading the fiber’s potential for thermal expansion is much smaller than the one under smaller pre-loading. As a result, it can be recommended to test Membrane A with the smallest possible pre-load to predict the total thermally induced loads. Another worth while effort is to identify the influence of the pre-load on Membrane B. This is needed due to the fact that Membrane B experiences a negative stress relaxation due to heat conditioning. One should increase the pre-load from 50 lbf (220 N) and monitor the induced loads. Such types of investigations are in progress.
Figure 15: Influence of pre-loading on Membrane A performance, L = 21’ (6.4 m)
PRACTICAL IMPLICATION OF THE MEASURED DATA
Based on the above results, the behavior of Membrane A in hot and cold conditions was compared. The results are depicted in Figure 16. As explained earlier, the hot conditioning resulted in both stress releasing and thermal expansion due to temperature fluctuations. Contrary to this, cold conditioning resulted only in thermal contraction. As shown in Figure 16, the maximal induced load by the thermal contraction in cold conditioning approximately equals the value of the stress releasing due to the heat conditioning. This finding is vital in the advancement of the state of the art in this field. For the on-going research project, the gathered knowledge raised several concepts and ideas for further research such as: Whether there will be any change in the measured response if the membranes were integrated with the other components. Integration can be achieved via attachment using mechanical fasteners or bonding with liquid adhesives. Equally, the limited data has several short-term applications to the industry. Two of them are discussed below:
Figure 16: Practical implication of the measured data
From a research perspective, one can use these data to determine the coefficient of thermal expansion of the tested composite membrane. More specifically, the differential induced load by low 73.4°F (23°C), ambient 73.4°F (23°C) and summer 176°F (80°C) temperatures are 50 lbf (220 N), 55 lbf (242 N) and 43 lbf (189 N), respectively. This shows the dependence of the tested composite membranes at various temperatures. Using this and conducting further investigations one can establish the coefficient of the thermal expansion for each tested composite membrane installed over a roof assembly.
The above data can be successfully applied in practice to design roofs with Membrane A at various exposure conditions. As discussed in the previous sections, the heat conditioning refers to the summer, while the cold one the winter conditions. Normally, new roofing membranes are installed starting from spring. During summer, the membrane surface temperature can reach around 80°C and as indicated, stress releasing of the reinforcement occurs. For the tested specimen described above, it equals 55 lbf (242 N). Let this value be R. Then, the membrane is exposed to the cold conditions during the winter period. For the tested specimen, the differential induced load by the cold contraction reached 50 lbf (220 N). Let this value be C. Thus, the maximal total induced load, T, on a membrane installed in the spring and exposed to hot summer and cold winter conditions can reach T = R + C = 105 lbf (462 N). For membranes installed in spring and exposed to only hot conditions, the differential stresses induced by the thermal contraction reach about-12lbf (-52 N) (43 lbf – 55 lbf). Let this value be E. Then, the maximal total induced load for the membrane installed in spring and exposed to only hot conditions can reach only T = R = 55 lbf (242 N). It is obvious that the total stresses induced by cold climate conditions are much greater than those induced by the hot ones 105 lbf Vs 55 lbf (462 N Vs 242 N).
Referring back to Figure 1, design should consider the resistance of various involved links in a roof assembly subject to various environmental loads. Typical resistance links are attachments with the parapet and roof edges, seam strength tear resistance, bond strength of the membrane with cover board or insulation and others. On the load side of the equation, the influencing external environments are wind, thermal, snow, UV and others. To have a durable roof assembly the resistance of the links must be greater than the summation of the loads. For the thermal induced loads, to avoid any membrane de-lamination, the bond strength of the membrane with parapet should be greater than the total induced load in the membrane (T). Similarly, the membranes seam strength and tear resistance of the membrane at the vicinity of the mechanical fastener locations should also be greater than T to prevent failures.
CONCLUDING REMARKS
Based on the data from this ongoing study, the following conclusions can be drawn.
Ø Different stress-releasing mechanisms were found in Membranes A and B and they were irreversible. They caused Membrane A to contract, while having the opposite effect on Membrane B. It was proved that these stresses were originated during the membranes manufacturing process.
Ø Different thermal induced loads were found in Membranes A and B and they were reversible. In the Membrane A, the thermal induced load was within the stress releasing whereas in the Membrane B, it was additive to the stress releasing. The significant distinctions took place due to differences in the reinforcement structures and materials.
Ø The membrane’s length and pre-loading, explored on Membrane A, were found to have an influence on the resultant thermally induced loads. Effect of the membrane length was more significant than that of the pre-load.
Ø Based on the limited data, some practical insights were given, regarding the influence of the induced load on the performance integrity of the roofing assembly in various exposure conditions. Ø Efforts are in progress to gather additional knowledge and will be presented in future articles.
ACKNOWLEDGMENTS
The SIGDERS consortium is carrying out the presented research. It consists of:
Manufacturers (Canadian General Tower Ltd., Carlisle SynTec Inc, GAF Materials Corp., Firestone Building Products Co., IKO industries Canada, JPS Elastomerics Corp. - Construction Products Group, Soprema Canada, Vicwest Steel),
Building owners (Canada Post Corporation, Department of National Defense, Public Works and Government Services Canada) and
Associations (Canadian Roofing Contractors’ Association, Industrial Risk Insurers, National Roofing Contractors’ Association and Roof Consultants Institute).
REFERENCES
1. Baskaran. A, Liu. K, Lei. W and Delgado. A, “A New Facility to Simulate Simultaneous Wind and Thermal Effects on Roofing Systems”, Submitted to the Journal of Testing and Evaluation, ASTM. 2. Busching.H.W and J.Porcher (1981), ”Thermal loading of bituminous built-up roofing
membranes”, Six Conference on Roofing Technology, Proceedings, pp. 5-12 3. Chawla. K.K (1987), “Composite materials”, Springler-Verlag.
4. Chawla, K.K (1998), “Fibrous materials”, Cambridge, University Press.
5. Courville. C.E, P.W. Childs, and R.L.Linkous (1991), “Analysis of roof systems thermal performance from field data”, International Symposium on Roofing Technology, Proceedings, pp.115-123.
6. Dechaumphai-Pramote (1996), “Adaptive Finite Element Technique for Thermal Stress Analysis of Built-up Structures”, JSME, V.39, n.2, pp.223-230.
7. Katsman, R., Baskaran, A., "Canadian research may provide answers to dimensional stability questions," Roofing Siding and Insulation, 78, (1), January, pp. 4, 2001
8. Pedersen. C.R and G.E.Courville (1991), “A computer analysis of the annual thermal performance of a roof system with slightly wet fibrous glass insulation under transient conditions”,
J. of Thermal Insulation, V.15, pp.110-136.
9. Rossiter. W.J and M.E.Batts (1985), "Finite-Element Analysis of Temperature-Induced Stresses in Single-Ply Roofing Membranes", Durability of Building Materials, V. 2, pp. 195-208.
10. Turenne. R.G (1976), "Shrinkage of Bituminous Roofing Membranes", Canadian Building Digest
#181, Division of Building Research, National Research Council Canada, Ottawa, Ont., Canada,
K1A OR6.
11. Turenne. R.G H.K.Stenman, M.N.Mech, and O.Dutt (1994), "Thermally Induced Loads in Single Ply Membranes", Roofing Research and Standards Development, V.3, ASTM STP 1224.
Figure 5: Hot-conditioning profile used for the present study
18 hr
6 hr
18 hr
1 Cycle
80
Temperature (C)
0
23
Temperature (F)
32
73
176
Time (hr)
Figure 6: Cold conditioning profile used for the present study
-23
-4
Temperature (C)
24 hr
Time (hr)
0
Temperature (F)
32
25
-9
6 hr
1C
-22
-21
Figure 7: Performance of the Membrane A in hot conditioning
Membrane A
Length: 2.7m
Pre-load: 50lbf
50
55
60
65
70
1
2
3
4
5
6
7
8
9
10 11 12
Cycle's Number
Peak Load at Each Cycle (lbf)
222
244
266
288
310
Peak Load at Each Cycle (N)
Figure 8: Load changes of Membrane A between cycles in hot conditioning
Membrane A
Length 2.7 m
Pre-load 50 lbf
-5
0
5
10
15
20
25
30
35
40
2
3
4
5
6
7
8
9
10
11
12
Cycle's Number
Changes between Cycles (%)
@ 23 Deg C @ 80 Deg C
@23C
Figure 9:Performance of the Membrane B in hot conditioning
Membrane B
Length 2.7m
Pre-load 50 lbf
20
25
30
35
40
45
50
1 2 3 4 5 6 7 8 9 10 11 12
Cycle's Number
Peak Load at Each
Cycle (lbf)
89
111
133
155
177
199
221
Peak Load at Each
Cycle (N)
Initial Load
Figure 10: Load changes of Membrane B between cycles in hot conditioning
Membrane B
Length 2.7 m
Pre-load 50 lbf
-40
-35
-30
-25
-20
-15
-10
-5
0
5
2
3
4
5
6
7
8
9
10
11
12
Cycle's Number
Changes between Cycles (%)
@ 23 Deg C @ 80 Deg C
@23C
Figure 12: Comparison between Membranes A and B performance in cold conditioning
Length 6.4 m
Preload 10 lbf
0
10
20
30
40
50
60
-25
-20
-15
-10
-5
0
Temperature (°C)
Deviation from the Initial Load
(lbf)
-44
0
44
88
132
176
220
264
-13
-3
7
17
27
Temperature (°F)
Deviation from the Initial Load (N)
Membrane A
Figure 13: Influence of length on Membrane A performance
Membrane A
Pre-load 30 lbf
0
5
10
15
20
25
30
35
40
45
50
0
50
100
150
Time (hr)
Deviation from the Initial Load (lbf)
0
22
44
66
88
110
132
154
176
198
220
Deviation from the Initial Load (N)
L=6.4m
L=2.7m
Figure 14: Influence of pre-loading on Membrane A performance, L=9’ (2.7m)
Membrane A
Length 2.7m
0
10
20
30
40
50
60
0
50
100
150
200
250
300
Time (hr)
Deviation from the Initial Load (lbf)
0
44
88
132
176
220
264
Deviation from the Initial Load (N)
Pre-load 30
Pre-load 50
Figure 15: Influence of pre-loading on Membrane A performance, L=21’ (6.4m)
Membrane A
Length 6.4m
0
10
20
30
40
50
60
0
50
100
150
200
250
300
Time (hr)
Deviation from the Initial Load (lbf)
0
44
88
132
176
220
264
Deviation from the Initial Load (N)
Pre-load 10
Pre-load 30
Figure 2: Dynamic Roofing Facility (DRF) at the NRC/IRC