1
Supporting Information
Quantification and stability of surface amine groups on silica nanoparticles
using solution NMR
Filip Kunc, Vinod Balhara, Andreas Brinkmann, Ying Sun, Donald M. Leek, Linda J. Johnston* National Research Council Canada, 100 Sussex Drive, Ottawa, Ontario K1A 0R6, Canada
* Corresponding author: [email protected]
Contents
1.0 Characterization of silica nanoparticles (NPs) 2.0 NMR of silica NPs
3.0 Dissolution of silica NPs measured by UV-VIS
4.0 Optimizing silica mass and base concentration for dissolution of silica NPs and NMR analysis 5.0 Characterization of APTES-functionalized 100 nm silica NPs by NMR
6.0 Characterization of in-house functionalized NPs 7.0 Selection of diagnostic signals for NMR analysis. 8.0 Hydrolytic stability of various functionalized NPs
2
1.0 Characterization of silica nanoparticles (NPs)
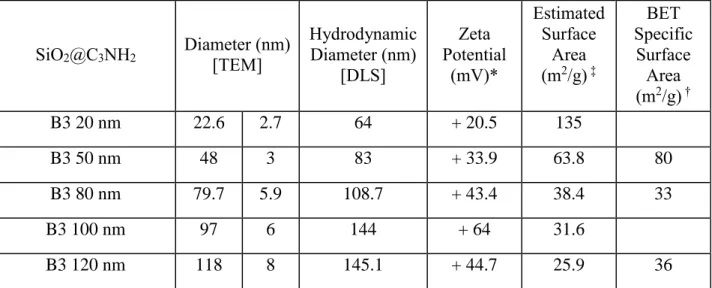
Table S1. Characterization of SiO2@C3NH2 Batch 3, provided by the manufacturer or measured
at NRC (BET). SiO2@C3NH2 Diameter (nm) [TEM] Hydrodynamic Diameter (nm) [DLS] Zeta Potential (mV)* Estimated Surface Area (m2/g) ‡ BET Specific Surface Area (m2/g) † B3 20 nm 22.6 2.7 64 + 20.5 135 B3 50 nm 48 3 83 + 33.9 63.8 80 B3 80 nm 79.7 5.9 108.7 + 43.4 38.4 33 B3 100 nm 97 6 144 + 64 31.6 B3 120 nm 118 8 145.1 + 44.7 25.9 36
* Measured in 2 mM acetate in ethanol (20 nm, 50 nm, 100 nm), ethanol (120 nm) or water (80 nm).
‡ Surface area estimatedfrom the average TEM diameter and a silica density of 1.96 m2/g.
† BET specific surface area measured by adsorption of nitrogenwith a gas sorption analyzer Nova 2200e (Quantachrom). Prior to analysis samples were degassed under vacuum at 115 ℃ for 16 hours. 7-point nitrogen sorption isotherms were measured at -196 ℃ and the specific surface area was calculated by the multipoint point BET method.
3 Figure S1. 1H NMR spectra acquired from 20 nm SiO2@C3NH2 NPs dispersed and equilibrated
in D2O (A) or EtOD-d6 (B). Both samples were dispersed by sonication in an ultrasonic bath for
60 s and the measurement was started 10 min after sonication. After recording the NMR spectrum the EtOD-d6 sample was sonicated for an additional15 min and remeasured 70 min later; no
3-aminopropyl signals were observed.
3.0 Dissolution of silica NPs measured by UV-VIS
Figure S2. Absorbance spectra of 100 nm SiO2@C3NH2 dispersions (1 mg/mL) in 0.4 M NaOD:
immediately after dispersion (blue line), after dissolution at 45 °C for 3 hours in a heated mixer (red) and blank of 0.4 M NaOD (grey).
4
4.0 Optimizing silica mass and base concentration for dissolution of silica NPs
and NMR analysis
The complete dissolution of the sample is important for NMR analysis, because insufficiently dissolved silica produces broad signals for the released amines, and results in additional resonances corresponding to macromolecular polymeric species in which the observed functional groups have restricted mobility. This is illustrated in Figure S3 which shows the effects of varying the concentration of NaOD and the mass of silica NPs used for the dissolution. Using a base concentration of 0.4 M NaOD to dissolve 12.5 mg of silica NPs, the resulting NMR spectrum shows sharp well-defined signals for the three methylene groups. Doubling the mass of silica results in slightly broader signals and tripling the mass gives distinct broad peaks at lower field in addition to the original methylene signals observed for the 12.5 mg sample. Despite these changes, there is only ≈ 5% variation in the calculated amount of amine after integration of the entire signal (both broad and sharp signals) for each CH2 group. Adding bare silica to the 12.5 mg sample
results in almost complete disappearance of the sharp amine signals. Note that the average amine content for this sample based on 6 replicate experiments using the standard protocol with 0.4 M NaOD is 190 ± 5 μmol/g.
Dissolution experiments at lower base concentration give broad signals, even for the lowest mass of silica. Although the results for 12.5 mg silica and 0.2M NaOD give an amine content that is comparable to that obtained at 0.4 M NaOD, larger amounts of silica or lower base both give significantly lower amine content. Overall these experiments illustrate the importance of using appropriate amounts of silica and base concentrations to ensure complete silica dissolution and reliable NMR results.
5 Figure S3. Results demonstrating the impact of incomplete dissolution on the NMR spectra
obtained after dissolution of different amounts (12.5, 25 or 37.5 mg) of 100 nm SiO2@C3NH2
(NanoComposix, ethanol dispersion) at 3 base concentrations. The signals due to residual ethanol have been removed for clarity. Both the sharp and broad signals were integrated for each methylene group.
5.0 Characterization of APTES-functionalized 100 nm silica NPs by NMR
APTES (≈ 0.63 uL) was used for the surface modification of 100 nm bare silica NPs (15 mg) in D2O and EtOH-d6 in 3 replicate experiments. After the reaction the NPs were separated from
supernatant by centrifugation and the amount of unreacted APTES was quantified in NaOD (0.4 M). Modified NPs were purified by three washes with D2O; analysis of the supernatant wash
indicated that excess unreacted reagent was only detected in the first wash. The NPs were characterized by DLS and TEM; the amount of surface amine was quantified by the dissolution/NMR method.
6 Table S2. NMR measurements of APTES remaining in solution after reaction and of
3-aminopropyl groups attached to silica NPs for three replicate determinations. A blank sample without silica NPs was measured to determine the content of APTES used in the reaction (201 μmol/g), approximately 10 % higher than the amount estimated for monolayer surface coverage.
APTES in D2O (μmol/g) Amine attached to NPs (μmol) Sum (μmol) #1 113 85.3 199 #2 115 88.0 203 #3 114 87.7 199 avg 114 ± 1 87 ± 1 200 ± 2
6.0 Characterization of in-house functionalized silica NPs
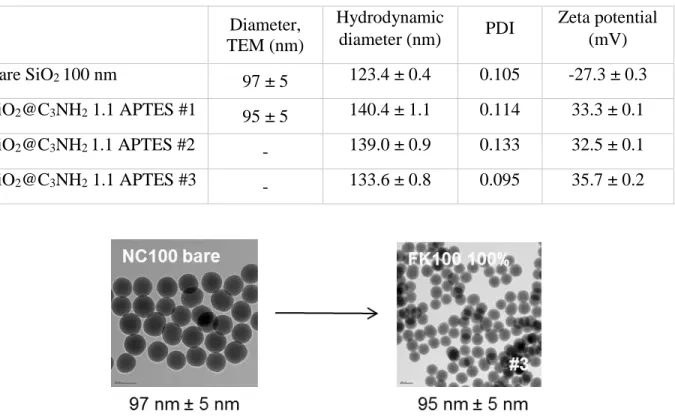
Table S3. Transmission electron microscopy, dynamic light scattering and zeta potential
characterization of in-house functionalized silica nanoparticles. 100 nm bare silica NPs purchased from NanoComposix were used as a template
Diameter, TEM (nm) Hydrodynamic diameter (nm) PDI Zeta potential (mV) Bare SiO2 100 nm 97 ± 5 123.4 ± 0.4 0.105 -27.3 ± 0.3 SiO2@C3NH2 1.1 APTES #1 95 ± 5 140.4 ± 1.1 0.114 33.3 ± 0.1 SiO2@C3NH2 1.1 APTES #2 - 139.0 ± 0.9 0.133 32.5 ± 0.1 SiO2@C3NH2 1.1 APTES #3 - 133.6 ± 0.8 0.095 35.7 ± 0.2
Figure S4: TEM micrographs of 100 nm silica nanoparticles before and after functionalization
7
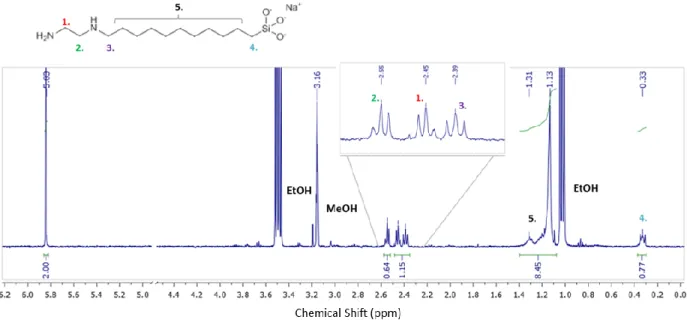
7.0 Selection of diagnostic signals for NMR analysis.
For accurate quantification of functional groups by 1H NMR spectra only resonances that can
confidently be assigned to the functional group should be selected as diagnostic signals. The resonances should be baseline resolved and should not interfere with signals of any other species such as solvents or contaminants. If the integral of a resonance significantly differs from at least two other signals, it can be considered as an outlier and may be discarded. These criteria are illustrated with the spectrum in Figure S5.
Figure S5. 1H NMR spectrum of SiO
2@C11NH2. Resonances 1 and 3 are not baseline resolved
and are integrated as one region (integral value 1.15, 0.575 per CH2 group, compared to 0.64 for
resonance 2). The merged resonances of aliphatic protons 5 are excluded due to the interference with the solvent peak and its satellite; note that the integral value for this signal is 8.45, which is much higher than the value expected for 18 protons [≈ 5.4, based on integrals for 1, 2 and 3). Resonance 4 has an integral value of 0.77, sufficiently different from 1, 2 and 3 that it is excluded.
8
8.0 Hydrolytic stability of various functionalized silica NPs
Table S4. Hydrolytic stability of various amine-functionalized silica NPs. The same incubation
protocol (see Experimental section for 56 °C protocol) was applied to all materials, the released amine moiety was quantified in the D2O supernatant (‘found in supernatant’) after separation from
NPs by centrifugation. The recovered NP pellet was analyzed by the dissolution protocol. All stability experiments were carried out for a single replicate by standard 1H NMR measurement.
The amine loss (percentage) was calculated from the comparison of the initial and the remaining amine content on NP and in some cases from the amount of amine in the supernatant.
Amine content after incubation (μmol/g)# Initial amine content (μmol/g) % amine loss Recovered NPs Super-natant Sum NRC, SiO2@C7NH2 100 nm 38.2 5.4 * 43.6 43.5 12 (12) % NRC, SiO2@C11NH2 100 nm 42.2 nd 42.2 40.0 - (nd) NRC 0.2 SiO2@C3NH2 35.1 nd 35.1 35.5 ± 0.5 - (nd) 100 nm B3 SiO2@C3NH2 108 90.7 199 190 ± 5 43 (48) % AQM027 37 nm C3 C3NH2 520 580 1100 1210 ± 60 57 (47) % 50 nm B2 SiO2@C3NH2 180 36.8 217 215 ± 2 16 (17) % 50 nm B3 SiO2@C3NH2 65.5 nd 58.0 68 ± 2 5 (nd) % # nd = not detected
*the value is below the limit of quantification