HAL Id: insu-02870316
https://hal-insu.archives-ouvertes.fr/insu-02870316
Submitted on 17 Feb 2021
HAL is a multi-disciplinary open access
archive for the deposit and dissemination of
sci-entific research documents, whether they are
pub-lished or not. The documents may come from
teaching and research institutions in France or
abroad, or from public or private research centers.
L’archive ouverte pluridisciplinaire HAL, est
destinée au dépôt et à la diffusion de documents
scientifiques de niveau recherche, publiés ou non,
émanant des établissements d’enseignement et de
recherche français ou étrangers, des laboratoires
publics ou privés.
A. Toumoulin, Y. Donnadieu, J.-b. Ladant, Sietske Batenburg, F. Poblete,
Guillaume Dupont-Nivet
To cite this version:
A. Toumoulin, Y. Donnadieu, J.-b. Ladant, Sietske Batenburg, F. Poblete, et al.. Quantifying the
effect of the Drake Passage opening on the Eocene Ocean. Paleoceanography and
Paleoclimatol-ogy, American Geophysical Union, 2020, 35 (8), pp.e2020PA003889. �10.1029/2020PA003889�.
�insu-02870316�
A. Toumoulin1 , Y. Donnadieu1 , J.‐B. Ladant2 , S. J. Batenburg3 , F. Poblete4 , and G. Dupont‐Nivet3,4,5
1Aix Marseille Université, CNRS, IRD, INRA, Collège de France, CEREGE, Aix‐en‐Provence, France,2Department of
Earth and Environmental Sciences, University of Michigan, Ann Arbor, MI, USA,3Géosciences Rennes, UMR CNRS
6118, Univ Rennes, Rennes, France,4Departamento de Geología, Universidad de Chile, Santiago, Chile,5Institute of Geosciences, Potsdam University, Potsdam, Germany
Abstract
The opening of the Drake Passage (DP) during the Cenozoic is a tectonic event of paramount importance for the development of modern ocean characteristics. Notably, it has been suggested that it exerts a primary role in the onset of the Antarctic Circumpolar Current (ACC) formation, in the cooling of high‐latitude South Atlantic waters and in the initiation of North Atlantic Deep Water (NADW) formation. Several model studies have aimed to assess the impacts of DP opening on climate, but most of them focused on surface climate, and only few used realistic Eocene boundary conditions. Here, we revisit the impact of the DP opening on ocean circulation with the IPSL‐CM5A2 Earth System Model. Using appropriate middle Eocene (40 Ma) boundary conditions, we perform and analyze simulations with different depths of the DP (0, 100, 1,000, and 2,500 m) and compare results to existing geochemical data. Our experiments show that DP opening has a strong effect on Eocene ocean structure and dynamics even for shallow depths. The DP opening notably allows the formation of a proto‐ACC and induces deep ocean cooling of 1.5°C to 2.5°C in most of the Southern Hemisphere. There is no NADW formation in our simulations regardless of the depth of the DP, suggesting that the DP on its own is not a primary control of deepwater formation in the North Atlantic. This study elucidates how and to what extent the opening of the DP contributed to the establishment of the modern global thermohaline circulation.1. Introduction
The Eocene (56 to 33.9 Ma) was a greenhouse period that witnessed major changes in global climate and ocean characteristics (e.g., Borrelli et al., 2014; Katz et al., 2011; Pagani et al., 2014). Notably, it is character-ized by a long‐term gradual cooling initiated by circa 50 Ma, which led to the formation of an ice sheet over Antarctica at the Eocene‐Oligocene Transition (EOT; ca 34 Ma) (Zachos et al., 2001). Understanding the cause of this cooling is crucially important to identify governing mechanisms of global climate in relation to geochemical cycles and oceanic circulation. Several tectonic changes occurred during the Eocene, includ-ing the Drake Passage (DP) and the Tasmanian Gateway openinclud-ing, the collision of India and Asia, the nar-rowing of the Tethys Ocean, and the widening of the Atlantic basin (Bice et al., 2000). In particular, the role of DP opening on Eocene cooling has been extensively studied (e.g., Elsworth et al., 2017; Goldner et al., 2014; Inglis et al., 2015; Lefebvre et al., 2012; Mikolajewicz et al., 1993; Nong et al., 2000; Sijp & England, 2004; Zhang et al., 2010). It has long been hypothesized that, as it allows the formation of the ACC, DP opening may have induced a thermal isolation of Antarctica and subsequent changes in ocean tem-peratures (Kennett, 1977). Some model studies have shown that the effect of the DP opening was not suf fi-cient to match the global cooling observed throughout the Eocene. They rather suggest that an additional decrease in pCO2was required to account for the magnitude and spatial extent of the late Eocene cooling
as well as the EOT itself (e.g., DeConto & Pollard, 2003; Elsworth et al., 2017; Goldner et al., 2014; Inglis et al., 2015; Ladant et al., 2014b; Mikolajewicz et al., 1993; Najjar et al., 2002; Sijp et al., 2009). This hypoth-esis is consistent with pCO2 reconstructions from various proxies (e.g., Anagnostou et al., 2016; Doria
et al., 2011; Inglis et al., 2015; Maxbauer et al., 2014; Pagani et al., 2011, 2005; Pearson et al., 2009; Pearson & Palmer, 2000; Tripati et al., 2005). However, despite a moderate effect of DP opening on global temperatures suggested by data and model studies, the actual effects of this gateway opening on changes in ocean structure and dynamics remain to be identified and quantified.
©2020. American Geophysical Union. All Rights Reserved.
Key Points:
• A shallow opening of the Drake Passage induces strong changes in ocean properties and dynamics • A proto‐ACC is able to form during
the Eocene under high levels of pCO2, but a strong ACC requires
supplementary geographical changes
• North Atlantic Deep Water is probably not able to form before the separation of the Arctic and Atlantic Oceans Supporting Information: • Supporting Information S1 Correspondence to: A. Toumoulin, [email protected] Citation:
Toumoulin, A., Donnadieu, Y., Ladant, J.‐B., Batenburg, S. J., Poblete, F., & Dupont‐Nivet, G. (2020). Quantifying the effect of the Drake Passage opening on the Eocene Ocean.
Paleoceanography and
Paleoclimatology, 35, e2020PA003889. https://doi.org/10.1029/2020PA003889
Received 19 FEB 2020 Accepted 5 JUN 2020
Accepted article online 11 JUN 2020 Corrected 15 SEP 2020
This article was corrected on 15 SEP 2020. See the end of the full text for details.
Different geochemical proxies have been used to track water masses and circulation changes through the Eocene, especially oxygen, carbon, and neodymium isotopes. Stable isotopes of O and C can reveal changes in environmental characteristics, such as temperature, ice volume, and paleoproductivity (see Cooke & Rohling, 1999), whereas radiogenic Nd‐isotopes can be used to fingerprint specific water masses and interbasin water mass exchange (Frank et al., 2006; Huck et al., 2017; Scher & Martin, 2008; Wright et al., 2018). Based on these proxies, some studies have suggested a priming role for the opening of Eocene gateways on the onset of a modern‐like ocean circulation (Borrelli et al., 2014; Katz et al., 2011; Sijp & England, 2004). On the one hand, the DP opening and deepening enabled the formation of the ACC, which connects the Pacific and Atlantic Oceans and encircles Antarctica. This horizontal circulation pattern is particularly visible from changes in Nd‐isotope signatures of the South Atlantic, which receives more radiogenic waters originating from the Pacific (Scher & Martin, 2004, 2006). Further, DP opening is often correlated with the contemporaneous onset of a marked difference between northern and southern latitude temperatures in the Atlantic Ocean, with cooler temperatures in the high southern latitudes suggested byδ18O data (Borrelli et al., 2014; Coxall et al., 2018; Cramer et al., 2009; Katz et al., 2011; Langton et al., 2016). On the other hand, different proxies (δ13C,εNd, δ18O, and contourites) suggest the onset of North Atlantic Deep Water formation (NADW) during the late Eocene, which may also have contributed to the thermal differentiation mentioned above (Borrelli et al., 2014; Coxall et al., 2018; Hohbein et al., 2012; Katz et al., 2011; Langton et al., 2016; Scher & Martin, 2008). Whether these modern‐style circulation features suggested by data are reproduced by model studies, and to what intensity, largely varies with model setup and boundary conditions. Notably, the choice of geography (modern or Eocene) and pCO2levels plays an important role in explaining the diversity of the results.
Furthermore, many studies have focused on surface processes, thus limiting comparison to geochemical proxies.
Several modeling studies have aimed to understand the effect of the DP opening by evaluating its role in mod-ern ocean circulation. These studies use a present‐day geography (England et al., 2017; Mikolajewicz et al., 1993; Nong et al., 2000; Sijp & England, 2004, 2005), or an idealized geography such as aquaplanet with idealized con-tinental barriers (Toggweiler & Bjornsson, 2000), and modern pCO2levels. These experiments have shown a
significant relationship between the opening stage of the DP and the existence and intensity of the ACC and NADW, with a strength of the ACC close to modern observations (between 136.7 ± 6.9 Sv and 173.3 ± 10.7 Sv, Donohue et al., 2016; Firing et al., 2011; Meredith et al., 2011; e.g., 140 Sv, Sijp & England, 2004). While a closed DP inhibits the formation of NADW, opening of the DP leads to the onset of deepwater formation in the Northern Hemisphere (Mikolajewicz et al., 1993; Nong et al., 2000; Sijp et al., 2009; Sijp & England, 2004, 2005; Toggweiler & Bjornsson, 2000). A decrease in sea surface temperature (SST) of as much as 10°C can be produced as a result of these circulation changes (Sijp & England, 2004). Despite the importance of these modeling studies in providing a conceptual understanding of the impact of an open DP on modern oceans, their suitability to represent Eocene ocean changes is questionable. It is expected that stu-dies performed with modern geography and low pCO2concentrations reproduce an ocean circulation similar
to present day with near‐modern ACC, AMOC, and NADW intensities. As an intermediate step into Eocene‐like boundary conditions, some studies have used higher pCO2and/or modified modern geographies
with key differences such as an open Panama Seaway (e.g., Cristini et al., 2012; Elsworth et al., 2017; Ladant et al., 2018; Sijp et al., 2009, 2011; Yang et al., 2014; Zhang et al., 2010). The use of an adequate paleogeography is particularly important, as it impacts ocean circulation and properties (e.g., temperature and salinity distribu-tion; see Yang et al., 2014; Zhang et al., 2010). For instance, the closure of the Central American Seaway and the Arctic Ocean and the subsidence of the Greenland Scotland Ridge have been described as causal mechanisms for NADW onset because of their impact on North Atlantic salinity (e.g., Abelson & Erez, 2017; Hutchinson et al., 2018, 2019; Ladant et al., 2018; Mikolajewicz et al., 1993; Sepulchre et al., 2014; Stärz et al., 2017). Experiments with the UVic intermediate complexity model (energy balanced model for atmosphere) and increased pCO2alone still describe a strong impact of DP opening on ocean meridional overturning circulation
and climate, notably on surface temperatures (Sijp et al., 2009, 2011). Conversely, DP opening in the low‐resolution FOAM general circulation model produces a smaller impact in terms of temperature and ocean circulation in an Eocene configuration with high CO2levels compared to a modern one (Zhang et al., 2010).
Recent studies have also addressed the question of the DP opening effect on climate using realistic middle Eocene to early Oligocene boundary conditions (Goldner et al., 2014; Hutchinson et al., 2018; Kennedy
et al., 2015; Kennedy‐Asser et al., 2019; Vahlenkamp et al., 2018). These studies describe an ACC with a mod-erate intensity during the Eocene/Oligocene (around 4 to 46.2 Sv; Kennedy et al., 2015), which strengthens as a result of pCO2decrease, Antarctic Ice Sheet formation, and opening of the Southern Ocean (up to 89 Sv;
Hill et al., 2013; Kennedy et al., 2015; Ladant et al., 2014a; Lefebvre et al., 2012; Zhang et al., 2010). Among these studies, the impact of DP opening on temperatures is variable with either a regional cooling of the Atlantic sector of the Southern Ocean (up to 6°C; Kennedy et al., 2015; Kennedy‐Asser et al., 2019) or quasi‐insignificant temperature changes (<1°C) (e.g., Goldner et al., 2014; Inglis et al., 2015; Zhang et al., 2010). Goldner et al. (2014) have illustrated the particularly weak contribution of the opening of Southern gateways to EOT ocean temperature changes, in comparison to pCO2decrease or Antarctic Ice Sheet build‐up. Finally,
Northern Hemisphere geography, and especially Arctic geometry, is determinant in the presence or absence of NADW formation, regardless of the configuration of Southern gateways (Hutchinson et al., 2019, 38 Ma paleogeography; Vahlenkamp et al., 2018, 56–47.8 Ma paleogeography).
In light of these elements, DP opening is an intermediate stage in the conditions necessary for the onset of modern‐like ocean circulation but with a variable, and to some degree model‐dependent effect, on ocean temperatures and a high sensitivity to geography. In this paper, we investigate the contribution of DP open-ing to Eocene ocean changes suggested by geochemical data usopen-ing the IPSL‐CM5A2 Earth System Model (ESM) and realistic Eocene boundary conditions. We perform four simulations with different DP depths (closed, 100, 1,000 and 2,500 m) and explore the impact of DP opening on the ocean circulation and subse-quent temperature changes.
2. Methods
2.1. The Model
We use the IPSL‐CM5A2 ESM (Sepulchre et al., 2019), which is built upon IPSL‐CM5A‐LR; the CMIP5 ESM developed at IPSL (Institut Pierre‐Simon Laplace, Dufresne et al., 2013). As IPSL‐CM5A‐LR, it is composed of the LMDZ atmospheric model (Hourdin et al., 2013), the ORCHIDEE land surface and vegetation model (Krinner et al., 2005), and the NEMO ocean model (NEMO v3.6, Madec, 2008), which include modules for ocean dynamics (OPA8.2, Madec, 2008), biogeochemistry (PISCES, Aumont et al., 2015), and sea ice (LIM2, Fichefet & Morales‐Maqueda, 1997). Atmospheric and oceanic grids are connected via the OASIS coupler (Valcke, 2006). The atmospheric grid has a horizontal resolution of 3.75° longitude × 1.875° latitude (96 × 95 grid points) and is divided into 39 vertical levels. The ocean domain is an irregular tripolar grid (ORCA2, Madec & Imbard, 1996) with a nominal 2° resolution refined latitudinally up to 0.5° in the tropical region (Dufresne et al., 2013). The ocean is composed of 31 vertical levels whose thickness ranges from 10 m at the surface to 500 m at the bottom. For more detailed descriptions of the model and its different compo-nents, the reader is referred to Sepulchre et al. (2019).
2.2. Experimental Design 2.2.1. Boundary Conditions
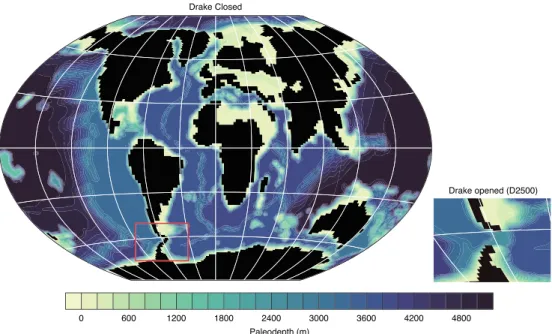
In order to investigate the role of DP opening on ocean circulation and climate, we perform four simulations with different DP depths (Table 1). These simulations use a 40 Ma paleogeography (Figure 1; see Tardif et al., 2020) and a pCO2concentration of 1,120 ppm (four times preindustrial atmospheric levels, PALs)
typi-cal of middle Eocene values (Anagnostou et al., 2016; Beerling & Royer, 2011). Antarctica is ice free because prescribed pCO2levels are above the threshold for perennial polar glaciation in the Eocene (DeConto &
Pollard, 2003; Ladant et al., 2014b). Orbital parameters and other boundary conditions are left at their pre-industrial values.
The different Eocene simulations arefirst compared together to identify the effects of the DP depth on ocean dynamics and properties. Then, as a second step, the simulations are compared to a preindustrial simulation (CTRL) and another one in which atmospheric pCO2is increased to 1,120 ppm (CTRL‐4X). This allows us to
have a modern reference frame and to assess the relative importance of both geography and pCO2on the
modern behavior of ocean circulation.
2.2.2. Model Steady State
To what extent the model has reached steady state need to be assessed when analyzing deep ocean circu-lation (e.g., Kennedy‐Asser et al., 2019). Our Eocene simulations are run for 4,000 years, and we use four metrics as indicator of steady state: (1) stability of ocean temperatures at different depths (Figure 2), (2)
water conservation through time, (3) stability of the main water masses studied (AABW and ACC, Figures 2 and S1 in the supporting information), and (4) ideal age of ocean waters (Figures S2 and S3), which is estimated using 5,000 yearlong off‐line age tracer simulations forced by the last 100 years climatology of each fully coupled simulation. At the end of model integration, temperatures indicate quasi‐equilibrium with small trends persisting (<0.1°C/century) in the deep ocean (Figure 2). This criterion is frequently used as indicative of near equilibrium (e.g., Hutchinson et al., 2018; Ladant et al., 2018; Lunt et al., 2017), although the elimination of these trends with further integration would be ideal. The model exhibits only a negligible drift in global salinity (less than 2 cm/century eustatic sea level equivalent change) linked to the not fully conservative LIM2 sea ice model (Sepulchre et al., 2019). In addition, the mean annual intensity of the ACC and the Southern Hemisphere overturning has stabilized by the end of the integration (Figure 2). Finally, the off‐line age tracer simulations show that the oldest water age in the Pacific, Atlantic, and Indian basins is found in the Drake Closed simulation and reaches ~2,500 years, which suggest that the global overturning of the ocean was completed at least once over the simulation integration time (Figures S2 and S3). The results shown in this study are averages of the last 100 years.
Table 1
Experimental Design and Volumetric Flow Rate Through the Drake Passage
DP depth (m) pCO2(ppm) AIS Geography DPflux (Sv) Simulation length (year)
DC 0 1,120 no 40 Ma / 4,000
D100 100 1.3 (sd = 0.2)
D1000 1,000 21.8 (sd = 1.2)
D2500 2,500 33.9 (sd = 3.1)
CTRL Modern 280 yes Modern 109.7 (sd = 8.7) 2,700
CTRL‐4X 1,120 no 147.3 (sd = 11.2) 3,000
Note. Fluxes were calculated through the Drake Passage (DP), as averages of the last 100 years. They are given in Sverdrups (Sv: 106m3s−1) and correspond to averages over the last 100 years. Abbreviations: ppm = parts per million; sd = standard deviation over the same period (last 100 years).
Figure 1. Eocene bathymetry (40 ma) used in the different modeling experiments. The red square indicates the Drake Passage (DP) location. It is in a closed configuration (DC) on the global map. The bottom‐right figure shows an enlargement of the maximum opening of the DP used in this study (2,500 m, D2500).
3. Results
3.1. Changes in Ocean Dynamics
With a closed DP, the main upper oceanic circulation patterns of the Southern Ocean can be described as follows (Figure 3). An eastward current, fed by the Brazil and Agulhas currents, exists between South America and Australia. This eastward flowing current splits into two parts westward of Australia, one branch flows South and the other, to a lesser extent, flows North. Upper ocean waters crossing the Tasmanian Gateway then circulate northward and join the East‐Australian Current to finally enter the Ross Gyre or circulate out of the Southern Ocean along the western South America margin. Some South Pacific waters are transferred to the Indian section of the Southern Ocean through the Antarctic Counter Current. As the DP opens, the South Atlantic eastward transport increases, the branch south of Australia strengthens and stops the Antarctic Counter Current, the Ross Gyre weakens, and a continuous current (Proto‐Antarctic Circumpolar Current) encircles Antarctica. This circulation diminishes inputs of the Brazil and Agulhas currents into the Southern Ocean.
In the 40 Ma experiments (D100, D1000, and D2500), horizontalfluxes simulated across the DP are weak (maximum 33.9 Sv) but show some substantial changes owing to deepening of the DP. A maximum
Figure 2. Global mean annual temperature evolution for the different Eocene experiments at (a) 0–10 m, (b) 169–238 m, (c) 863–1,203 m, and (d) 2,054–3,011 m and Antarctic Circumpolar Current (ACC) and Antarctic Bottom Water (AABW) evolution through simulation time (e, f). Fluxes are given in Sverdrups (Sv: 106m3s−1). ACC is measured as the transport through the Drake Passage. AABW represents the maximum overturning in the southern hemisphere deep ocean (below 1,500 m).
difference of 32.6 Sv is observed between D100 and D2500. Simulations with a modern geography exhibit a stronger ACC, comparable to published estimations (between 136.7 ± 6.9 Sv and 173.3 ± 10.7 Sv; Donohue et al., 2016; Firing et al., 2011; Meredith et al., 2011). The transport through the DP is larger in CTRL‐4X than in CTRL. This result suggests a positive impact of pCO2on ACC strength with a modern geography. The
different mechanisms driving this westward circulation will be introduced and their respective roles discussed in section 4.2.
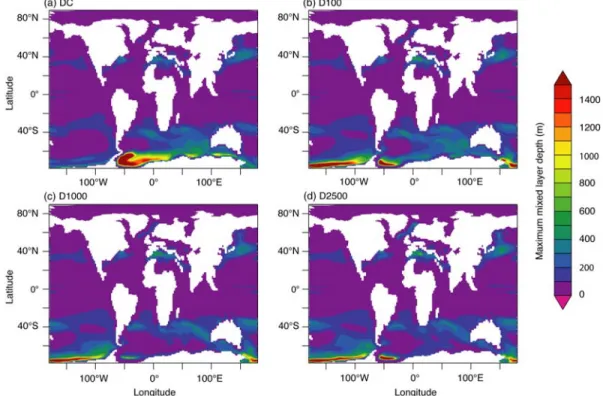
At 40 Ma, all deep convection takes place in the Southern Hemisphere whereas mixed‐layer depths (MLDs) in the Northern Hemisphere do not exceed 500 m (Figure 4). When the DP is closed, sinking occurs in the Atlantic sector of the Southern Ocean and to a lesser extent in the Indian sector (Figure 4). DP opening reduces the depth of these convection zones. Deep convection persists in a small area of the Weddell Sea but completely ceases in the Indian sector of the Southern Ocean (Figure 4). In contrast, new deep convec-tion areas develop in the Pacific sector of the Southern Ocean.
With a closed DP, the meridional overturning circulation is essentially restricted to intermediate waters (<1,500 m depth) in the Atlantic Basin (Figure 5). Despite significant deep sinking in the Weddell Sea, mer-idional water transport is weak. When the DP opens, as deep convection shifts to the wider and deeper Pacific Ocean basin, a larger and more intense Southern Hemisphere overturning cell forms and expands northward up to 40°N. These changes in convection zones and meridional transport occur even for shallow DP depths (D100). As the DP deepens (D100 to D2500),flow of Antarctic Intermediate Waters (AAIW; here defined as the maximum of the absolute overturning of the Southern Hemisphere <1,500 m deep waters)
Figure 3. Annually 0–300 m depth averaged current velocity through the Southern Ocean for DC (a, b) and D2500 (c, d). (c) and (d) correspond to qualitative reconstructions of the main water masses present in this area. The dashed lines indicate 40°S and 60°S latitude rings. Abbreviations: BC = Brazil Current; AC = Agulhas Current; WG = Weddell Gyre; RG = Ross Gyre; ACoC = Antarctic Counter Current; EAC = East Australian Current; proto‐ACC = proto‐Antarctic Circumpolar Current.
Figure 4. Maximum monthly mean value of the mixed layer thickness (m).
Figure 5. Global mean annual meridional stream function in Sverdrup (106m3s−1) for (a) DC, (b) D100, (c) D1000, and (d) D2500. The blue‐filled areas denote negative values (anticlockwise circulation), and the areas filled with warm colors correspond to positive values (clockwise circulation).
diminishes; Antarctic Bottom Waters (AABW; here defined as the maximum of the absolute overturning of the Southern Hemisphere >1,500 m deep waters) sink deeper, and overall maximum overturning is reduced. In all the Eocene experiments, the Southern Hemisphere drives the meridional overturning circulation. There is no source of deep or intermediate waters in the Northern Hemisphere (Figures 4, 5, and S4). More freshwater is routed to the high latitudes (poleward of 50°) in the Northern Hemisphere than in the Southern Hemisphere regardless of the configuration of the DP. The North Atlantic basin receives ~42% more freshwater than the South Atlantic, and the North Pacific basin receives ~36% more freshwater than the South Pacific (Table S1). These larger freshwater fluxes in the northern high latitudes are primarily related to larger runoff inputs in the northern basins (Table S1) and participate to the freshening of surface waters, increasing their buoyancy.
3.2. Change in Ocean Properties and Antarctica Climate
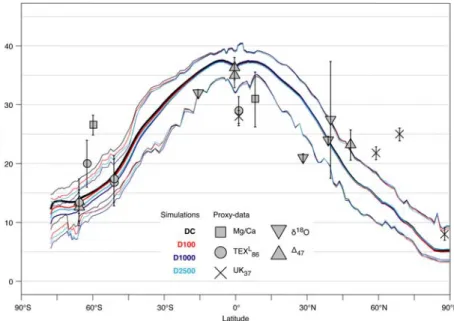
In addition to the ocean circulation changes described above, DP opening also affects ocean properties. With a closed DP, the mean annual global SST is 28.6°C. The opening of the DP has little effect on mean annual global SST even with a 2,500 m depth (<0.5°C; Figure 6 and Table 2). However, at a regional scale (40–80°S), the opening of DP results in significant changes, which differ from one basin to another. SSTs decrease simi-larly in the Atlantic and Indian sectors of the Southern Ocean when the DP is open to 100 m (1.2°C in each basin; Table 2). But the effect of DP opening on Southern Ocean temperatures is not linear. Opening from 100 to 1,000 m indeed produces more of a cooling effect (1.7°C in average across the Southern Ocean, locally up to 5.8°C in the Kerguelen Plateau area) than opening from 1,000 to 2,500 m (in fact, the Southern Ocean even warms slightly on average; Table 2). In contrast, the Pacific sector of the Southern Ocean exhibits a large warming zone surrounded by cooling areas (Figure 6), but there is no clear tendency for warming or cooling with DP deepening (Table 2). The SST reconstructed with our simulations are in a moderate agree-ment with proxy‐data reconstructions for the late‐middle Eocene (Figure 7; data compilation from Tardif et al., 2020, modified after Baatsen et al., 2020). Although most estimates are within our confidence interval, which represents the longitudinal range of annual temperatures, there is a tendency to underestimate high‐latitude temperatures and overestimate low‐latitude temperatures for all the simulations. Because it
Figure 6. Mean annual sea surface temperatures (°C) for (a) DC and in anomaly with DC for (b) D100, (c) D1000, and (d) D2500.
results on average in a cooling of the Southern Ocean (Table 2), the opening of the DP tends to strengthen the latitudinal temperature gradient in the Southern Hemisphere (Figure 7). Changes in surface temperature effect are well explained by changes in Southern Ocean deep convection changes and their evolution on both sides of the DP as the DP deepens. On the one hand, deep water sinking in the Pacific Southern Ocean tends to attract lower‐latitude warm surface waters toward the Southern Ocean. On the other hand, the decline of Weddell Sea and South Indian convection induces a decrease in heat transfer toward this other sector of the Southern Ocean. After the main convection zone shifts from the Atlantic to the Pacific sector, the Weddell convection is suppressed, whereas Ross Sea convection only slightly weakens (Figure 4). A slight increase in sea surface salinity is observed through most of the ocean with DP deepening. In the Southern Ocean, salinity changes follow the same trends as sea surface temperatures (i.e., an increase in the Pacific sector of the Southern Ocean and a decrease in the Atlantic sector of the Southern Ocean; see Figure S5).
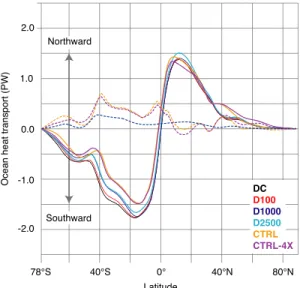
In the DC experiment, global ocean heat transport (OHT) is asymmetric with stronger transport toward the Southern Hemisphere than toward the Northern Hemisphere (Figure 8; on average ~30% higher than in modern experiments 10–65°S). Opening the DP shifts the OHT toward a modern state and induces a net southward OHT decrease (13.4%) between 10°S and 60°S.
Table 2
Sea Surface and 2 m Atmospheric Temperatures
Sea surface temperatures 2 m atmospheric temperatures
SST SO PSO ASO ISO SAT Ant. Ant. JAS Ant. JFM
DC 28.6 18.1 17.3 17.4 20.4 26.7 6.0 −6.7 21.3
D100 28.3 17.7 17.5 16.3 19.2 26.4 4.6 −8.2 20.3
D1000 28.1 16.5 16.9 14.9 17.0 26.3 3.7 −8.9 19.1
D2500 28.1 17.0 17.4 15.6 17.4 26.2 3.7 −9.6 19.8
Note. Mean annual surface temperatures (°C) are given as global mean (SST) or averaged over the Southern Ocean (40–80°S, SO) and its different sectors: Pacific (PSO), Atlantic (ASO), and Indian (ISO). Atmospheric 2 m temperatures (°C) are given as annual mean averaged globally (SAT) or over Antarctica (Ant.). Ant. JAS and JFM represent the aus-tral winter and summer mean, respectively.
Figure 7. Latitudinal Sea surface temperature gradient (°C). Bold lines are annual mean values; the thinner lines indicate the highest and lowest annual mean values for a given latitude. Data are late‐middle Eocene SST from Tardif et al. (2020) after Baatsen et al. (2020).
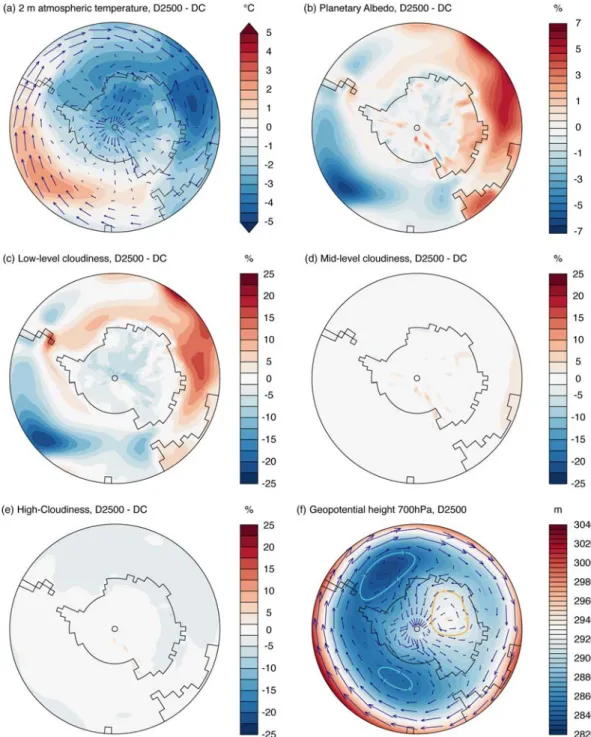
DP opening and the formation of a proto‐ACC also affect Antarctic continental climate. Our simulations exhibit a 1°C to 4°C cooling in the 2 m air temperatures with largest values occurring over the Atlantic sector of continental Antarctica (Table 2 and Figure 9), even though the largest absolute change occurs over the Indian sector of the Southern Ocean. In conjunction with the changes in deepwater formation areas, changes in low cloud cover contribute to cooling the Indian sector of the Southern Ocean by increasing planetary albedo (Figure 9). The existence of two low‐pressure cells located over deepwater formation areas in the modern Weddell and Ross Seas in D2500 (Figure 9) and a higher‐pressure cell in the Indian sector of Antarctica leads to polewardflow of Atlantic‐Indian air masses, car-rying the Indian cooling signal to Antarctica. This atmospheric reor-ganization explains why the Antarctic continent cools rather than warms, even if the Southern Ocean exhibits both cooling and warm-ing zones.
The simulated Antarctic cooling in our simulations is comparable to that of Kennedy‐Asser et al. (2019), who simulate a cooling of 3°C in Antarctica for comparable boundary conditions. This result is also consistent with studies suggesting that the opening of the DP may have contributed to create favorable climatic conditions for the onset of the Antarctic Ice Sheet but was likely not the main direct catalyst of this event (DeConto & Pollard, 2003; Ladant et al., 2014b).
Opening the DP leads to the cooling of most deep ocean waters (here defined as waters below 1,500 m; Figure 10). The Atlantic, Indian, and Pacific Ocean temperatures drop by as much as 2.5°C in some areas. These temperature changes are rather constant across latitudes for any given depth in the Pacific and Indian Oceans, but the cooling is stronger at southern middle to high latitudes in the Atlantic basin. The cooling of deep waters is accompanied by warming of intermediate waters (i.e., between 300 and 1,500 m) in all basins (locally as much as 4.5°C). This warming extends from the basins' northernmost latitudes down to 40°S for the Atlantic and Indian Ocean and 60°S for the Pacific Ocean. This pattern is consistent with the deepening of the meridional stream function, which is the result of the initiation of deepwater production in the South Pacific, and reduction in deepwater formation in the South Atlantic when the DP opens. The existence of a MOC in the wide and deep Pacific basin, in addition to the diminished Atlantic MOC, reduces the imprint of the Atlantic MOC on overall ocean circulation and physical properties, leading to a warming of North Atlantic intermediate and deep waters and a cooling of Pacific and Indian deep waters (Figure 5). These vertical cooling and warming patterns are observed in all DP opening experiments (D100 to D2500). Cooling or warming intensity depends on gateway depth but does not vary linearly, with the strongest differences occurring in D1000, as is also the case for surface temperatures (Figure S6).
Following the water temperature and salinity changes mentioned above, potential water density and sure gradients increase in the Southern Ocean (Figure 11). In the latitudinal band of 65°S to 45°S, the pres-sure gradient increases from 0.5 kg/m3in DC to 0.6 kg/m3in D2500 and to 0.9 kg/m3in CTRL‐4X at 400 m depth and from 0.2 kg/m3in DC and D2500 to 0.5 kg/m3in CTRL‐4X at 800 m depth.
In order to better understand the behavior of the proto‐ACC, Southern Hemisphere horizontal surface wind changes were also tracked (Figure 11). Indeed, horizontal surface winds are often given a key role in explain-ing ACC strength, notably, the westerlies that directly blow on this current (Scher et al., 2015). Compared to modern simulations, Eocene experiments have weaker winds and a more equable distribution across lati-tudes. Because of steeper temperature gradient and the presence of the Antarctic ice sheet, CTRL shows stronger polar easterlies (south of the DP), and the maximum intensity zone of the westerlies is located ~5° further north. A few differences are observed as the DP depth is increased. The westerlies (~50–30°S) and polar easterlies (south of the DP) are slightly strengthened, with a maximum difference of 0.6 and 1.1 m s−1, respectively (D2500 minus DC).
Figure 8. Global mean annual total heat transport (PW: Petawatt = 1015W). Heat transport is calculated as the sum of latitudinal advective and diffusive transports. Dashed lines indicate anomalies with respect to the DC experiment.
4. Discussion
4.1. Results Summary
Opening the DP impacts Southern Hemisphere ocean dynamics and properties in several ways. First, it leads to the formation of a continuous proto‐ACC, which leads to a modification of surface temperatures and sali-nities patterns across the Southern Ocean. Second, an open DP favors deep convection in the Pacific sector of the Southern Ocean instead of the Atlantic and Indian sectors. Third, it strengthens the meridional overturn-ing circulation. Fourth, it induces cooloverturn-ing of most of Pacific and Indian Ocean deep waters but induces an asymmetric cooling in the Atlantic Ocean, in which only South Atlantic deep waters cool whereas North Atlantic deep waters warm. Some of these changes may characterize the transition from an Eocene to a modern ocean.
In the following section, we discuss the implications of our results for the evolution of ocean properties and dynamics described by proxy data and compare our results with previous modeling work. We focus in par-ticular on the onset of the ACC, on South Atlantic cooling and on the initiation of NADW. It is worth noting that some previous studies have focused on the role of other potential controls on the Eocene ocean circula-tion, such as the opening of the Tasmanian Gateway or the development of the Antarctic Ice Sheet (e.g., Goldner et al., 2014; Huber et al., 2003, 2004; Kennedy et al., 2015; Kennedy‐Asser et al., 2019), but, as these controls remain constant in our experiments, we mainly discuss our results with respect to previous work focusing on the oceanic impact of changes in DP depth.
4.2. Proto‐ACC Onset
4.2.1. Formation of the Proto‐ACC
Our results are consistent with inferences from proxy‐based data studies that describe a complete but mod-erate proto‐ACC during the late Eocene (Borrelli et al., 2014; Scher & Martin, 2004, 2006). In our closed DP experiment, circulation through the TG consists of an eastward branch from the Atlantic in the North of the passage and a westward branch (the Antarctic Counter Current)flowing along the margins of Antarctica. When the DP is open, the eastward transport through the TG strengthens, and the Antarctic Counter Current ceases to exist (Figure 3). This circulation pattern is in agreement with former studies showing a
Figure 10. Mean annual meridional temperatures for (left column) Pacific Ocean, (middle column) Atlantic Ocean, (right column) Indian Ocean, and from the top to the bottom: DC, D2500, and the anomaly D2500 minus DC. The white vertical line represents the equator.
westward exchange during the middle Eocene (Bijl et al., 2013; Huber et al., 2004; Sijp et al., 2016) and its cessation with DP opening (Sijp et al., 2016).
Multiple terms exist to qualify the earliest stages of the ACC. Borrelli et al. (2014) make the distinction between a“Drake Throughflow” and a “proto‐ACC” depending on the current trajectory and depth around Antarctica. The“proto‐ACC” encircles Antarctica but is shallower than the modern ACC. In our Eocene simulations, water transports of 1.3 to 33.9 Sv through the DP are by far weaker than the modern ACC (observed: 136.7 ± 6.9 Sv and 173.3 ± 10.7 Sv, Donohue et al., 2016; Firing et al., 2011; Meredith et al., 2011, or simulated: 108.9 Sv in CTRL). Nevertheless, this weak eastward current exists around Antarctica in our open DP simulations even for shallow DP depths, consistent with the concept of a proto‐ACC. A proto‐ACC circulation is supported by changes in the εNd signatures of the South Atlantic and South Indian Oceans by 37–41 Ma (Pfister et al., 2014; Scher & Martin, 2004, 2006; Wright et al., 2018). Furthermore, other evidence fromεNd and δ13C isotopes suggests the initiation of a modern‐like ACC later, between the early Oligocene (Katz et al., 2011; Scher et al., 2015), late Oligocene (Borrelli et al., 2014), and the Oligocene‐Miocene boundary (Scher & Martin, 2008). The simulated transport intensities across the DP in our Eocene simulations are also within the range of previous model studies using similar Eocene bound-ary conditions with reported values ranging from 4 to 46.2 Sv (Hutchinson et al., 2018; Kennedy et al., 2015; Ladant et al., 2014a; Zhang et al., 2010). Together, our results agree with former comparable modeling
Figure 11. Pressure gradient changes and surface wind. Globally averaged ocean meridional potential water density (kg/m3) for (a–d) the different Eocene experiments, (e) modern CTRL experiment, and (f) CTRL‐4X experiment. The numbers written on each figure correspond to water potential density of this zone. Each line represents a water potential density decrease of 0.1 kg/m3. The right part of thefigure (g) shows the meridional distribution of zonal wind at a 10 m altitude (m s−1) for the different Eocene and modern simulations. Positive values indicate eastward winds, and negative values westward winds. Proto‐ACC flow and modern ACC flow indicate the maximum strength zone of the ACC in D2500 and CTRL simulations respectively.
studies and geochemical records to indicate that a proto‐ACC formed before the EOT, as soon as the DP started to open.
4.2.2. Driving Factors of Proto‐ACC Intensity
The difference in ACC intensity between our Eocene scenarios and the two simulations with a modern geo-graphy suggests a significant sensitivity to changes in geogeo-graphy. The DP is located in the Scotia arc, a com-plex tectonic region in which the Scotia Plate, the Antarctic Plate, and the South American Plate interact together through a set of subductions zones and transform faults (Barker, 2001; Dalziel et al., 2013; Eagles & Scott, 2014). Related to the development of the Scotia Plate, DP opening would have taken place gradually, starting about 50 Ma ago (Eagles et al., 2006; Livermore et al., 2005). Thefirst evidence of seafloor spreading indicates the formation of a shallow (<1 km) connection between Pacific and Atlantic oceans around 41 Ma, but such passage was probably narrow and tortuous before 30 Ma (Eagles & Jokat, 2014). The presence of a continuous wide and deep passage (100–300 km width, >2.5 km depth) is documented around 26–20 Ma (Eagles & Jokat, 2014). However, the past position of the blocks that form this region and its paleogeography remains poorly constrained (Barker, 2001; Eagles, 2010; Galindo‐Zaldívar et al., 2014), hampering direct comparison with data (Sijp et al., 2014). Nd‐isotope signatures from the Kerguelen Plateau and locations around the Antarctic continent do not suggest major oceanographic changes related to DP opening before 44 Ma (Huck et al., 2017) or after ~36 Ma (Wright et al., 2018), suggesting that sufficient opening of the DP to allow water mass mixing took place in the middle Eocene (Wright et al., 2018). Nd‐isotope data from two locations in the Atlantic sector of the Southern Ocean, OPD Sites 1090 and 689, exhibit a positive shift between 42 and 39 Ma, superimposed on an increasing trend, suggesting an influx of shallow Pacific waters carrying a more radiogenic Nd‐isotope signature (Scher & Martin, 2004, 2006). Finally, a middle Eocene sur-face opening of the DP is supported by multivariate analyses of dinoflagellate cyst occurrences at sites in the DP area (Estebenet et al., 2014).
Besides the degree of opening of the DP, the depth of the Tasmanian Gateway and the Kerguelen Plateau might limit the proto‐ACC strength (Hill et al., 2013; Scher et al., 2015). The Kerguelen Plateau formation is related to volcanic activity. It started in the Cretaceous for its southern and central parts and ~40 Ma for its northern part (Wright et al., 2018). During the Eocene, most of the northern parts of the plateau were submarine (~870 m), and the southern part reached between ~1,200 and 2,250 m below sea level (Wright et al., 2018). In our paleogeographic reconstruction (40 Ma; see Tardif et al., 2020), the Kerguelen Plateau is shallower than at the present day (mostly 1,000 to 1,500 m depth, locally up to 400 m), and the Australian and Antarctic continents are closer. Our reconstructed depth for the Tasmanian Gateway varies between 500 and 600 m near the continental margins and between 1,000 and 2,500 m in its central part, which may favor water exchange, althoughflow remains very low compared to modern. Studies based on dinocyst distribution patterns suggest an initial TG opening during the early Eocene ~49–50 Ma (Bijl et al., 2013), followed by accelerated deepening in the late Eocene (~35.7 Ma; Houben et al., 2019). The latter deepening is consistent with widespread occurrence of unconformities in the Australian‐Antarctic basin through nondeposition or erosion, indicative of bottom current intensification (Sauermilch et al., 2019). Rather than a later date for TG deepening between 35.5 and 33.7 Ma (Carter et al., 2004; Exon et al., 2004; Stickley et al., 2004), changes in temperature (Cramwinckel et al., 2018) and pCO2(Anagnostou et al., 2016),
and/or northward movement of the Tasmanian region (Scher et al., 2015), may explain oceanographic changes near the EOT (Houben et al., 2019).
In addition to the depth of suboceanic structures, it has been proposed that the latitudinal distribution of land barriers and gateways was critical in determining ACC strength (e.g., Hill et al., 2013; Scher et al., 2015; Stickley et al., 2004). The importance of latitudinal structures has been called into question because the modern ACC meanders between the latitudes of the DP and the latitudes of maximum wind stress (Allison et al., 2010; Rintoul et al., 2001), such as in the Malvinas Current region to the east of Argentina. Interestingly, our open DP simulations exhibit a similar current system that meanders across latitudes (Figure 3).
Although the depth and width of the DP may be the dominant control on differences in water transport through the DP between simulations (e.g., Kennedy et al., 2015; Sijp & England, 2004; Yang et al., 2014; Zhang et al., 2010), other parameters may contribute to ACC intensity, in particular the meridional density gradient and wind stress (Gent et al., 2001; Lefebvre et al., 2012; Marshall et al., 2016). Using an eddy‐permitting ocean model in an idealized channel configuration, Munday et al. (2015) suggest that the absence of overlapping continental barriers is not a necessary condition for strong circumpolar transport.
However, the number of continental barriers, their latitudinal location, and whether they are overlapping may act on ACC strength by impacting its sensitivity to wind stress (Munday et al., 2015). In our simulations, the majority of wind strength changes between D2500, CTRL, and CTRL‐4X take place within the maximum eastward wind zone where a portion of the proto‐ACC flows (Figure 9). This variable sensitivity of the ACC to wind stress might exist in our results but would need additional sensitivity experiments.
In parallel, proto‐ACC strength correlates with meridional density gradients in our simulations, where the strongest water transport (i.e., D2500, CTRL, and CTRL‐4X) corresponds to the steepest isopycnals (Figure 11). The link between the intensity of the ACC and meridional density gradients has been reported by previous modeling studies (Goldner et al., 2014; Kennedy et al., 2015; Kennedy‐Asser et al., 2019; Ladant et al., 2014a; Lefebvre et al., 2012). Additionally, the latitude of the Southern Hemisphere westerlies (~50–30°S) is slightly displaced to the south, closer to modern ACC flow, which might also contribute to reinforcing the horizontal transport in this simulation (Figure 11).
4.3. Changes in Ocean Properties and Dynamics, and N/S Thermal Differentiation 4.3.1. Surface Temperature Changes
In our experiments, the opening of the DP impacts surface and deepwater temperatures in all basins. Most surface changes occur in the Southern Ocean, which exhibits a dipole pattern, with cooling in the Atlantic and Indian sectors and a warming zone in the Pacific (Figure 6). The presence of a warming zone in part of the Southern Ocean (here in the Pacific) has already been described in previous modeling studies with modern as well as Eocene paleogeographies (Cristini et al., 2012; Sijp & England, 2004; Zhang et al., 2010). It is well explained by changes in the distribution of deep convection zones that impact the southward inflow of warm subtropical waters (Kennedy et al., 2015; Ladant et al., 2018) and by the weakening of the Brazil and Agulhas currents (as seen by Sijp & England, 2004). Our simu-lated temperature changes with cooling in the Atlantic and Indian sectors and warming in the Pacific are similar to those described in previous model studies (Cristini et al., 2012; Zhang et al., 2010). In con-trast to this dipole pattern, a more homogenous and up to 4°C surface atmospheric cooling has been described over southernmost latitudes (Yang et al., 2014).
Our results are in a moderate agreement with proxy‐data SST reconstruction. On the one hand, our model tends to overestimate the latitudinal temperature gradient and to reconstruct colder temperatures than some proxies in the Southern Ocean (Figure 7). This bias is very classical in warm climate reconstructions with GCMs and could be responsible for a discrepancy between absolute SST from our experiments and proxies (see Huber & Caballero, 2011). Studies carried out with more recent versions of GCM, such as CESM and GFDL, show improvements in the representation of this gradient, in particular thanks to a better consideration of cloud physics and other greenhouse gases (Baatsen et al., 2020; Hutchinson et al., 2020; Lunt et al., 2020; Sagoo et al., 2013; Zhu et al., 2019). With close boundary conditions, they reconstructflatter gradients thanks to ~3°C lower SST in equatorial area and up to 2°C to 3°C higher SST at midlatitudes (Figure S7; Baatsen et al., 2020; Hutchinson et al., 2018). Opening the DP tends to rein-force the latitudinal temperature gradient by mainly cooling southern latitudes. It therefore does not cre-ate a better agreement with the absolute surface temperature data for this period. This trend suggests that the DP opening and the implementation of a proto‐ACC may have contributed to the establishment of the modern gradient. On the other hand, multiproxy data indicate warmer SSTs in the Pacific Southern Ocean than in the Atlantic during the middle and late Eocene (Douglas et al., 2014; Hollis et al., 2012; Liu et al., 2009), which is well explained by convection in the Ross Sea and coherent withεNd reconstruc-tions indicating the northward export of Southern Ocean Deep water between 45 and 35 Ma (Douglas et al., 2014; Hague et al., 2012; Thomas, 2004; Thomas et al., 2014). Interestingly, this is not incompatible with locally intensive cooling described near the Tasman Plateau (Bijl et al., 2009; Hollis et al., 2012), since our simulated SST changes in the Pacific sector of the Southern Ocean are heterogeneous with cool-ing areas (around Antarctica).
In studies with modern or near‐modern geographies, significant warming in the Northern Hemisphere, locally up to 6–12°C, is also observed (Elsworth et al., 2017; Sijp & England, 2004; Toggweiler & Bjornsson, 2000; Yang et al., 2014). This warming at northern latitudes is explained by changes in the mer-idional overturning circulation, mainly with the onset of NADW, and a subsequent increase of northward Oceanic Heat Transport (OHT; Elsworth et al., 2017; Sijp & England, 2004; Toggweiler & Bjornsson, 2000;
Yang et al., 2014; Zhang et al., 2010). Therefore, the absence of such a warming in the Northern Hemisphere might be explained by the lack of NADW formation in our experiments. This absence of NADW is discussed in more detail in section 4.4.
4.3.2. Intermediate/Deep Ocean Changes
Our results show a significant impact of the opening of the DP on deep ocean temperatures, which decrease in every basin except the North Atlantic by an amount consistent with earlier modeling work (Najjar et al., 2002; Nong et al., 2000; Sijp et al., 2009). The latitudinal extent of temperature changes is intimately linked to the strength of the meridional circulation (e.g., Goldner et al., 2014; Najjar et al., 2002; Sijp et al., 2011). Here, the northward propagation of cooling in the Pacific Ocean is due to deep convec-tion in the Ross Sea when the DP is open, which shifts the core of the MOC in the Pacific. Conversely, more regional changes in the Atlantic are linked to the weakening of deep convection in the Weddell Sea. Finally, as no deepwater forms in the Indian Ocean in either an open or a closed DP configuration, the cooling trend observed in the Indian Ocean basin comes from transport of cold deep waters from the Pacific (Figure S8). Our results contrast with the findings of Goldner et al. (2014) who show a minor con-tribution of Southern gateway changes to the Atlantic Ocean cooling (because of the opposite effects of DP deepening and Tasman Gateway opening on temperatures), using a configuration with a closed Tasmanian Gateway, which likely explains the significant differences between our studies. Furthermore, in contrast to our Eocene experiments with an open DP, the simulations of Goldner et al. (2014) do not produce a strong overturning circulation, which might limit the effect of any regional temperature change in the Southern Ocean.
Among studies using Eocene geographies, somefind similar results with a shift in deep convection zones and AABW strengthening in response to Antarctic Ice Sheet building (Goldner et al., 2014; Kennedy et al., 2015; Kennedy‐Asser et al., 2019). However, model gateway opening experiments yield different results concerning the stability of deep convection in the Weddell Sea and show that the response might be model dependent and/or rely on paleogeographic differences, notably in the North Atlantic‐Arctic area (Hutchinson et al., 2019; Vahlenkamp et al., 2018).
The deep temperature changes observed among the different basins are in agreement with geochemical proxy reconstructions. In the Atlantic Ocean, several studies have documented thermal differentiation between the North and South Atlantic with an ~2°C cooling of southern high latitudes, represented by an ~0.5‰ δ18Obfdifference, starting between 38.5 and 35 Ma (Borrelli et al., 2014; Coxall et al., 2018; Cramer
et al., 2009; Katz et al., 2011; Langton et al., 2016; Liu et al., 2018). Southern Hemisphere cooling in the Atlantic basin has often been interpreted as an indicator of the onset of a proto‐ACC and of a decreased southward OHT (Borrelli et al., 2014; Katz et al., 2011; Langton et al., 2016). Borrelli et al. (2014) further describe brief warming of North Atlantic deep waters occurring contemporaneously to the thermal differen-tiation (~38.5 Ma) and interpret this warming as the signature of deepwater formation in the Northern Hemisphere. As an alternative to this mechanism, we show that the opening of the DP also limited north-ward cold‐water export into the Atlantic.
The cooling of the deep Indian Ocean by inflow of Pacific waters is consistent with studies that describe an increase of theεNd signature in the Indian Ocean basin and on the Kerguelen Plateau during the mid-dle and late Eocene (Huck et al., 2017; Le Houedec et al., 2012; Martin & Scher, 2006; Scher et al., 2011; Scher & Martin, 2004, 2006), which may be explained by an increased inflow of waters originating from the Pacific, which generally carry a higher εNd signature (Hague et al., 2012; Le Houedec et al., 2016; Scher et al., 2015; Thomas et al., 2014; van de Flierdt et al., 2004). These Pacific waters may either origi-nate from the onset of the ACC or the Indonesian Throughflow (Frank et al., 2006; Martin & Scher, 2006). Interestingly, our simulations indicate a shift in deepwater transport to the Indian Ocean. In a closed DP configuration, deep waters from the Atlantic sector of the Southern Ocean flow through the Indian Ocean toward the Pacific Ocean, whereas in a DP open configuration, the Indian Ocean is filled by deep waters flowing westward from the Pacific Ocean through the Indonesian Throughflow (Figure S8).
Finally, the simulated deep Pacific Ocean cooling is not easily reconciled with geochemical data. Eocene deep ocean temperature reconstructions are scarce for this basin (one equatorial site, ODP 1218) and do not indicate a decrease in deep ocean temperatures during the late Eocene (Borrelli et al., 2014).
4.4. Circulation Changes and the Absence of NADW
Along with the observed N/S thermal differentiation may have come the initiation of NADW formation during the Eocene. The existence of Northern Component Water potentially as early as 38.5 Ma is suggested by changes in North Atlanticδ13C signature of benthic foraminifera at ODP Site 1053 (Borrelli et al., 2014). The authors interpret the highδ13C signal at this bathyal site as evidence for sinking waters in the North Atlantic. Further, the intensification of southward transport by 35 Ma is suggested by the decreasing hor-izontalδ18O gradient between the North and Equatorial Atlantic (Langton et al., 2016; Sites 1053 and 366). In contrast, the multisite study by Coxall et al. (2018) indicates a slightly later onset of Northern Component Water (~35.8–33.8 Ma) because the reduced difference in δ18
O signatures of benthic and plank-tonic foraminifera suggests a decrease in water column stratification and a better convection of the North Atlantic during this period. A change in theεNdsignatures of South Atlantic and Southern Ocean Sites
between the late Eocene and the late Oligocene has been interpreted as increased southward advection of North Atlantic deep water (Scher & Martin, 2008; Via & Thomas, 2006; Wright et al., 2018). Possible con-tourites may also suggest the existence of NADW during the Eocene (Hohbein et al., 2012), although this is debated (Stoker et al., 2013).
Previous model studies using modern geography indicate the onset of NADW formation following DP open-ing (Mikolajewicz et al., 1993; Nong et al., 2000; Sijp et al., 2009; Sijp & England, 2004, 2005; Toggweiler & Bjornsson, 2000; Yang et al., 2014). Several geographic changes might, however, be necessary to simulate the onset of NADW formation, notably the closure of the Panama Seaway and the closure of the Arctic‐Atlantic gateway (Bice et al., 2000; Hutchinson et al., 2018, 2019; Roberts et al., 2009; Vahlenkamp et al., 2018; Yang et al., 2014). As discussed in details by Ladant et al. (2018), there is significant variability in NADW recon-struction among model studies, and the geometry and depth of the Panama Seaway are likely instrumental in the existence of NADW in models using a modern geography (Ladant et al., 2018; Mikolajewicz et al., 1993; Sepulchre et al., 2014; Zhang et al., 2012). In some studies, the Panama Seaway allows for extensive fresh-water transport from the Pacific to the North Atlantic, which decreases North Atlantic seawater density and may limit the onset of NADW formation (Ladant et al., 2018; Sepulchre et al., 2014; Yang et al., 2014; Zhang et al., 2012). In our simulations, surface waters from the Mediterranean Seaflow across the North Atlantic and through the Panama Seaway. This process forms a salt leak in the Pacific Ocean that limits water density in the North Atlantic and may be responsible for the absence of NADW formation.
In experiments with an Eocene paleogeography, the connection between the Arctic Ocean and the North Atlantic has been described as a controlling factor in the onset of NADW formation (Hutchinson et al., 2018, 2019; Roberts et al., 2009; Vahlenkamp et al., 2018). In these experiments, a connection between both basins hampers deep convection in the North Atlantic because of Arctic freshwater inputs. Apparent variability of salinity and ventilation of the Arctic Ocean during the Eocene supports changes in the Arctic and Atlantic connection during Eocene (Brinkhuis et al., 2006; Jakobsson et al., 2007). Alternatively, a number of studies have suggested that subsidence of the Greenland‐Scotland Ridge (GSR) at ~36 Ma was a prerequisite for NADW formation (e.g., Abelson & Erez, 2017; Borrelli et al., 2014; Coxall et al., 2018; Hutchinson et al., 2018; Katz et al., 2011; Stärz et al., 2017). In this hypothesis, deep water forms in the Nordic Seas during the Eocene, but the GSR blocks its southward export (Abelson et al., 2008; Abelson & Erez, 2017). In our paleo-geography, this ridge is sufficiently subsided, but no deep convection occurs in the Northern Hemisphere. Oceanic barriers further south, including the Equatorial Atlantic Gateway and the Rio Grande Rise‐Walvis Ridge barrier, had sufficiently subsided to allow the exchange of deep water between the Atlantic basins and the Southern Ocean before the Eocene (Batenburg et al., 2018; Pérez‐Díaz & Eagles, 2017). Therefore, our results do not support a blocking of NADW export but rather suggest that the absence of NADW formation depends on surface water properties.
The existence of NADW has also been linked to the intensity of the ACC (Langton et al., 2016; Scher & Martin, 2008). Theoretical modeling experiments have shown a relationship between modern ACC and NADW intensities. This so‐called “Drake Passage effect” hypothesis (Toggweiler & Samuels, 1995; see Kuhlbrodt et al., 2007, for a review) is based on a conceptual model in which the MOC and NADW formation are driven by Southern Ocean wind‐driven upwelling, generated by the presence of the ACC. However, the potential covariability of the ACC and the MOC is probably highly dependent on geography and remains to be demonstrated with realistic paleoclimate modeling experiments.
Finally, it is worth noting that previous studies based on modeling (Hutchinson et al., 2018; Thomas et al., 2014) and Nd isotope measurements (Hague et al., 2012; McKinley et al., 2019; Thomas et al., 2014) have suggested the formation of deepwater in the North Pacific during Late Cretaceous/Paleogene. However, the existence of North Pacific Deep Water in the Late Cretaceous/Paleogene Ocean is still debated. Indeed, North Pacific sinking is absent from several recent Eocene ESM simulations (Baatsen et al., 2020; Farnsworth et al., 2019; Kennedy et al., 2015; Lunt et al., 2016; Vahlenkamp et al., 2018). Additionally, recent εNdsamples from the tropical and equatorial Pacific Ocean argue against the possibility of deepwater
forma-tion in the North Pacific until at least the latest Cretaceous (Haynes et al., 2020). Our simulations exhibit sig-nificant runoff freshwater fluxes in this basin, which freshen North Pacific surface waters and render them more buoyant, hampering deep convection in this area.
5. Conclusion
Our simulations of the effect of the opening of the DP on ocean circulation patterns and paleo‐environmental conditions are in a rather good agreement with proxy data. We show that DP opening has a strong effect on Southern Ocean physical properties and dynamics from a depth of 100 m onward. It sets the stage for the formation of a proto‐ACC and initiates changes in deep convection zones and in the meridional overturning circulation. Most deep waters experience cooling, which is characterized by an asymmetric distribution in the Atlantic Ocean. This pattern is in particularly good agreement with proxy‐based reconstructions, which indicate a North/South thermal differentiation in this basin since 38.5 to 37.5 Ma. Therefore, our simulations robustly describe how the Eocene opening of the DP constitutes an important step toward the onset of a global thermohaline circulation similar to the present day.
Data Availability Statement
The key climatological outputs of the simulations are stored in the PANGAEA database (https://doi.pan-gaea.de/10.1594/PANGAEA.915802).
References
Abelson, M., Agnon, A., & Almogi‐Labin, A. (2008). Indications for control of the Iceland plume on the Eocene‐Oligocene “greenhouse‐ icehouse” climate transition. Earth and Planetary Science Letters, 265(1–2), 33–48. https://doi.org/10.1016/j.epsl.2007.09.021 Abelson, M., & Erez, J. (2017). The onset of modern‐like Atlantic meridional overturning circulation at the Eocene‐Oligocene transition:
Evidence, causes, and possible implications for global cooling. Geochemistry, Geophysics, Geosystems, 18, 2177–2199. https://doi.org/ 10.1002/2017GC006826
Allison, L. C., Johnson, H. L., Marshall, D. P., & Munday, D. R. (2010). Where do winds drive the Antarctic Circumpolar Current? Geophysical Research Letters, 37, L12605. https://doi.org/10.1029/2010GL043355
Anagnostou, E., John, E. H., Edgar, K. M., Foster, G. L., Ridgwell, A., Inglis, G. N., et al. (2016). Changing atmospheric CO2 concentration was the primary driver of early Cenozoic climate. Nature, 533(7603), 380–384. https://doi.org/10.1038/nature17423
Aumont, O., Ethé, C., Tagliabue, A., Bopp, L., & Gehlen, M. (2015). PISCES‐v2: An ocean biogeochemical model for carbon and ecosystem studies. Geoscientific Model Development, 8(8), 2465–2513. https://doi.org/10.5194/gmd-8-2465-2015
Baatsen, M., von der Heydt, A. S., Huber, M., Kliphuis, M. A., Bijl, P. K., Sluijs, A., & Dijkstra, H. A. (2020). The middle‐to‐late Eocene greenhouse climate, modelled using the CESM 1.0.5. Climate of the Past Discussions, 1–44. https://doi.org/10.5194/cp-2020-29 Barker, P. F. (2001). Scotia Sea regional tectonic evolution: Implications for mantleflow and palaeocirculation. Earth‐Science Reviews,
55(1–2), 1–39. https://doi.org/10.1016/S0012-8252(01)00055-1
Batenburg, S. J., Voigt, S., Friedrich, O., Osborne, A. H., Bornemann, A., Klein, T., et al. (2018). Major intensification of Atlantic over-turning circulation at the onset of Paleogene greenhouse warmth. Nature Communications, 9(1), 4954–4958. https://doi.org/10.1038/ s41467-018-07457-7
Beerling, D. J., & Royer, D. L. (2011). Convergent cenozoic CO2 history. Nature Geoscience, 4(7), 418–420. https://doi.org/10.1038/ngeo1186 Bice, K. L., Scotese, C. R., Seidov, D., & Barron, E. J. (2000). Quantifying the role of geographic change in Cenozoic Ocean heat transport using uncoupled atmosphere and ocean models. Palaeogeography, Palaeoclimatology, Palaeoecology, 161(3–4), 295–310. https://doi.org/ 10.1016/S0031-0182(00)00072-9
Bijl, P. K., Bendle, J. A. P., Bohaty, S. M., Pross, J., Schouten, S., Tauxe, L., et al. (2013). Eocene cooling linked to earlyflow across the Tasmanian gateway. Proceedings of the National Academy of Sciences, 110(24), 9645–9650. https://doi.org/10.1073/
pnas.1220872110
Bijl, P. K., Schouten, S., Sluijs, A., Reichart, G.‐J., Zachos, J. C., & Brinkhuis, H. (2009). Early Palaeogene temperature evolution of the Southwest Pacific Ocean. Nature, 461(7265), 776–779. https://doi.org/10.1038/nature08399
Borrelli, C., Cramer, B. S., & Katz, M. E. (2014). Bipolar Atlantic Deepwater circulation in the middle‐late Eocene: Effects of Southern Ocean gateway openings. Paleoceanography, 29, 308–327. https://doi.org/10.1002/2012PA002444
Brinkhuis, H., Schouten, S., Collinson, M. E., Sluijs, A., Damsté, J. S. S., Dickens, G. R., et al. (2006). Episodic fresh surface waters in the Eocene Arctic Ocean. Nature, 441(7093), 606–609. https://doi.org/10.1038/nature04692
Carter, R. M., McCave, I. N., & Carter, L. (2004). Leg 181 synthesis: Fronts,flows, drifts, volcanoes, and the evolution of the southwestern gateway to the Pacific Ocean, eastern New Zealand. In C. Richter (Ed.), Proc. ODP, Sci. Results, 181 (pp. 1–111). College Station, TX: Ocean Drilling Program. https://doi.org/10.2973/odp.proc.sr.181.210.2004
Acknowledgments
We sincerely thank Matthew Huber for his editorial handling and two anonymous reviewers for their interesting comments that improved the quality of this article. We thank the CEA/CCRT for providing access to the HPC resources of TGCC under the allocation 2017‐A0010102212, 2018‐ A0030102212, and 2019‐A0050102212 made by GENCI. We acknowledge the support of the ERC MAGIC under Grant 649081. The authors acknowledge Michiel Baatsen for sharing his data outputs from the CESM model. We acknowledge use of Ferret (ferret.pmel.noaa.gov/Ferret/) and NCL software for analysis and figures in this paper.
Cooke, S., & Rohling, E. J. (1999). Stable oxygen and carbon isotopes in foraminiferal carbonate shells. In B. K. S. Gupta (Ed.), Modern Foraminifera(pp. 239–258). Netherlands: Springer. https://doi.org/10.1007/0-306-48104-9_14
Coxall, H. K., Huck, C. E., Huber, M., Lear, C. H., Legarda‐Lisarri, A., O'Regan, M., et al. (2018). Export of nutrient rich northern com-ponent water preceded early Oligocene Antarctic glaciation. Nature Geoscience, 11(3), 190–196. https://doi.org/10.1038/s41561-018-0069-9
Cramer, B. S., Toggweiler, J. R., Wright, J. D., Katz, M. E., & Miller, K. G. (2009). Ocean overturning since the late cretaceous: Inferences from a new benthic foraminiferal isotope compilation. Paleoceanography, 24, PA4216. https://doi.org/10.1029/2008PA001683 Cramwinckel, M. J., Huber, M., Kocken, I. J., Agnini, C., Bijl, P. K., Bohaty, S. M., et al. (2018). Synchronous tropical and polar temperature
evolution in the Eocene. Nature, 559(7714), 382–386. https://doi.org/10.1038/s41586-018-0272-2
Cristini, L., Grosfeld, K., Butzin, M., & Lohmann, G. (2012). Influence of the opening of the Drake Passage on the Cenozoic Antarctic ice sheet: A modeling approach. Palaeogeography, Palaeoclimatology, Palaeoecology, 339‐341, 66–73. https://doi.org/10.1016/j.
palaeo.2012.04.023
Dalziel, I. W. D., Lawver, L. A., Norton, I. O., & Gahagan, L. M. (2013). The scotia arc: Genesis, evolution, global significance. Annual Review of Earth and Planetary Sciences, 41(1), 767–793. https://doi.org/10.1146/annurev-earth-050212-124155
DeConto, R. M., & Pollard, D. (2003). Rapid Cenozoic glaciation of Antarctica induced by declining atmospheric CO2. Nature, 421(6920), 245–249. https://doi.org/10.1038/nature01290
Donohue, K. A., Tracey, K. L., Watts, D. R., Chidichimo, M. P., & Chereskin, T. K. (2016). Mean Antarctic Circumpolar Current transport measured in Drake Passage. Geophysical Research Letters, 43, 11,760–11,767. https://doi.org/10.1002/2016GL070319
Doria, G., Royer, D. L., Wolfe, A. P., Fox, A., Westgate, J. A., & Beerling, D. J. (2011). Declining atmospheric CO2 during the late middle Eocene climate transition. American Journal of Science, 311(1), 63–75. https://doi.org/10.2475/01.2011.03
Douglas, P. M. J., Affek, H. P., Ivany, L. C., Houben, A. J. P., Sijp, W. P., Sluijs, A., et al. (2014). Pronounced zonal heterogeneity in Eocene southern high‐latitude sea surface temperatures. Proceedings of the National Academy of Sciences, 111(18), 6582–6587. https://doi.org/ 10.1073/pnas.1321441111
Dufresne, J.‐L., Foujols, M.‐A., Denvil, S., Caubel, A., Marti, O., Aumont, O., et al. (2013). Climate change projections using the IPSL‐CM5 earth system model: From CMIP3 to CMIP5. Climate Dynamics, 40(9–10), 2123–2165. https://doi.org/10.1007/s00382-012-1636-1 Eagles, G. (2010). South Georgia and Gondwana's Pacific margin: Lost in translation? Journal of South American Earth Sciences, 30(2),
65–70. https://doi.org/10.1016/j.jsames.2010.04.004
Eagles, G., & Jokat, W. (2014). Tectonic reconstructions for paleobathymetry in Drake Passage. Tectonophysics, 611, 28–50. https://doi.org/ 10.1016/j.tecto.2013.11.021
Eagles, G., Livermore, R., & Morris, P. (2006). Small basins in the Scotia Sea: The Eocene Drake Passage gateway. Earth and Planetary Science Letters, 242(3–4), 343–353. https://doi.org/10.1016/j.epsl.2005.11.060
Eagles, G., & Scott, B. G. C. (2014). Plate convergence west of Patagonia and the Antarctic peninsula since 61Ma. Global and Planetary Change, 123, 189–198. https://doi.org/10.1016/j.gloplacha.2014.08.002
Elsworth, G., Galbraith, E., Halverson, G., & Yang, S. (2017). Enhanced weathering and CO2 drawdown caused by latest Eocene strengthening of the Atlantic meridional overturning circulation. Nature Geoscience, 10(3), 213–216. https://doi.org/10.1038/ngeo2888 England, M. H., Hutchinson, D. K., Santoso, A., & Sijp, W. P. (2017). Ice‐atmosphere feedbacks dominate the response of the climate system
to Drake Passage closure. Journal of Climate, 30(15), 5775–5790. https://doi.org/10.1175/JCLI-D-15-0554.1
Estebenet, M. S. G., Guerstein, G. R., & Alperin, M. I. (2014). Dinoflagellate cyst distribution during the middle Eocene in the Drake Passage area: Paleoceanographic implications. Ameghiniana, 51(6), 500–509. https://doi.org/10.5710/AMGH.06.08.2014.2727
Exon, N. F., Brinkhuis, H., Robert, C. M., Kennett, J. P., Hill, P. J., & Macphail, M. K. (2004). Tectono‐sedimentary history of uppermost cretaceous through Oligocene sequences from the Tasmanian region: A temperate Antarctic margin. In N. F. Exon, J. P. Kennett, & M. J. Malone (Eds.), The Cenozoic Southern Ocean: Tectonics, sedimentation, and climate change between Australia and Antarctica, Geophysical Monograph Series(Vol. 151, pp. 319–344). Washington, DC: American Geophysical Union. https://doi.org/10.1029/ 151GM18
Farnsworth, A., Lunt, D. J., O'Brien, C. L., Foster, G. L., Inglis, G. N., Markwick, P., et al. (2019). Climate sensitivity on geological timescales controlled by nonlinear feedbacks and ocean circulation. Geophysical Research Letters, 46, 9880–9889. https://doi.org/10.1029/ 2019GL083574
Fichefet, T., & Morales‐Maqueda, M. A. (1997). Sensitivity of a global sea ice model to the treatment of ice thermodynamics and dynamics. Journal of Geophysical Research, 102(C6), 12,609–12,646. https://doi.org/10.1029/97JC00480
Firing, Y. L., Chereskin, T. K., & Mazloff, M. R. (2011). Vertical structure and transport of the Antarctic Circumpolar Current in Drake Passage from direct velocity observations. Journal of Geophysical Research, 116, C08015. https://doi.org/10.1029/2011JC006999 van de Flierdt, T., Frank, M., Halliday, A. N., Hein, J. R., Hattendorf, B., Günther, D., & Kubik, P. W. (2004). Deep and bottom water export
from the Southern Ocean to the Pacific over the past 38 million years. Paleoceanography, 19, PA1020. https://doi.org/10.1029/ 2003PA000923
Frank, M., Whiteley, N., van de Flierdt, T., Reynolds, B. C., & O'Nions, K. (2006). Nd and Pb isotope evolution of deep water masses in the eastern Indian Ocean during the past 33 Myr. Chemical Geology, 226(3–4), 264–279. https://doi.org/10.1016/j.
chemgeo.2005.09.024
Galindo‐Zaldívar, J., Puga, E., Bohoyo, F., González, F. J., Maldonado, A., Martos, Y. M., et al. (2014). Reprint of “Magmatism, structure and age of dove basin (Antarctica): A key to understanding south scotia arc development”. Global and Planetary Change, 123, 249–268. https://doi.org/10.1016/j.gloplacha.2014.11.002
Gent, P. R., Large, W. G., & Bryan, F. O. (2001). What sets the mean transport through Drake Passage? Journal of Geophysical Research, 106(C2), 2693–2712. https://doi.org/10.1029/2000JC900036
Goldner, A., Herold, N., & Huber, M. (2014). Antarctic glaciation caused ocean circulation changes at the Eocene‐Oligocene transition. Nature, 511(7511), 574–577. https://doi.org/10.1038/nature13597
Hague, A. M., Thomas, D. J., Huber, M., Korty, R., Woodard, S. C., & Jones, L. B. (2012). Convection of North Pacific deep water during the early Cenozoic. Geology, 40(6), 527–530. https://doi.org/10.1130/G32886.1
Haynes, S. J., MacLeod, K. G., Ladant, J.‐B., Guchte, A. V., Rostami, M. A., Poulsen, C. J., & Martin, E. E. (2020). Constraining sources and relativeflow rates of bottom waters in the late cretaceous Pacific Ocean. Geology, 48(5), 509–513. https://doi.org/10.1130/G47197.1 Hill, D. J., Haywood, A. M., Valdes, P. J., Francis, J. E., Lunt, D. J., Wade, B. S., & Bowman, V. C. (2013). Paleogeographic controls on the
onset of the Antarctic Circumpolar Current. Geophysical Research Letters, 40, 5199–5204. https://doi.org/10.1002/grl.50941
Hohbein, M. W., Sexton, P. F., & Cartwright, J. A. (2012). Onset of North Atlantic deep water production coincident with inception of the Cenozoic global cooling trend. Geology, 40(3), 255–258. https://doi.org/10.1130/G32461.1