HAL Id: hal-01882881
https://hal.archives-ouvertes.fr/hal-01882881
Submitted on 27 Sep 2018HAL is a multi-disciplinary open access archive for the deposit and dissemination of sci-entific research documents, whether they are pub-lished or not. The documents may come from teaching and research institutions in France or abroad, or from public or private research centers.
L’archive ouverte pluridisciplinaire HAL, est destinée au dépôt et à la diffusion de documents scientifiques de niveau recherche, publiés ou non, émanant des établissements d’enseignement et de recherche français ou étrangers, des laboratoires publics ou privés.
Compressive resistance of granular-scale microgels: from
loose to dense packing
Izabella Bouhid de Aguiar, Karin Schroën, Martine Meireles, Antoine
Bouchoux
To cite this version:
Izabella Bouhid de Aguiar, Karin Schroën, Martine Meireles, Antoine Bouchoux. Compressive re-sistance of granular-scale microgels: from loose to dense packing. Colloids and Surfaces A: Physico-chemical and Engineering Aspects, Elsevier, 2018, 553, pp.406-416. �10.1016/j.colsurfa.2018.05.064�. �hal-01882881�
1
Compressive resistance of granular-scale microgels:
from loose to dense packing
Izabella Bouhid de Aguiar1,2, Karin Schroën1, Martine Meireles2, Antoine Bouchoux3*
1 Laboratory of Food Process Engineering, Wageningen University, Wageningen, the Netherlands. 2 Laboratoire de Génie Chimique, Université de Toulouse, CNRS, INPT, UPS, France
3 Laboratoire d’Ingénierie des Systèmes Biologiques et des Procédés, CNRS, INRA, INSAT,
Université de Toulouse, 31400, France Abstract
Microgels are deformable and compressible particles that can be packed to concentrations that exceed the random close packing limit of hard spheres. For reaching high packing levels, one has to overcome the resistance to compression of the system. This resistance potentially originates from many different phenomena (thermal agitation effects, surface interactions, microgel deformation, interpenetration, water expulsion) that depend on the microgel properties (size, ionic charge, structure, softness). Here, we investigate granular-scale dextran-based microgels with different native water contents. The resistance to compression of the suspensions is measured through the variation of the osmotic pressure with packing concentration. In parallel, we characterize the structure of the packings in terms of polymer heterogeneity, microgel deformation, and average size using confocal microscopy. We find that all microgel suspensions resist compression in the same manner; however, the mechanisms involved clearly depend on the actual degree of compression. In the loose packing regime, the resistance originates mainly from the resistance of the microgels to their own deformation, with no or negligible deswelling; the osmotic pressure rises abruptly with concentration in analogy to compressed emulsion droplets. In the second and dense packing regime, the microgels necessarily have to expel water to withstand compression. The resistance of the packing is then similar to that of a continuous gel of the same polymer. Importantly, we find that structural macro-voids are still observable in these systems; the presence of which needs to be taken into account when modeling the osmotic resistance.
Keywords
Microgels; Dextran; Compression resistance; Osmotic pressure; Confocal microscopy; 1. Introduction
Microgels are granular- or colloidal- scale particles made of a low density polymer network swollen by a solvent [1–4]. They are soft and deformable objects that have the ability to change their size and shape in response to their environment, e.g. pH, ionic strength, temperature, concentration. This makes them interesting for a variety of applications such as drug delivery or food formulation for instance [5–7]. They are also model particles that are used for understanding
2
the general behavior of soft objects in various situations. One specific and interesting case is when the particles are highly concentrated and packed against each other. This corresponds to situations encountered in the filtration of milk for instance, and more generally in processes in which filtration, centrifugation or drying operations are used involving deformable and compressible particles [8–13]. The rheological and phase properties of microgel dispersions at increasing concentration are more and more documented [14–18]. The most recent works report a complex phase transition from the fluid to the glassy or solid state; sometimes exhibiting phase coexistence [19,20]. This results from the ability of microgels to deswell depending on particle stiffness, ionic environment, size polydispersity and packing concentration [21–23]. The structural properties of the resulting packings, including the way the individual particles deform, organize themselves, sometimes crystallize, and even interpenetrate as a function of concentration, is also a recent matter of interest [24–28]. In particular, whereas crystallization is suppressed for hard colloidal spheres with polydispersity greater than 10%, microgels can overcome this limitation because a small number of large particles can spontaneously deswell to fit in the crystal lattice of smaller microgels [21,29,30]. Here we explore another property of microgel packings, which is the resistance to deswelling upon compression of the system. This question has clearly been overlooked over the past few years while it is of crucial importance for understanding and predicting the performances of concentration processes, e.g. drying time or filtration fluxes [8,31–34].
The resistance of a particulate and/or polymeric dispersion/solution to an isotropic compression can be accessed directly by measuring the variation in osmotic pressure with concentration [35,36]. The osmotic pressure is the result of all interactions in the system. For colloidal dispersions, it originates from thermal agitation of particles and surface interactions [35]. For polymer solutions, it is given by the entropy of mixing of the polymer segments with the solvent and an additional and often dominating contribution of the polymer counter-ions in the case of polyelectrolytes [37,38]. For polymer gels, the mixing and ionic contributions are complemented with a - negative - elastic term that comes from the crosslinks that prevent full reswelling of the structure [39]. The compressive resistance of a single microgel particle similarly results from all these contributions. Therefore osmotic pressure models developed for polymeric gels are now commonly used for explaining the (de)swelling behavior of individual microgels; popular approaches being based on Flory-Rehner theory [2,40–45].
The resistance to compression of a collection of microgels is more complex to analyze. At low concentrations, when the microgels are still separated from each other, surface interactions and thermal agitation often dominate like in the hard sphere dispersion [46–49]. In the specific case of charged, colloidal pNIPAM microgels, these contributions are supplemented by the presence of free counterions in the solution surrounding the particles [19,21,22]. In contrast, at high concentrations, the microgel particles can pack very densely and form a fully homogeneous material that resists compression like a macroscopic polymeric gel [3]. In between these two extreme conditions, the microgels are forced to get into contact with each other but still do not fill all of the available volume and voids are present. The resistance of the packing to compression is then difficult to apprehend as it potentially depends on many different phenomena: thermal agitation, particle-particle interactions, compression of individual microgels (including compression without deformation [24]), deformation (including deformation at constant volume like in emulsion packings [50]), interpenetration [25,26], crystallization [19–22,29,30], presence of structural heterogeneities. To date, experimental or simulation data on these systems are very
3
much lacking and it is still a challenge to predict and understand what determines their resistance to compression.
Here we examine this question through an experimental study performed with microgels of different origins and stiffness. To simplify the problem, we choose neutral (dextran-based) and granular-scale microgels so that both ionic effects and particle thermal agitation can be safely ignored. Suspensions of microgels are compressed to different degrees and the osmotic pressure of the packings is measured. In parallel, confocal scanning imaging is used to characterize the structure of the packing in terms of polymer heterogeneity and microgel deformation and size. 2. Experimental
2.1. Microgels
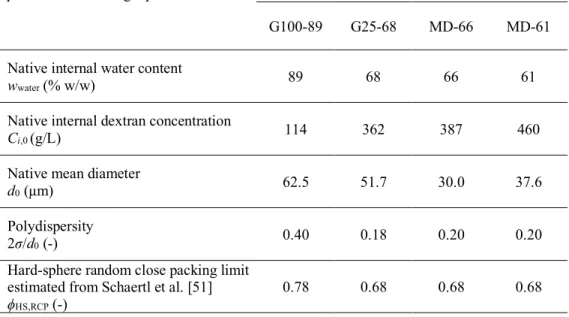
All the microgels that we used are neutral, dextran-based particles (Table 1).
Table 1. Properties of the microgel particles
G100-89 G25-68 MD-66 MD-61 Native internal water content
wwater (% w/w) 89 68 66 61
Native internal dextran concentration
Ci,0 (g/L) 114 362 387 460
Native mean diameter
d0 (µm) 62.5 51.7 30.0 37.6
Polydispersity
2σ/d0 (-) 0.40 0.18 0.20 0.20
Hard-sphere random close packing limit estimated from Schaertl et al. [51]
ϕHS,RCP (-)
0.78 0.68 0.68 0.68
G100-89 and G25-68 microgels are commercial Sephadex particles obtained through crosslinking of dextran polymer by epichlorohydrin [52]. The number after the letter G is the approximate water content as given by the manufacturer GE Healthcare Life Sciences in gram of water per gram of dry polymer. MD-66 and MD-61 are methacrylated dextran (dexMA) microgels that we synthesized in our laboratory from dextran T40 using water-in-water emulsion polymerization following the protocol of Stenekes et al. [53,54] (see the Supplementary Materials for details about their preparation).
The four microgel particles have different crosslink densities and consequently swell to different degrees when dispersed in water. According to references [45,55], the mesh sizes of the fully swollen microgels vary from ~20 nm (G100-89) to ~5 nm (MD-61). In Table 1, we provide the values of the corresponding native internal water contents wwater in g of water per 100 g total (%
4
w/w). These values also appear in the names of the particles after the dash. The water contents were determined using a well-established protocol of Stenekes et al. [55,56]; in brief the concentration of a 2 MDa blue dextran tracer solution is measured after lyophilized microgel particles are added to the solution. The tracer is too large to penetrate the microgel particles when they swell to their equilibrium water content. The increase in tracer concentration in the solution is thus directly related to the quantity of water incorporated in the microgels. In addition to the value of wwater, we provide in Table 1 the internal dextran concentration Ci,0 of the fully swollen
microgels; this characteristic is defined as:
(1) where ddex = 1598 g/L (refs. [57,58]) and dwater = 997 g/L are the dextran and water densities at
25°C, respectively.
All the microgels are a few tens of microns in diameter, which allows us to monitor their changes in shape and size in concentrated packings using optical microscopy (section 2.4.). Their native size distributions were determined using confocal microscopy with microgel suspensions at low concentration. The microgels are polydisperse with a Gaussian population centered at diameter d0
and with a polydispersity 2σ/d0 ranging from 0.18 to 0.4 (Table 1, σ is the standard deviation).
From the values of polydispersity, we can evaluate the volume fraction at random close packing
ϕHS,RCP from the theoretical work of Schaertl et al. on hard-sphere dispersions [51]. This value
corresponds to the limit in volume fraction when polydisperse hard spheres are closely packed. It exceeds the 0.64 value for monodisperse spheres because polydisperse systems can pack more efficiently with small particles that fit in the interstices of larger ones. For microgel particles,
ϕHS,RCP typically corresponds to the volume fraction above which the microgels necessarily have
to deform and/or deswell for the system to reach higher concentrations.
As reported by Flodin, Sephadex microgel particles are homogeneous in polymer and crosslink densities [52], and this is also the case for the dextran microgels that are synthesized through water-in-water emulsion polymerization (see the confocal images in [59] for instance). Therefore we are far from the core-shell structure of pNIPAM colloidal microgels that have fuzzy shells that can interpenetrate at high concentrations [25,26]. As we will show later, interpenetration effects are most probably very limited - if not absent - in the case of granular scale dextran microgels. 2.2. Osmotic stress experiments
The osmotic stress method was used to compress the microgel suspensions and measure their osmotic pressure. The microgel suspensions are placed in dialysis bags that are in turn immersed in a large volume of a stressing polymer solution of known osmotic pressure. The dialysis bags are chosen so that they respectively retain the microgel particles and the polymer, in the dialysis bag and in the immersion solution. The difference in osmotic pressure, i.e., the difference in water chemical potential, between the two compartments induces an osmotic flow of water from the bag towards the immersion solution. The flow stops when the osmotic pressure in the bag equals the osmotic pressure of the immersion solution. By multiplying the experiments with different
(
)
(
)
wateri,0
water dex water water
1 1 w C w d w d -= - +
5
concentrations of stressing polymer in the immersion solution, it is possible to compress the microgel suspensions to different levels. The resistance to compression of each system is given by the osmotic pressure at equilibrium, i.e. when flow stops.
A polyethylene glycol of 35 kDa molecular weight (PEG35, Sigma-Aldrich) was used as the stressing polymer. The variation of the osmotic pressure of PEG35 solutions as a function of concentration is given in the literature [46,60]. PEG35 concentrations were chosen in the range 1.9 to 33.6 % w/w, corresponding to osmotic pressures between 2.5 kPa and 2 MPa.
All solutions and suspensions were prepared by mixing PEG or lyophilized microgels in milliQ water. Dialysis bags of molecular weight cut-off 6-8 kDa were used (Spectra/Por 1, Spectrum). Initially, the bags are filled with a microgel suspension of ~0.25 volume fraction. As water escapes the bags during the process, it is necessary to refill the bags regularly with microgels (at least three times) in order to have enough material at the end of the compression. After each addition, the bag content is mixed manually. About one week after the last addition of microgels to the bag, the stressing PEG solution is renewed and the bags are allowed to equilibrate for one further week. The compressed microgel suspensions are then analyzed in terms of concentration and structure. For comparison purposes, the osmotic pressure of solutions of non-crosslinked dexMA polymer and commercial dextran T40 (~40 kDa Molecular weight, Pharmacosmos) was also measured as a function of concentration. The protocol was similar to the one previously described.
2.3. Dextran concentration and microgel effective volume fraction
After equilibration, the total dextran concentration in the bags was determined by drying a small amount of the sample at 105°C until constant weight. At this temperature, the polymer does not decompose or vaporize and only water is removed from the sample. In this way we obtain a dry matter content wp which is the mass fraction of dextran polymer in the sample expressed in % w/w. The measurements were repeated three times per sample and the variation between dry matter contents was below 1% for the same sample.
The dextran concentration in the samples can also be expressed in g per volume of sample, which is simply obtained from dry matter content wp using the following relation:
(2)
This concentration C is in turn used to define and calculate the effective volume fraction z ζ = npVp,0 = C
mpVp,0 = C
Ci,0 (3)
with np the number density of microgels, Vp,0 and mp the native volume and dextran mass of one average microgel, respectively, and Ci,0 the internal dextran concentration of a fully swollen,
uncompressed, microgel (native internal dextran concentration in Table 1).
(
)
dex 1 water p p p w C w d w d = +-6
The use of an effective volume fraction z is now a standard in the microgel literature [3,25,27]. z
is the volume fraction of microgels in the suspension as defined from their actual number density but with respect to their native, uncompressed size. The value of z is related to the degree of packing of the microgels in the suspensions. In the dilute regime, when the microgels are still not compressed and/or deformed, z is simply a measure of the true microgel volume fraction (ϕ) in
suspension [17,27]. This holds until z reaches a limiting value at which the microgels start to deform and/or shrink. This limiting value can be related to the nature of the microgels (see refs [19,21] for instance for the specific case of ionic colloidal microgels) but is often close to the random close packing fraction for hard spheres, ϕHS,RCP. We can then distinguish two theoretical
regimes of compression after z reaches this limit: A first regime at ϕHS,RCP ≲ z < 1, where the
microgels have the possibility to deform only and keep their initial volume, as compressed emulsion droplets would do for instance [50]. A second regime where z exceeds 1 and the microgels necessarily have to expel solvent to reach lower volumes than Vp,0.
2.4. Confocal laser scanning microscopy (CLSM)
To image the microgels in the packings by CLSM, we create a contrast by adding a FITC-dextran (500 kDa fluorescein-5-isothiocyanate-dextran, Sigma-Aldrich) in the suspensions. The FITC-dextran is too large to penetrate the microgel particles and the non-fluorescent microgels are visualized against a fluorescent background. To limit premature bleaching, the FITC-dextran is added at the last refill of the bags with microgels. The content of the bag is then mixed to assure an even distribution of the fluorescent polymer. Afterwards, the system is left to equilibrate for one more week to remove the water introduced with the FITC-dextran. We estimate the final concentration of FITC-dextran to be ~0.2 mg per g of sample. As we found experimentally (the osmotic pressures measured with dispersions that contains or not additional FITC-dextran were always virtually the same), the presence FITC-dextran at such a low concentration has no measurable impact on the osmotic resistance of the samples. It is then safe to consider that the images obtained using CLSM and with additional FITC-dextran are representative of the ‘true’ structure of the microgel packings without FITC-dextran.
To observe stacks of compressed microgels, we designed a sample holder with a depth equivalent to about ten times the diameter of the microgels. It consists of a glass slide in which a circular hole is drilled. The hole is 480 µm deep and has 1 cm in diameter. The hole is manually filled with the sample and sealed with a glass coverslip and adhesive tape to avoid drying. Stacks of images with 1 µm spacing are obtained using a Leica SP8 CLSM microscope (Plateforme Imagerie Toulouse-Réseau-Imagerie).
For each sample, the images were treated using a home written Matlab code that (i) calculates the volume fraction of voids in the packings, (ii) gives the distribution of microgel sizes by analyzing 200-800 particles. We provide additional information about the way the calculations are performed in the Supplementary Materials.
7
3. Results
3.1. Osmotic pressure
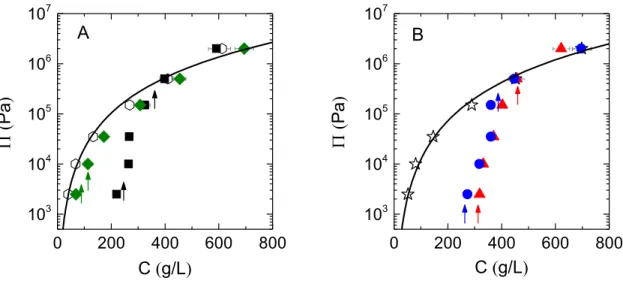
The osmotic pressures measured for the suspensions of Sephadex and dexMA microgels are given in Figs. 1A and 1B, respectively (closed symbols). They are plotted as a function of dextran concentration C which is the total concentration of dextran polymer in the samples in g per volume. The pressures of solutions of dextran T40 (Fig. 1A, open symbols) and methacrylated dextran T40 (Fig. 1B, open symbols), as measured using the same methodology, are also given. In this way we compare the compression resistance of the microgel suspensions with the compression resistance of a reference polymer that corresponds to the non-crosslinked material of the microgels. Note that this is not strictly the case for Sephadex microgels as we do not know the exact size of the dextran precursor used in the making of these particles. However Sephadex G25 and G100 are made from dextran with molecular weight >>10kDa [61], and the osmotic pressure of dextran is relatively insensitive to dextran size at such molecular weights [62]. So it is reasonable to consider dextran T40 as an adequate reference polymer for Sephadex here.
Figure 1. Osmotic pressure of dextran microgel packings and dextran solutions as a function of the overall polymer concentration in the system. A) dextran T40 (empty hexagons), Sephadex microgels G100-89 (green diamonds) and G25-68 (black squares). B) dexMA (empty stars), dexMA microgels MD-66 (blue circles) and MD-61 (red triangles). The solid lines are power law fits to the osmotic pressure data of dextran T40 and dexMA (see 3.3). The arrows indicate the dextran concentration at which z = ϕHS,RCP(lower arrows) and z = 1 (higher arrows).
G100-89 is the microgel with the highest initial water content in this study. It shows osmotic pressures that are always very close to the dextran T40 values, albeit systematically slightly lower (Fig. 1A, green diamonds). We added in the figure vertical arrows that correspond to the positions of the reference points z = ϕHS,RCP and z = 1. The first osmotic pressure point for G100-89 is located
slightly below the RCP volume fraction for hard spheres, indicating that the suspension starts to resist compression before the microgels are closely packed. This is not an effect of thermal
0 200 400 600 800 103 104 105 106 107 0 200 400 600 800 103 104 105 106 107 P ( Pa ) C (g/L) A P ( Pa ) B C (g/L)
8
agitation as G100-89 consists of granular, non-brownian, particles. Instead this is probably due to some frictional effects between the particles leading to the formation of stable loose packings at volume fractions below the RCP limit [63]. These packings resist compression as energy is needed to counteract frictional forces and go further up in microgel volume fraction. All the other pressure values for G100-89 correspond to z > 1 (second arrow), indicating that the microgels have
necessarily deswollen and are probably strongly deformed and squeezed against each other, capable of reaching even an effective volume fraction z ≈ 6.
For microgel G25-68, the variation of osmotic pressure with polymer concentration is rather different (black squares in Fig. 1A). At low concentration, the osmotic pressure is considerably lower than the pressures measured for dextran solutions. This difference is explained by the fact that suspensions of granular microgels start to resist compression only when the microgels come into contact and form a percolating network. Before that, the microgels sediment and there is no measurable resistance to this. As a result, we start to measure an osmotic pressure at a concentration C that corresponds to z ≈ ϕHS,RCP (first arrow, about 200 g/L); the slight discrepancy
towards lower concentrations is most probably because of interparticle frictional forces. The behavior of dextran solutions is rather different and show a measurable osmotic pressure as soon as polymer chains are present in solution, hence there is a large difference in pressure between dextran T40 and the microgels. As soon as we obtain a measurable osmotic pressure for the microgels, which is still at low concentrations, we observe a strong increase in osmotic pressure with C for the G25-68 particles (note the logarithmic scale). Interestingly, this increase occurs at concentrations that almost exactly matches the range ϕHS,RCP < z < 1, meaning that the packing
considerably gains in compression resistance when the microgels get into close contact and need to deform and/or deswell to accommodate the pressure. In a last regime, corresponding to z>1, the increase in osmotic pressure with concentration becomes less pronounced and the pressures measured are close to those of dextran T40. At such high effective volume fractions, the microgels necessarily respond to compression by expelling water and shrinking to lower volume.
The results obtained with dexMA microgels are very similar to those obtained with Sephadex G25-68 particles, including the divergence in osmotic pressure when the particles get packed and the match between the pressure of the microgel suspensions and the pressure of the polymer material that constitutes the microgels at high concentrations (Fig. 1B). We will not go into a detail description here but instead move to the next section in which we characterize the structure of the packings as a function of concentration.
3.2. Images of the packings
Figs. 2 and 3 present examples of CLSM images obtained for G100-89 and G25-68 microgels at the osmotic pressures reported in Fig. 1. Images of compressed MD-61 and MD-66 microgel suspensions display features similar to those obtained for G25-68 and are given in the Supplementary Materials.
9
Figure 2. Confocal Laser Scanning Microscope images of compressed G100-89 microgels. The scale bar is 100 µm.
10 kPa 35 kPa
2.5 kPa
150 kPa 500 kPa 2 MPa
ξ = 0.60 ξ = 0.99 ξ = 1.52
ξ = 2.70 ξ = 3.99 ξ = 6.09
2.5 kPa
10
Figure 3. CLSM images of compressed G25-68 microgels. The scale bar is 100 µm.
For all microgels, the pictures obtained at the lowest osmotic pressure correspond well to loose percolating packings of spherical or slightly deformed particles that oppose a small resistance to compression through interparticle frictional forces and/or particle deformation and deswelling. As osmotic pressure increases, the microgels get increasingly packed and deformed. This is more visible for G100-89 microgels that clearly lose their spherical shape in the range 0.60 < z < 1.52.
Deformation is less obvious but still visible for the other microgels; mostly because the particles are of smaller size and/or the contrast is not optimal.
Note that the 500 kDa FITC-dextran that we use as contrast agent has quite an unexpected behavior with G100-89 microgels (Fig. 2). At low osmotic pressures (Π≤35 kPa), it is effectively excluded from the particles because of its larger size compared to the average pore size of the microgels [55,64]. However, at large osmotic pressures (Π≥150 kPa), when the microgels are closely packed and deformed against each other and the FITC-dextran clearly enters the structure of the microgels. This phenomenon is particularly difficult to interpret. At first sight, it is tempting to explain this through the effective degree of entanglement experienced by the FITC-dextran when the interstitial voids between the microgels are closed. At some point, it is indeed plausible that the interstitial concentration in FITC-dextran reaches a limit where entanglement effects are so strong that it becomes more favorable for the FITC-dextran to enter the microgels through reptation (a similar effect is described in [65,66] for instance). This mechanism can perfectly be translated in terms of osmotic pressure: when the osmotic pressure of FITC-dextran becomes higher than the osmotic pressure of the microgels - which is equal to the osmotic pressure of the PEG reservoir - some of the FITC-dextran enters the microgel to equilibrate the pressures inside and outside the microgels. However, we find that this whole explanation based on the effective concentration in FITC-dextran in the voids is not satisfactory for at least two reasons:
(i) the total concentration of FITC-dextran in the samples is very low, ~0.2 mg/g, which leads to a maximum concentration of ~15-50 g/L in the interstitial voids using the void fraction values of Fig. 4B (see next paragraph). This concentration of FITC-dextran in turn corresponds to an osmotic pressure of about 2 kPa (dextran tabulated values of Peter Rand [67]), which is much lower than the pressures at which the FITC-dextran enters the microgels
(ii) the fluorescence intensities suggest that FITC-dextran has entered the microgels in such a way that it is more concentrated inside the microgels than in the interstitial voids. Such a ‘reverse’ exclusion phenomenon clearly cannot be explained through osmotic/entanglement effects only,
150 kPa ξ = 0.90
500 kPa
11
but is more probably the results of some kind of attractive interactions between the tracer and the microgel
We will not go further into this discussion here, as it is clearly beyond the scope of the present paper to properly understand the reasons for this accumulation of FITC-dextran in the microgels in conditions of dense packing. We stress however that we do not observe this effect with the Sephadex G25-68 microgels, except maybe at the highest osmotic pressure where the FITC-dextran seems to have started to diffuse in the periphery of the particles (Fig. 3, 2 MPa). For dexMA particles, we observe penetration of FITC-dextran at compression pressures ≥ 500 kPa only (Supplementary Materials).
An interesting question is how much the individual microgel particles have actually squeezed in the packings: do they always squeeze and loose internal water when the packings are compressed or is there a regime at which they only deform at constant volume like emulsion droplets do for instance? To answer this question, one can first look at the evolution of the size of the particles as measured from the CLSM images (Fig. 4A). The reported sizes are the average diameters obtained by analyzing 200-800 particles in each sample. This analysis also suggests that there is no significant evolution of size polydispersity with compression for each microgel population. However, we chose not to present these results as it would require more statistics and/or more advanced characterization techniques (like SAXS or SANS in the case of colloidal particles for instance [21,22]) to investigate this question properly.
The decrease in size is obvious for the G100-89 microgels and starts already at the lowest osmotic pressures (the values at high Π values are not reported as the microgels are then highly deformed and the size of individual particles cannot be determined precisely). This is in line with effective volume fractions z ≥1 being reached early in the compression process (second point of osmotic
pressure) and that the particles necessarily expel water. For the other three other microgels, the size is not really affected by compression at low pressures and the decrease in size is only apparent at pressures ≥150 kPa. This suggests that the microgel particles loose volume and expel water only in this second range of applied pressures.
To confirm that, we now look at the volume fraction occupied by the interstitial voids that persist in the packing during compression. This void fraction can be measured from the CLSM images with quite good precision and is plotted as a function of osmotic pressure in Fig. 4B. As expected, we see that the voids get progressively closed with compression without disappearing completely, except for G100-89 for which the voids vanish. What is interesting here is that we can estimate the actual degree of squeezing of the microgels from the measured void fractions. Indeed, the internal polymer concentration of the microgels in the packings is simply given by
(4) (1 void fraction) i C C =
-12 Figure 4. A) Microgel mean diameter as a function of osmotic pressure. B) Fraction of void in the packings as a function of osmotic pressure. C) The evolution of the internal dextran concentration of the microgels in the packings as calculated from the void fraction data (eq 4). The patterned areas correspond to the native internal concentration of the microgels at zero pressure (Ci,0 in Table 1) +/- 5%. Microgels G100-89 (green
diamonds), G25-68 (black squares), MD-66 (blue circles) and MD-61 (red triangles).
In Fig. 4C, Ci is plotted as a function of osmotic pressure. For G100-89, Ci exceeds the native internal dextran concentration Ci,0 of the microgels at pressures ≥ 10 kPa. This confirms that the particles start to expel water from this pressure upward, in accordance with the changes in size of Fig. 4A. For the other microgels, Ci in found to be very close to Ci,0 for the first 3-4 points of osmotic pressure, meaning that the particles have not yet expelled water in that range. Ci goes beyond Ci,0 only at high osmotic pressures, as expected from the changes in size shown in Fig. 4A. Another interesting way of looking at these results is by comparison of the observed void fraction as a function of C, i.e. the average dextran concentration in the suspension (Fig. 5), with ‘ideal’ scenarios. Particles that cannot deform at all and only deswell are represented by the black lines,
103 104 105 106 107 20 40 60 80 d ( m m ) P (Pa) A 103 104 105 106 107 0.0 0.1 0.2 0.3 0.4 0.5 B P (Pa) V oid fr act ion (-) 103 104 105 106 200 400 600 800 C P (Pa) In te rna l co nc. C i ( g/ L)
13
while objects that can only deform without losing volume before ξ = 1 (such as emulsions) are represented by red lines.
Figure 5. Evolution of the void fraction in the packings as a function of the average dextran concentration in the system. The black line is the theoretical evolution of void fraction for packings of particles that do not deform but only deswell at ζ ≥ fHS,RCP (void fraction = 1-C/Ci,0 at ζ < fHS,RCP and void fraction =
1-fHS,RCP at ζ≥ fHS,RCP). The red line is the theoretical evolution of the void fraction for packings of particles
that only deform and do not deswell, such as emulsion droplets (void fraction = 1-C/Ci,0 until vanishing).
We clearly see in Fig. 5 that all dextran microgels have the tendency to follow the behavior of deformable but non-compressible objects in the range fHS,RCP ≤ ζ ≤ 1. At ζ ≥ 1, the compressibility of the microgels then comes into play and the particles squeeze to smaller volumes, while some
0 200 400 600 800 0.0 0.1 0.2 0.3 0.4 0.5 fHS,RCP C (g/L) Vo id fr ac tio n (-) z = 1 A. G100-89 0 200 400 600 800 0.0 0.1 0.2 0.3 0.4 0.5 fHS,RCP C (g/L) Vo id fr ac tio n (-) z = 1 B. G25-68 0 200 400 600 800 0.0 0.1 0.2 0.3 0.4 0.5 fHS,RCP C (g/L) Vo id fr ac tio n (-) z = 1 C. MD-66 0 200 400 600 800 0.0 0.1 0.2 0.3 0.4 0.5 fHS,RCP C (g/L) Vo id fr ac tio n (-) z = 1 D. MD-61
14
voids persist. The presence of these remaining voids is an important point that we discuss further in the following section.
4. Summary and discussion
The results presented above can be summarized as follows:
(1) Suspensions of dextran, granular microgels start to resist compression at a volume fraction that matches the random close packing of hard-spheres of similar size distribution, fHS,RCP. This is consistent with the fact that these microgels are non-brownian particles that sediment and come into contact at f ≈ fHS,RCP with no measurable resistance. In two cases (Sephadex), the volume fraction at which the packings start to resist compression is slightly below fHS,RCP, which may be caused by some frictional forces between the microgels [63]. Note that this general behavior of granular and neutral microgels at low volume fractions is very different from the one of colloidal scale microgels where particle-particle interactions of different types (hard-sphere like, electrostatic), and in some cases counterions, produce a measurable osmotic resistance even before close-packing [19,21,22,46–49].
(2) In a first regime of compression, at effective volume fractions between fHS,RCP and 1, the compression resistance rises from zero to a value that is close to the resistance of a dextran solution of the same average concentration. Images of the packings in that range of concentration indicate that the microgels increasingly pack and deform with compression, while the internal dextran concentration is close to the native one. So the microgels behave like objects that only deform and do not loose internal volume upon compression, as in the case for emulsions for instance. A similar behavior has been reported lately by Bouhid de Aguiar and coworkers with polyacrylamide microgel particles of slightly smaller size (~10 um) [24]. Interestingly, the fact that shape deformation dominates over squeezing in a first regime of compression was also recently observed for colloidal pNIPAM microgels [26]. In that case however, interpenetration effects are also significant [25,26]; while such effects are not visible in the present work. We note finally that compression never leads in our case to highly ordered crystal structures, as it was observed with colloidal and polydisperse polyelectrolyte microgels [21,22,29,30]. This is probably because the size distribution of the microgels is relatively unchanged upon compression in our case, while for pNIPAM colloidal microgels, charge effects makes the largest microgels deswell before the smaller ones, thus decreasing size polydispersity and inducing crystallization [22].
(3) In a second regime of compression, at effective volume fractions ζ ≥ 1, the resistance of the packings to compression becomes similar to that of a homogeneous solution of the polymer that constitutes the microgels. In this regime, the only way to concentrate the system is to compress the individual microgels in the packing. The microgels are strongly deformed and squeezed, leading to reduction of size, and increased internal dextran concentration. The deformation is however not sufficient to close all interstitial spaces in the packings. This is here an interesting and potentially important difference with colloidal scale microgels where the persistence of interstitial voids in highly dense packings is usually not considered or observed [3,22,26].
Next, we focus on points (2) and (3) and look for qualitative and/or quantitative explanations for our results using existing theoretical frameworks.
15
At concentrations between ζ = fHS,RCP and ζ = 1, the microgels mainly deform upon compression, and seem to act similarly to emulsions, which we take as a reference case. The osmotic resistance of concentrated emulsions was investigated by Mason and co-workers in the late 1990s [50,68]. These authors propose a 'network spring model' to describe the osmotic pressure at ζ > fRCP [68]. In this model, the pressure depends on the number of facets formed between neighboring droplets in the packing. Any additional facet behaves as a spring that further resists compression. The number of springs between neighboring droplets grows as ~(ζ-fRCP), while the number of droplets per unit volume grows with ζ. We then have:
Π ~ ζ (ζ - fHS,RCP) (5)
For all the microgels investigated, we find that the experimental osmotic pressure qualitatively follows the emulsion model in the concentration range fHS,RCP < ζ < 1 (Fig. 6A-D). This suggests that the resistance to compression of the microgel packings has a similar origin as that of emulsions: a network of facets acting like springs between neighboring microgels. For emulsions, the spring constant is given by the droplets surface tension [68], while for microgels packings, it is the elastic modulus of the microgel particles that sets the force of theses springs [69].
0 200 400 600 800 1000 103 104 105 106 107
Polymer concentration C,Ci (g/L)
Emulsion model Polymer gel model P (Pa) z = 1 A. G100-89 0 200 400 600 800 1000 103 104 105 106 107
Polymer concentration C,Ci (g/L)
Emulsion model P (Pa) z = 1 B. G25-68 Polymer gel model
16 Figure 6. Compression resistance of the microgel packings as a function of the average polymer concentration in the system C (closed symbols) or the internal concentration of the microgels Ci (empty
symbols). At low effective volume fractions ζ ≤ 1, the packings mostly resist through deformation of the microgels and Π increases with C as it does for concentrated emulsions (blue line, [50]). At high effective volume fraction ζ ≥ 1, the systems mostly respond to compression by expelling water from the particles. This time Π increases with Ci as it does for a reticulated polymer gel of properties identical to the microgel
material (orange line, [45]).
At ζ > 1, the microgels reduce their size and expel water, as reported in Figs 4A and 4C. On the other hand, the void fraction in the packing does not totally vanish (Figs. 4B and 5), suggesting that deformation is not preponderant in this regime. So as a first approximation, we consider the resistance to compression of the packings to be essentially due to the resistance of the individual microgels to deswelling. In that case, the Flory-Rehner (FR) theory for the osmotic pressure of connected gels is directly applicable [2,40–45]. The theory describes the osmotic pressure Π as a sum of a mixing contribution Πm and an elastic contribution Πel. The mixing contribution results from the entropy of mixing of the polymer segments with the solvent. It corresponds to the osmotic pressure of the dextran polymers that we measure experimentally (empty symbols in Fig. 2). These osmotic pressures are described by
Πm = aCb (6)
with Π in Pa, C in g/L, and a = 0.420 or 0.095 and b = 2.34 or 2.56 for dextran T40 and dexMA, respectively. Such simple empirical power-law expressions are commonly used for describing the osmotic pressure of polymers [70].
The elastic contribution results from the presence of crosslinks that prevent the polymer gel from fully swelling and dissolving. It is a negative contribution to the osmotic pressure that can be approximated using the following equation [45]:
0 200 400 600 800 1000 103 104 105 106 107
Polymer concentration C,Ci (g/L)
Emulsion model Polymer gel model P (Pa) z = 1 C. MD-66 0 200 400 600 800 1000 103 104 105 106 107
Polymer concentration C,Ci (g/L)
Emulsion model Polymer gel model P (Pa) z = 1 D. MD-61
17
(7)
with NA the Avogadro number, kB the Boltzmann constant, T the temperature, Nx the number of
monomers between crosslinks, Mmonomer the molecular mass of the monomer (180 g/mol), and f the functionality of the crosslinks (taken as f = 4). ϕ is the polymer volume fraction in the gel matrix, while ϕref is the polymer volume fraction at a reference state, generally taken as when the chains between the crosslinks are fully relaxed (for a critical review about the definition of ϕref, we refer the reader to [44,71]). For gels of crosslinked dextran and similar polymers, van der Sman finds using FR theory that ϕref ≈ 2/3 ϕ0, with ϕ0 the polymer volume fraction of the fully swollen gel at zero osmotic pressure [45]. ϕ0 can be directly calculated from Ci,0 (Table 1), using ϕ0 = Ci,0/ddex.
Nx is calculated for each microgel using the native dextran concentration in the fully swollen state, where Π = 0 and therefore Πm(Ci,0) = - Πel(ϕ0).
This model is now compared with the osmotic pressure data plotted as a function of the internal concentration of the microgels (open symbols in Fig. 6), as it is this concentration that determines the resistance to compression in the framework of the Flory-Rehner theory. The agreement between the model and our experimental data is quite satisfactory in all cases. This suggests that we have found a way to predict the osmotic resistance of the packings based on the knowledge of the internal concentration of the microgels.
This is a subtle but important difference with highly compressed packings of microgels that no longer contain voids, like those studied by Menut et al. for instance [3]. For these packings, the average polymer concentration obviously matches the internal concentration of the microgels, and the osmotic pressure can directly be predicted with Flory-Rehner theory using the average concentration in the system [3,45]. When dealing with microgel packings with voids, as in the present work, the prediction is complicated by the necessity to determine the actual degree of squeezing from which the internal polymer concentration needs to be derived.
Conclusion
In this paper, we report on the behavior of suspensions of granular-scale dextran microgels when exposed to an external osmotic pressure. Our experiments assess the resistance of the packings to compression, as well give qualitative and quantitative information about the structure of the packings. As expected for granular, non-brownian microgels, the resistance to compression starts to rise at the vicinity of the volume fraction of random close-packing. In a first range of compressions that exceed this value, the microgels mainly deform, leading to a strong rise in resistance, in analogy with emulsion systems. In a second higher regime of compression, the microgels mainly respond to compression by expelling water. The resistance to compression of these systems can be estimated through a Flory-Rehner model based on the actual polymer concentration inside the microgel particles, therewith taking into account the presence of persistent voids in the packings.
1 3
dex A B 2
el ref
x monomer ref ref
d N k T Π N M f f f f f f é æ ö ù ê ú = - - çç ÷÷ ê è ø ú ë û
18
With these results, we demonstrate that loose to dense packings of neutral and granular-scale microgels clearly do not respond to compression as a uniform gel of the same material at the same average concentration; an analogy that has been used so far in literature for very dense packings of colloidal microgels where persistent voids are inexistent [3]. As a perspective, it would be interesting to focus on the resistance to compression of more complex systems like packings of colloidal-sized polyelectrolyte microgels for instance, in relation with effects that were recently reported with such systems, e.g. interpenetration [25] and crystallization [22]. This would lead to a better understanding of how a collection of deformable and compressible particles resist to an increase in concentration, depending on the size and architecture of the involved particles. Such information would in turn be highly useful for predicting concentration operations, e.g. filtration of microgels, in which resistance determines overall productivity.
Acknowledgements
Izabella Bouhid de Aguiar acknowledges the European Commission - Education, Audiovisual and Culture Executive Agency (EACEA) for the PhD scholarship granted under the program Erasmus Mundus Doctorate in Membrane Engineering - EUDIME (FPA no. 2011-0014, Edition III, http://eudime.unical.it). We thank Cécile Pouzet and Alain Jauneau for technical assistance in the use of the CLSM instrument, as well as Emmanuel Cid (LGC) for his scientific and technical support for the treatment of the CLSM images.
Supplementary materials
Additional information about the preparation of the dexMA microgels and the way the CLSM images are treated are given. We also provide examples of CLSM images obtained with the compressed suspensions of dexMA microgels.
References
[1] F.A. Plamper, W. Richtering, Functional Microgels and Microgel Systems, Acc. Chem. Res. 50 (2017) 131–140.
[2] J.J.F. Sleeboom, P. Voudouris, M.T.J.J.M. Punter, F.J. Aangenendt, D. Florea, P. van der Schoot, H.M. Wyss, Compression and Reswelling of Microgel Particles after an Osmotic Shock, Phys. Rev. Lett. 119 (2017) 098001.
[3] P. Menut, S. Seiffert, J. Sprakel, D.A. Weitz, Does size matter? Elasticity of compressed suspensions of colloidal- and granular-scale microgels, Soft Matter. 8 (2012) 156–164.
[4] B.R. Saunders, B. Vincent, Microgel particles as model colloids: theory, properties and applications, AdvColloid Interface Sci. 80 (1999) 1–25.
[5] B.R. Saunders, N. Laajam, E. Daly, S. Teow, X. Hu, R. Stepto, Microgels: From responsive polymer colloids to biomaterials, Adv. Colloid Interface Sci. 147–148 (2009) 251–262.
19 for drug delivery applications, Prog. Polym. Sci. 33 (2008) 448–477.
[7] E. Dickinson, Microgels — An alternative colloidal ingredient for stabilization of food emulsions, Trends Food Sci. Technol. 43 (2015) 178–188.
[8] A. Bouchoux, P. Qu, P. Bacchin, G. Gésan-Guiziou, A General Approach for Predicting the Filtration of Soft and Permeable Colloids: The Milk Example, Langmuir. 30 (2014) 22–34.
[9] O. Nir, T. Trieu, S. Bannwarth, M. Wessling, Microfiltration of deformable microgels, Soft Matter. 12 (2016) 6512–6517.
[10] W.M. Lu, K.L. Tung, C.H. Pan, K.J. Hwang, Crossflow microfiltration of mono-dispersed deformable particle suspension, J. Membr. Sci. 198 (2002) 225–243.
[11] K.J. Hwang, C.L. Hsueh, Dynamic analysis of cake properties in microfiltration of soft colloids, J. Membr. Sci. 214 (2003) 259–273.
[12] K. Horigome, D. Suzuki, Drying Mechanism of Poly(N-isopropylacrylamide) Microgel Dispersions, Langmuir. 28 (2012) 12962–12970.
[13] C. Sadek, L. Pauchard, P. Schuck, Y. Fallourd, N. Pradeau, C. Le Floch-Fouéré, R. Jeantet, Mechanical properties of milk protein skin layers after drying: Understanding the mechanisms of particle formation from whey protein isolate and native phosphocaseinate, Food Hydrocoll. 48 (2015) 8–16. [14] M. Cloitre, R. Borrega, F. Monti, L. Leibler, Structure and flow of polyelectrolyte microgels: from suspensions to glasses, Comptes Rendus Phys. 4 (2003) 221–230.
[15] C. Pellet, M. Cloitre, The glass and jamming transitions of soft polyelectrolyte microgel suspensions, Soft Matter. 12 (2016) 3710–3720.
[16] C.L.A. Berli, D. Quemada, Rheological Modeling of Microgel Suspensions Involving Solid/Liquid Transition, Langmuir. 16 (2000) 7968–7974.
[17] A. Bouchoux, B. Debbou, G. Gesan-Guiziou, M.H. Famelart, J.L. Doublier, B. Cabane, Rheology and phase behavior of dense casein micelle dispersions, J. Chem. Phys. 131 (2009) 165106–165111. [18] P. van der Scheer, T. van de Laar, J. van der Gucht, D. Vlassopoulos, J. Sprakel, Fragility and Strength in Nanoparticle Glasses, ACS Nano. 11 (2017) 6755–6763.
[19] M. Pelaez-Fernandez, A. Souslov, L.A. Lyon, P.M. Goldbart, A. Fernandez-Nieves, Impact of Single-Particle Compressibility on the Fluid-Solid Phase Transition for Ionic Microgel Suspensions, Phys. Rev. Lett. 114 (2015) 098303.
[20] U. Gasser, J.-J. Lietor-Santos, A. Scotti, O. Bunk, A. Menzel, A. Fernandez-Nieves, Transient formation of bcc crystals in suspensions of poly(N-isopropylacrylamide)-based microgels, Phys. Rev. E. 88 (2013) 052308.
[21] A. Scotti, U. Gasser, E.S. Herman, M. Pelaez-Fernandez, J. Han, A. Menzel, L.A. Lyon, A. Fernández-Nieves, The role of ions in the self-healing behavior of soft particle suspensions, Proc. Natl. Acad. Sci. (2016) 201516011.
[22] A. Scotti, U. Gasser, E.S. Herman, J. Han, A. Menzel, L.A. Lyon, A. Fernandez-Nieves, Phase behavior of binary and polydisperse suspensions of compressible microgels controlled by selective particle deswelling, Phys. Rev. E. 96 (2017) 032609.
20 [23] G. Romeo, L. Imperiali, J.W. Kim, A. Fernandez-Nieves, D.A. Weitz, Origin of de-swelling and dynamics of dense ionic microgel suspensions, J. Chem. Phys. 136 (2012) 124905–124909.
[24] I. Bouhid de Aguiar, T. Laar, M. Meireles, A. Bouchoux, J. Sprakel, K. Schroën, Deswelling and deformation of microgels in concentrated packings, Sci. Rep. 7 (2017) 10223.
[25] A. Stradner, J.J. Crassous, K. van Gruijthuijsen, M. Obiols-Rabasa, P. Schurtenberger, P.S. Mohanty, R. Schweins, S. Nöjd, Interpenetration of polymeric microgels at ultrahigh densities, Sci. Rep. 7 (2017) 1487.
[26] G.M. Conley, P. Aebischer, S. Nöjd, P. Schurtenberger, F. Scheffold, Jamming and overpacking fuzzy microgels: Deformation, interpenetration, and compression, Sci. Adv. 3 (2017) e1700969.
[27] J. Mattsson, H.M. Wyss, A. Fernandez-Nieves, K. Miyazaki, Z. Hu, D.R. Reichman, D.A. Weitz, Soft colloids make strong glasses, Nature. 462 (2009) 83–86.
[28] J. Linkhorst, T. Beckmann, D. Go, A.J.C. Kuehne, M. Wessling, Microfluidic colloid filtration, Sci. Rep. 6 (2016) 22376.
[29] S.B. Debord, L.A. Lyon, Influence of Particle Volume Fraction on Packing in Responsive Hydrogel Colloidal Crystals, J. Phys. Chem. B. 107 (2003) 2927–2932.
[30] A.S.J. Iyer, L.A. Lyon, Self-Healing Colloidal Crystals, Angew. Chem. Int. Ed. 48 (2009) 4562– 4566.
[31] P. Bacchin, D. Si-Hassen, V. Starov, M.J. Clifton, P. Aimar, A unifying model for concentration polarization, gel-layer formation and particle deposition in cross-flow membrane filtration of colloidal suspensions, Chem. Eng. Sci. 57 (2002) 77–91.
[32] M. Elimelech, S. Bhattacharjee, A novel approach for modeling concentration polarization in crossflow membrane filtration based on the equivalence of osmotic pressure model and filtration theory, J. Membr. Sci. 145 (1998) 223–241.
[33] R.W. Style, S.S.L. Peppin, Crust formation in drying colloidal suspensions, Proc. R. Soc. Math. Phys. Eng. Sci. 467 (2011) 174–193.
[34] A. Merlin, J.B. Salmon, J. Leng, Microfluidic-assisted growth of colloidal crystals, Soft Matter. 8 (2012) 3526–3537.
[35] C. Bonnet-Gonnet, L. Belloni, B. Cabane, Osmotic pressure of latex dispersion, Langmuir. 10 (1994) 4012–4021.
[36] M. Rubinstein, R.H. Colby, A.V. Dobrynin, Dynamics of Semidilute Polyelectrolyte Solutions, Phys. Rev. Lett. 73 (1994) 2776–2779.
[37] R.S. Koene, T. Nicolai, M. Mandel, Scaling relations for aqueous polyelectrolyte-salt solutions. 3. Osmotic pressure as a function of molar mass and ionic strength in the semidilute regime, Macromolecules. 16 (1983) 231–236.
[38] A.V. Dobrynin, R.H. Colby, M. Rubinstein, Scaling Theory of Polyelectrolyte Solutions, Macromolecules. 28 (1995) 1859–1871.
[39] M. Rubinstein, R.H. Colby, A.V. Dobrynin, J.F. Joanny, Elastic Modulus and Equilibrium Swelling of Polyelectrolyte Gels, Macromolecules. 29 (1996) 398–406.
21 [40] P.J. Flory, Principles of polymer chemistry, Cornell University Press, Ithaca, 1969.
[41] P.J. Flory, J.R. Jr, Statistical Mechanics of Cross-Linked Polymer Networks II. Swelling, J. Chem. Phys. 11 (1943) 521–526.
[42] A. Fernandez-Nieves, A. Fernandez-Barbero, B. Vincent, F.J. Nieves, Osmotic de-swelling of ionic microgel particles, J. Chem. Phys. 119 (2003) 10383–10388.
[43] D. Capriles-González, B. Sierra-Martín, A. Fernández-Nieves, A. Fernández-Barbero, Coupled Deswelling of Multiresponse Microgels, J. Phys. Chem. B. 112 (2008) 12195–12200.
[44] M. Quesada-Pérez, J.A. Maroto-Centeno, J. Forcada, R. Hidalgo-Alvarez, Gel swelling theories: the classical formalism and recent approaches, Soft Matter. 7 (2011) 10536–10547.
[45] R.G.M. van der Sman, Biopolymer gel swelling analysed with scaling laws and Flory–Rehner theory, Food Hydrocoll. 48 (2015) 94–101.
[46] A. Bouchoux, P.E. Cayemitte, J. Jardin, G. Gésan-Guiziou, B. Cabane, Casein micelle dispersions under osmotic stress, Biophys. J. 96 (2009) 693–706.
[47] R. Roa, E.K. Zholkovskiy, G. Nägele, Ultrafiltration modeling of non-ionic microgels, Soft Matter. 11 (2015) 4106–4122.
[48] M.M. Hedrick, J.K. Chung, A.R. Denton, Structure and osmotic pressure of ionic microgel dispersions, J. Chem. Phys. 142 (2015) 034904.
[49] P.S. Mohanty, D. Paloli, J.J. Crassous, E. Zaccarelli, P. Schurtenberger, Effective interactions between soft-repulsive colloids: Experiments, theory, and simulations, J. Chem. Phys. 140 (2014) 094901. [50] T.G. Mason, M.D. Lacasse, G.S. Grest, D. Levine, J. Bibette, D.A. Weitz, Osmotic pressure and viscoelastic shear moduli of concentrated emulsions, Phys. Rev. E. 56 (1997) 3150–3166.
[51] W. Schaertl, H. Sillescu, Brownian dynamics of polydisperse colloidal hard spheres: Equilibrium structures and random close packings, J. Stat. Phys. 77 (1994) 1007–1025.
[52] P. Flodin, The Sephadex story, Polym. Eng. Sci. 38 (1998) 1220–1228.
[53] R.J.H. Stenekes, O. Franssen, E.M.G. van Bommel, D.J.A. Crommelin, W.E. Hennink, The Preparation of Dextran Microspheres in an All-Aqueous System: Effect of the Formulation Parameters on Particle Characteristics, Pharm. Res. 15 (1998) 557–561.
[54] R.J.H. Stenekes, O. Franssen, E.M.G. van Bommel, D.J.A. Crommelin, W.E. Hennink, The Preparation of Dextran Microspheres in an All-Aqueous System: Effect of the Formulation Parameters on Particle Characteristics, Pharm. Res. 15 (1998) 557–561.
[55] R.J.H. Stenekes, S.C. De Smedt, J. Demeester, G. Sun, Z. Zhang, W.E. Hennink, Pore Sizes in Hydrated Dextran Microspheres, Biomacromolecules. 1 (2000) 696–703.
[56] R.J.H. Stenekes, W.E. Hennink, Equilibrium water content of microspheres based on cross-linked dextran, Int. J. Pharm. 189 (1999) 131–135.
[57] Y. Liu, R. Lipowsky, R. Dimova, Concentration Dependence of the Interfacial Tension for Aqueous Two-Phase Polymer Solutions of Dextran and Polyethylene Glycol, Langmuir. 28 (2012) 3831– 3839.
22 [58] C.H. Kang, S.I. Sandler, Effects of polydispersivity on the phase behavior of the aqueous two-phase polymer systems, Macromolecules. 21 (1988) 3088–3095.
[59] B.G. De Geest, C. Déjugnat, M. Prevot, G.B. Sukhorukov, J. Demeester, S.C. De Smedt, Self-Rupturing and Hollow Microcapsules Prepared from Bio-polyelectrolyte-Coated Microgels, Adv. Funct. Mater. 17 (2007) 531–537.
[60] Correction, Biophys. J. 96 (2009) 2547.
[61] F. Cavalieri, E. Chiessi, I. Finelli, F. Natali, G. Paradossi, M.F. Telling, Water, Solute, and Segmental Dynamics in Polysaccharide Hydrogels, Macromol. Biosci. 6 (2006) 579–589.
[62] C. Reid, R.P. Rand, Fits to Osmotic Pressure Data, Biophys. J. 73 (1997) 1692–1694.
[63] G.R. Farrell, K.M. Martini, N. Menon, Loose packings of frictional spheres, Soft Matter. 6 (2010) 2925–2930.
[64] S. Kuga, Pore size distribution analysis of gel substances by size exclusion chromatography, J. Chromatogr. A. 206 (1981) 449–461.
[65] R. Podgornik, J. Hopkins, V.A. Parsegian, M. Muthukumar, Polymers Pushing Polymers: Polymer Mixtures in Thermodynamic Equilibrium with a Pore, Macromolecules. 45 (2012) 8921–8928.
[66] P.A. Gurnev, C.B. Stanley, M.A. Aksoyoglu, K. Hong, V.A. Parsegian, S.M. Bezrukov, Poly(ethylene glycol)s in Semidilute Regime: Radius of Gyration in the Bulk and Partitioning into a Nanopore, Macromolecules. 50 (2017) 2477–2483.
[67] Rand, Osmotic Pressure Data, (n.d.). https://brocku.ca/researchers/peter_rand/osmotic/osfile.html (accessed April 13, 2018).
[68] T.G. Mason, J. Bibette, D.A. Weitz, Elasticity of Compressed Emulsions, Phys. Rev. Lett. 75 (1995) 2051–2054.
[69] S. Nezamabadi, Radjai, Farhang, Averseng, Julien, Delenne, Jean-Yves, Implicit frictional-contact model for soft particle systems, J. Mech. Phys. Solids. 83 (2015) 72–87.
[70] J.A. Cohen, S. Highsmith, An improved fit to Website osmotic pressure data, Biophys. J. 73 (1997) 1689–1692.
[71] C.G. Lopez, W. Richtering, Does Flory–Rehner theory quantitatively describe the swelling of thermoresponsive microgels?, Soft Matter. 13 (2017) 8271–8280.