Publisher’s version / Version de l'éditeur:
Analytical Chemistry, 90, 3, pp. 1547-1553, 2018-01-05
READ THESE TERMS AND CONDITIONS CAREFULLY BEFORE USING THIS WEBSITE. https://nrc-publications.canada.ca/eng/copyright
Vous avez des questions? Nous pouvons vous aider. Pour communiquer directement avec un auteur, consultez la
première page de la revue dans laquelle son article a été publié afin de trouver ses coordonnées. Si vous n’arrivez pas à les repérer, communiquez avec nous à [email protected].
Questions? Contact the NRC Publications Archive team at
[email protected]. If you wish to email the authors directly, please see the first page of the publication for their contact information.
NRC Publications Archive
Archives des publications du CNRC
This publication could be one of several versions: author’s original, accepted manuscript or the publisher’s version. / La version de cette publication peut être l’une des suivantes : la version prépublication de l’auteur, la version acceptée du manuscrit ou la version de l’éditeur.
For the publisher’s version, please access the DOI link below./ Pour consulter la version de l’éditeur, utilisez le lien DOI ci-dessous.
https://doi.org/10.1021/acs.analchem.7b04376
Access and use of this website and the material on it are subject to the Terms and Conditions set forth at
Low-temperature and atmospheric pressure sample digestion using
dielectric barrier discharge
Luo, Yijing; Yang, Yuan; Lin, Yao; Tian, Yunfei; Wu, Li; Yang, Lu; Hou,
Xiandeng; Zheng, Chengbin
https://publications-cnrc.canada.ca/fra/droits
L’accès à ce site Web et l’utilisation de son contenu sont assujettis aux conditions présentées dans le site LISEZ CES CONDITIONS ATTENTIVEMENT AVANT D’UTILISER CE SITE WEB.
NRC Publications Record / Notice d'Archives des publications de CNRC:
https://nrc-publications.canada.ca/eng/view/object/?id=3ed06a16-1ba4-42f3-8081-d4ceb9ad458a https://publications-cnrc.canada.ca/fra/voir/objet/?id=3ed06a16-1ba4-42f3-8081-d4ceb9ad458aLow-Temperature and Atmospheric Pressure Sample Digestion
Using Dielectric Barrier Discharge
Yijing Luo,
†Yuan Yang,
†Yao Lin,
†Yunfei Tian,
‡Li Wu,
‡Lu Yang,
§Xiandeng Hou,
†,‡and Chengbin Zheng
*
,††
Key Laboratory of Green Chemistry & Technology of MOE, College of Chemistry, Sichuan University, Chengdu, Sichuan 610064, China
‡
Analytical & Testing Center, Sichuan University, Chengdu, Sichuan 610064, China
§
National Research Council Canada, 1200 Montreal Road, Ottawa, Ontario K1A 0R6, Canada
*
S Supporting InformationABSTRACT: A new sample digestion method using a double layer and coaxial dielectric barrier discharge (DBD) digestion reactor was developed for the sensitive determination of trace elements in rice samples. All the operation parameters of the DBD microplasma and other digestion conditions were carefully optimized. Three DBD-digestion modes were investigated for real matrix samples, including H2O-DBD-digestion, H2O2-DBD-digestion, and HNO3-DBD-diges-tion systems. Among the three modes, the H2O-DBD-digestion system provides a suitable digestion of sample without any additional chemicals, achieving environmental friendly sample treatment and eliminating the potential interferences. Under the optimized conditions, limits of detection for Mg, Mn, Zn, Cd, Cr, Co, and As were in the range of 0.01−0.35 ng g−1 by inductively coupled plasma mass spectrometry (ICPMS). The accuracy of the proposed
method was checked by analysis of a certified reference material (GBW10043) and spiked samples with satisfactory results (83− 113% recoveries).
I
n order to alleviate the serious interferences from matrix constituents and achieve reproducible and accurate analytical results, complete digestion of sample is necessary prior to the determination of the elements in complex samples by atomic spectrometry.1 Up to date, numerous sample digestion methods have been available for routine digestion of samples in laboratories, such as conventional electrically heated digestion, microwave digestion (MWD), and microwave-induced combustion (MIC). Conventional heated digestion and MWD generally consume large amounts of concentrated mineral acids, which inevitably introduce a relatively high blank because of acid impurities. Although MWD significantly improves digestion efficiency, minimizes analyte loss, and reduces digestion time,1−3 more time is needed to coolpressurized vessels to room temperature before opening the caps of digestion vessels. Furthermore, a time-consuming step is usually needed to evaporate the acids from the digestion solution prior to analysis because large amounts of mineral acids were used during sample digestion. Compared to the conventional digestion techniques, MIC combined with acid extraction was regarded as a relatively ideal digestion technique not only because of minimization of concentrated acids consumption but also due to reduction of digestion time and interference in inductively coupled plasma mass spectrometry (ICPMS) analysis.4,5 MIC has also been successfully used to
pretreat complex matrix containing volatile elements such as Hg and halogens with a closed system.6,7 Unfortunately, pressurized vessels (20 bar) with oxygen were needed in this method and might limit its further application.
Recently, significant efforts have been devoted to develop rapid and efficient methods for the digestion of complex samples aiming to reduce or even eliminate the use of concentrated acids. Advanced oxidation processes (AOPs) based on UV irradiation with/without photocatalysts and oxidizing reagents, ozone in the presence/absence of UV or ultrasound irradiation, UV photocatalysis, or Fenton reaction, which involves in situ generation of highly potent chemical oxidizing species (hydroxyl radical, ·OH etc.), have been regarded as efficient techniques for the decomposition of organic pollutants in wastewater and as a promising alternative to the conventional sample digestion techniques for the determination of trace elements by atomic spectrometry.8−12
Various Fenton-like catalysts were used to improve the digestion capabilities of AOPs, including Fe0 and Fe
3O4 nanomaterials. These materials remarkably accelerate the Received: October 24, 2017
Accepted: January 5, 2018
Published: January 5, 2018
pubs.acs.org/ac
Cite This:Anal. Chem. 2018, 90, 1547−1553
generation of oxidizing radicals from H2O2, significantly improving the digestion performance of AOPs. For example, Zheng and co-workers10found that addition of Fe3O4magnetic nanoparticles (MNPs) into MWD of fish samples not only greatly minimized the consumption of HNO3to 12.5% of the amount used for the conventional MWD but also substantially decreased digestion time and temperature to 6 min and 80 °C, respectively. Moreover, this Fe3O4accelerated MWD technique integrates accelerated MWD, solid phase extraction (SPE), and magnetic separation into a single step, significantly simplifying the sample pretreatment. Although reported AOPs based digestion techniques are versatile and useful for the complete digestion of some samples and overcome shortcomings associated with the conventionally electric heated digestion and MWD to a certain extent, they still require concentrated acid, oxidizing chemicals, and relatively expensive nanomaterials to improve digestion speed. Therefore, it is challenging to develop oxidizing chemicals and concentrated acid free techniques for efficient sample digestion.
Low temperature atmospheric pressure plasma has been widely used for the degradation of organic pollutants in wastewater and gas because of the UV irradiation and highly potent chemical oxidizing species (O3, ·OH) generated in plasma.13−16Usually, plasma applied in treatment of wastewater
and gas is generated by discharging under atmospheric pressure.17−19There is no isolation between metal electrodes
and wastewater or gas, which could lead to high background intensity because of metal sputtering from electrodes and make it difficult to be utilized in sample digestion. Dielectric barrier discharge (DBD) has a high ionization efficiency, and it is a typical nonequilibrium gas discharge generated between two electrodes which could be isolated by a quartz tube to avoid contamination from metal electrodes to solutions. These features make DBD widely used in an atomic spectrometer as an atomization source. To the best of our knowledge, the research on utilizing low temperature atmospheric pressure DBD plasma in sample digestion has not been reported so far. On the basis of low temperature and low power consumption DBD plasma, the aim of this study was to develop an effective and eco-friendly sample pretreatment method for the sensitive determination of trace elements by one-step digestion without using any oxidizing chemicals or concentrated acids.
■
EXPERIMENTAL SECTIONInstrumentation. Figure 1a,c provides a schematic and photo of the DBD-digestion system, which was constructed with a cycle injection system and a double layer and coaxial DBD device. The liquid in glass vials was pumped into a three-way valve through a peristaltic pump (BT100-02, Baoding Qili Precision Pump Company, Ltd., Baoding, China) and loaded into the DBD device with carrier gas (air) and cyclically pumped into the DBD device for the next round digestion. As shown inFigure 1b, the DBD device consisted of two quartz tubes (the outer tube: 110 mm × 7 mm o.d. × 6 mm i.d.; the inner tube: 100 mm × 3 mm o.d. × 2 mm i.d.) and two separated copper wires. Copper wires were used as electrodes, which were tightly wrapped around the outside of the outer tube evenly and inserted into the inner tube, respectively. The liquid was pumped into the annular space between the two quartz tubes. The air carrier gas was continuously introduced into the system with an air pump (XWK-3B Oil-free air pump, Tianjin, China), which not only completely mixed and dispersed sample in the digestion solution but also generated
stable gas spaces for improving the digestion performance and the stability of DBD discharge. Therefore, this digestion system worked continuously. To avoid cross contamination between samples, the DBD-digestion device was cleaned by flushing with deionized water for 3 min and 5% (v/v) HNO3for 3 min, respectively, after each digestion. The electrodes of DBD were connected to an alternating current (AC) power supply (CTP-2000 K, high performance computerized plasma discharge experiment generator, Nanjing, China). The DBD plasma was generated when 15 V of voltage was supplied between the two electrodes. A detailed description of the plasma power supply is available inTable S1. The plasma generation power supply was connected to a transformer (TP GC2J-1, Shanghai Pafe Electronic Equipment Ltd. Co., Shanghai, China) for convenient adjustment of the discharge power. Digestion efficiency is indicated by chemical oxygen demand (COD) value (Digestion instrument, LTG082.03.40003; COD ana-lyzer, DR1010, HACH, USA). After digestion, samples were analyzed by inductively coupled plasma mass spectrometry (ICPMS, ICAP Q, Thermo Fisher Scientific Inc., Germany). Nitrite in digestion solutions was tested by ion chromatography (ICS-90, Dionex, China). A commercial hand-held charge coupled device (CCD) spectrometer (Maya2000 Pro, Ocean Optics Inc., Dunedin, FL) was used to acquire the spectra signal of DBD. Electron paramagnetic resonance experiments were performed on an EPR spectrometer (EXM, Bruker, Germany) with 5,5-dimethyl-1-pyrroline N-oxide (DMPO) as a spin-trapping agent.
Reagents and Materials. All the reagents were of analytical grade or better. All solutions were prepared using 18.2 MΩ cm deionized water (DIW) produced by a water
Figure 1. (a, c) The schematic and photo of the DBD-digestion device. 1, gas flow meter; 2, pump; 3, four glass vials in an ice box; 4, power supply; 5, three-way valve; 6, copper electrodes; 7, quartz tube. (b) A detailed drawing of the DBD plasma device. (d) Simultaneous discharge of four coaxial DBDs.
Analytical Chemistry Technical Note
DOI:10.1021/acs.analchem.7b04376
Anal. Chem. 2018, 90, 1547−1553
purification system (Chengdu Ultrapure Technology Co., China). Nitric acid (65%, Merck, Germany) was used in this experiment. 30% hydrogen peroxide was purchased from Kelong Chemical Reagents Co. (Chengdu, China). High-purity argon (Ar) was supplied by Qiaoyuan Gas Co. (Chengdu, China). A Certified Reference Material (CRM) of rice (GBW10043) and stock solutions (1000 mg L−1) of Mg, Mn, Zn, Cd, Cr, Co, and As were obtained from the National Research Center of China (NRCC, Beijing, China). Other rice samples were bought from a local supermarket in Chengdu, China. COD reagents (A: sulfuric acid 15.0−25.0%, mercuric sulfuric 1.0−10.0%; B: sulfuric acid 90.0−100.0%, silver sulfuric 0.5−3.0%, potassium dichromate <0.1%) were purchased from HACH, USA. DMPO (5,5-dimethyl-1-pyrroline N-oxide, 97%, CAS: 3317-61-1) for capturing hydroxyl radical was purchased from J&K Chemical Ltd., China.
Digestion and Analytical Procedure. The operation process of sample digestion is described and shown inFigure S1. In order to evenly mix rice powder with the digestion solution and avoid settling of the sample in the vial, all of the rice samples were ground to less than 150 mesh, except the certified reference material of rice powder (GBW10043), sealed in polyethylene bags, and stored in a refrigerator at 4 °C prior to their analysis. 0.0240 g of CRMs or rice powder was weighed into a vial in which 4 mL of digestion solution was added. For the rice samples obtained from local supermarkets, Cr, Co, As, and Cd stock solutions were spiked to certain concentrations before their digestion. The mixture was digested using three different DBD-digestion systems, respectively, including the H2O-DBD-digestion system, H2O2-DBD-digestion system, and HNO3-DBD-digestion system. Samples were diluted 50 times for the determination of Mg because of its high concentration in the analyzed samples, while the samples were diluted 5 times for the determinations of other elements. The operation conditions of ICPMS are shown inTable S2. A AS14 column was used to separate nitrite with a flow rate of 1.2 mL min−1. The details of the EPR experimental procedure used for the identification of oxidative radicals in the DBD plasma are available in Section 4 of theSupporting Information.
■
RESULTS AND DISCUSSIONFeasibility and Improvement of DBD-Digestion Technique. Although low temperature atmospheric pressure plasma has been widely used for the degradations of organic pollutants in wastewater, the research on utilizing it in sample digestion has not been reported so far. The feasibility of the DBD-digestion technique was thus undertaken using a rice powder obtained from a local supermarket. 0.0240 g of this rice powder was added into a vial together with 4 mL of DIW and subsequently digested in the DBD plasma. As the digestion time increased, the digested solution gradually became clear. However, it was observed that a small amount of yellow-white solid was still left on the inner wall of the quartz tube. To gain insight into this effect, an infrared thermometer was used to measure the temperature of the solution in the DBD chamber. The temperature was found to be above 60 °C, suggesting that a solvent (DIW) evaporation occurred at this temperature and thus resulting in inefficient digestion to cause solids adhesion to the quartz tube wall, as well as possible loss of elements. An ice box was thus used to avoid the above problem by cooling the solution from the digestion tube. As shown inFigure 2a, the turbid solution became clear after 6 h of digestion. In previous work,20 digestion efficiency was evaluated through the
determination of residual carbon content (RCC) by using ICP-OES. However, the rice powder in the sample solution usually blocked the nebulizer of ICP-OES, and thus, it was not easy to use ICP-OES to evaluate the digestion efficiency of the developed system. COD is a traditional chemical method to measure the amount of material that needs to be oxidized in a water sample. This index is also one of the comprehensive indicators of relative content of organic matter in the solution. Therefore, COD was applied to characterize digestion efficiency of the developed system. Figure 2b shows that the COD value of digested solution gradually decreased with increasing digestion time. These results agree well with the phenomenon presented in Figure 2a and indicate that the organic compounds contained in the sample solution have been degraded efficiently by the DBD plasma after 6 h of digestion. In order to improve sample throughput, simultaneous discharge of four coaxial DBDs was designed and the goal of batch digestion was achieved, as shown inFigure 1a,d.
Effects of Operation Conditions on the Sample Digestion. From the above experiments, it is evident that organic substances could be degraded efficiently by DBD plasma with DIW only, but the digestion time is very long using the H2O-DBD-digestion method. In order to gain insight into the H2O-DBD-digestion and improve its digestion efficiency, the effects of the type and flow rate of discharge gas and the speed of the peristaltic pump on the digestion efficiency were investigated. As shown inFigure S2a, although both argon and air can be used as discharge gas to digest the rice sample to some certain extent with 6 h of digestion, it is evident that air as carrier gas had better efficiency compared to argon. This may be because oxygen contained in air can generate oxidative radicals or compounds with DBD excitation, thus accelerating digestion. Meanwhile, argon is much more expensive than air; thus, air was selected as the discharge gas in subsequent experiments. When the flow rate of air increased to above 40 mL min−1, complete digestion was achieved as indicated by clear solutions, as shown in Figure S2b. Thus, flow rate was maintained at 40 mL min−1for all subsequent experiments. The residence time of sample in the DBD device was dependent on the speed of the peristaltic pump.Figure S2cshows the effect of pump speed on the digestion; it was found that optimum digestion efficiency was obtained at 5 mL min−1and digestion efficiency decreased at higher or lower pump speeds. Thus, 5 mL min−1was selected for all subsequent experiments.
According to previous works, addition of oxidizing reagents, such as H2O2and HNO3, can significantly accelerate the speed
Figure 2.Pictures of H2O-DBD-digestion of rice powder. (a) Effect of digestion time: 0, 2, 4, and 6 h. (b) COD values of digests obtained under different digestion times.
of sample digestion. Therefore, the H2O2-DBD-digestion system and HNO3-DBD-digestion system were also applied to improve the performance of sample digestion by DBD plasma. Subsequently, the concentration of oxidizing chemicals, output power, and digestion time were optimized for these two systems, respectively. For the H2O2-DBD-digestion method, concentrations of H2O2 in a range of 4−30% were tested. As shown inFigure S2d, the clarity of the solution increased as the H2O2 concentration increased. Complete clear solution was obtained with the use of 30% H2O2whereas the same output power (50 W) and digestion time (40 min) were used. Thus, 30% H2O2was chosen as the optimal concentration of H2O2.
Figure S2eshows the effects of output power on the digestion efficiency when concentration of H2O2and digestion time were kept at 30% H2O2 and 40 min. With the increase of output power from 10 to 50 W, digestion solutions became gradually clear and became completely transparent at 50 W.Figure S2f
shows that digestion efficiency was also influenced by digestion time. A clear solution could be obtained at 40 min. Finally, 30% H2O2, 50 W of output power, and 40 min of digestion time were chosen as the optimized conditions for the H2O2 -DBD-digestion method.
For the HNO3-DBD-digestion method, the concentration of HNO3 in a range of 6−33% was tested. As shown inFigure S2g, the digestion efficiency increased with the increase of concentration of HNO3solution at 55 W of output power and 40 min of digestion time. The higher the concentration of HNO3, the better digestion efficiency and the less stable DBD discharge were obtained. The HNO3concentration was found to be an important factor influencing the stability of DBD. The DBD device could not discharge stably and efficiently when the concentration of HNO3 was higher than 33%. Consequently, 33% HNO3was chosen for all subsequent experiments.Figure
S2h shows the effect of output power on the digestion efficiency at 33% of HNO3and 40 min of digestion time. With the increase of output power from 15 to 55 W, the digestion solutions gradually became much clearer and became trans-parent at 55 W. The DBD plasma could not be generated when the output power was lower than 10 W. The relation between output power and input voltage can be found in Table S2.
Figure S2ishows the effect of digestion time on the digestion efficiency. A clear solution could be obtained at 40 min. Thus, 33% HNO3, 55 W of output power, and 40 min of digestion time were selected as the optimized conditions for the HNO3-DBD-digestion method.
In acidic solutions, Cr2O72− oxidizes reducing substances (both organic and inorganic). When Ag2SO4 is used as the catalyst, the majority of organic matters, including linear organic matter, can be oxidized in acidic solutions. This is an important basis of COD for the indication of digestion efficiency. Unfortunately, COD could not be applied to indicate the digestion efficiency of sample obtained using H2O2-DBD-digestion and HNO3-DBD-digestion systems because Cr2O72− not only oxidizes organic compounds but also oxidizes inorganic reducing substances under these conditions. In the H2O2-DBD-digestion system, the residual H2O2 could react with Cr2O72−, which would lead to interferences of reaction between organic matters and Cr2O7.2−21
+ + = + +
− + +
Cr O2 72 8H 3H O2 2 3O2 7H O2 2Cr3
Figure S3ashows that very little hydrogen peroxide in 4 mL of solution could cause significant interference to COD
detection. For the HNO3-DBD-digestion method, because of the interference of reaction between NO2−and Cr2O72−, COD detection could not be applied in solutions after digestion. As shown inFigure S4a,b, no NO2−could be detected before DBD digestion in nitric acid solution and the mixture of rice powder dissolved in nitric acid, respectively. However, NO2−could be detected after DBD digestion in the mixture of rice powder and nitric acid by the ion chromatogram (Figure S4c). The concentration of nitrite in solutions after digestion (2597 mg L−1) is above the COD detection range (Figure S3b). As a strong reducing group, NO2−could react with Cr2O72−, which would lead to interferences.
+ + = + +
− + − − +
Cr O2 72 8H 3NO2 3NO3 4H O2 2Cr3
Possible Mechanism of DBD Digestion.In this work, a series of physical and chemical effects generated in DBD discharge were used to achieve complete sample digestion. A series of light and acoustic phenomena, such as ultrasonic holes, shock waves, and ultraviolet light, occur during the DBD discharge, which are called physical effects. In the process of discharge, a plasma channel will be formed, along with the shock wave and ultrasonic cavitation.22,23Then, local hot spots are formed and transient supercritical water was formed eventually. Organic compounds and oxygen are completely miscible with supercritical water, allowing organic compounds to undergo spontaneous oxidation. UV light generated during the DBD discharge process allows photolysis reactions during the entire digestion process:
+ → · R hv R · → · + · → R R1 R2 products · + → · ++ · − R O2 R O2
Various active radicals and oxidizing groups generated in the DBD discharge could react with organic compounds in the solution and result in complete digestion. A variety of high-energy electrons could be obtained in the plasma generated in the DBD discharge process. These high-energy particles bombard molecules in aqueous solution, which leads to ionization and excitation of water molecules. Ions, excited molecules, and secondary electrons are generated to facilitate stronger reactions of substances, such as ·OH, ·H+, ·O, HO2·−, H2O2, and O3. These highly reactive oxidants can effectively oxidize and degrade organic compounds.
The spectroscopic technique was performed to measure optical emission spectra of the three DBD-digestion methods between 200 and 600 nm. As shown inFigure 3a, several peaks could be clearly identified according to previous studies.24,25 Peaks were observed at 299 nm corresponding to O3, in addition to a peak observed at 440 nm, corresponding to the oxygen atom. Moreover, peaks were observed at 319 and 407 nm, corresponding to OH radical and OH+, respectively. Furthermore, the EPR/DMPO experiments were carried out to confirm the identity of the involved reactive intermediates. As shown in Figure 3b, no peaks were identified before DBD digestion. After DBD digestion, four typical peaks in the spectra with intensity ratio of 1:2:2:1 could be assigned to DMPO− OH adducts (with aN = aH = 14.9 G), confirming the existence of ·OH in mixtures.
·OH is the most important and active oxidizing species among these active species. The oxidation potential of ·OH is 1.80 V, higher than O (2.42 V), O3(2.07 V), H2O2(1.77 V),
Analytical Chemistry Technical Note
DOI:10.1021/acs.analchem.7b04376
Anal. Chem. 2018, 90, 1547−1553
and O2(1.23 V). Attributed to ·OH, the organics are converted into easily degradable small molecular substances, carbon dioxide and water, by reactions of direct ringing, breakage, addition, substitution, or electron transfer.26In addition to the direct effect of refractory macromolecular organic matter, ·OH can react with H, ·OH, H2O2, or OH−in the solution to further form strong oxidizing groups and promote the digestion.
O3 in the ultraviolet light can be decomposed to produce secondary oxidants such as ·OH to oxidize organic com-pounds.27−29In the acidic solution, ozone, which has a high
oxidation potential (2.07 V), can carry out an electrophilic attack of organic compounds. In the acidic medium (H+), the presence of hydrogen ions could accelerate decomposition of ozone and promote digestion of samples, which makes digestion efficiency higher.
→ +
O3 O O2
+ → ·
O H O2 2HO
In the hydrogen peroxide system, peroxone reaction could occur between ozone and hydrogen to generate ·OH.30,31
+ → + ·
2O3 H O2 2 3O2 2 OH
Hydroxyl radicals, superoxide radical, and ozone could react with organics rapidly. Also, the synergistic effect of ozone, UV, and hydrogen peroxide could accelerate the production of · OH32and promote the digestion. As a result, the DBD-H2O2-digestion method provides better DBD-H2O2-digestion efficiency than that of the DBD-H2O-digestion method.
Analytical Performance.Under the optimized conditions, three DBD-digestion methods can be applied for the suitable digestion of real matrix sample. Since reagent impurities could contribute to process blanks, the intensities of digestion blanks of the three DBD-digestion systems were measured by ICPMS. As shown in Figure S5, intensities of digestion blanks of the H2O-DBD-digestion method were the lowest than those of the other two digestion methods. Compared with intensities of
blanks of microwave digestion, the intensities of the three DBD-digestion methods were all lower, making the sensitive and accurate determination of elements by the three DBD-digestion methods possible. The analytical performance of the three DBD-digestion methods was all evaluated under the optimum conditions. Linear coefficients (R2) of external calibration curves were better than 0.99. The precisions [relative standard deviations (RSDs), n = 9] were both better than 7% for analysis of the 0.0240 g of rice power sample spiked with or without 25.00 ng g−1Cr, 25.00 ng g−1Cd, 30.00 ng g−1As, and 30.00 ng g−1 Co, respectively. Table 1 shows
limits of detection (LODs) of seven elements in samples obtained by three DBD-digestion systems and detected by ICPMS. The obtained low LODs of the three DBD-digestion systems are evident, making them suitable for the determi-nation of these analytes in rice samples. It is worth noting that, although the digestion time obtained by the H2 O-DBD-digestion system is longer than those achieved by H2O2 -DBD-digestion and HNO3-DBD-digestion systems, it provides the lowest LODs due to its low blanks and most stable baselines. A comparison of the performance of the proposed method with other digestion methods is summarized inTable S3. The aim of digestion without any chemicals except H2O was achieved by extending the DBD-H2O-digestion method to 6 h.
Sample Analysis. The accuracy of the three proposed methods was evaluated by analyzing a certified reference material (GBW10043) of rice. For the H2O-DBD-digestion method and the H2O2-DBD-digestion method, Mg, Mn, and Zn in the CRM could be detected, while for the HNO3 -DBD-digestion method, only data of Mg and Zn could be obtained.
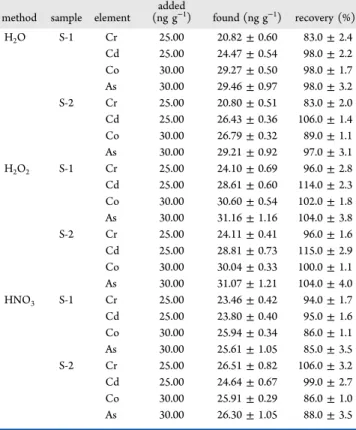
Table 2shows that the determined values of GBW10043 are in good agreement with the certified values, confirming the accuracy of the three proposed methods. The utility of the proposed digestion techniques was further demonstrated by the determination of Cr, Cd, Co, and As in two real rice samples from a supermarket. It was necessary to spike these samples with 25.00 ng g−1Cr, 25.00 ng g−1Cd, 30.00 ng g−1Co, and
Figure 3. (a) Optical emission spectrum for H2O-DBD-digestion, H2O2-DBD-digestion, and HNO3-DBD-digestion systems, respec-tively. (b) EPR spectra of DMPO−OH adduct.
Table 1. LODs of These Digestion Methods Detected by ICPMSa method Mg Mn Zn Cr Co As Cd H2O 0.01 0.005 0.01 0.005 0.004 0.006 0.002 H2O2 0.12 0.03 0.35 0.03 0.01 0.02 0.03 HNO3 0.16 0.02 0.13 0.02 0.01 0.01 0.01 ang g−1.
Table 2. Analytical Results of a Certified Reference Material (GBW10043)
method element founda(μg g−1) certified (μg g−1) recovery (%)
H2O Mg 387 ± 27 420 ± 20 92.0 ± 6.2 Mn 11.6 ± 0.7 10.6 ± 0.6 110.0 ± 6.3 Zn 14.7 ± 0.7 13.0 ± 0.6 113.0 ± 5.5 H2O2 Mg 462 ± 19 420 ± 20 110.0 ± 4.4 Mn 8.8 ± 0.3 10.6 ± 0.6 83.0 ± 2.5 Zn 14.1 ± 0.7 13.0 ± 0.6 109.0 ± 5.6 HNO3 Mg 475 ± 25 420 ± 20 113.0 ± 6.0 Mn 9.8 ± 0.5 10.6 ± 0.6 92.0 ± 4.5 Zn 13.0 ± 0.6
30.00 ng g−1As because their endogenous concentrations were below the detection limits of ICPMS. As shown in Table 3, good recoveries (83−115%) were obtained.
■
CONCLUSIONIt is demonstrated, for the first time, that microplasma generated by DBD discharge at atmospheric pressure can be used for suitable digestion of rice samples. All operation parameters of discharge and conditions of digestion were optimized. As a result, three different DBD-digestion methods including the H2O-DBD-digestion method, the H2O2 -DBD-digestion method, and the HNO3-DBD--DBD-digestion method were established. Any DBD-digestion method of the three could obtain efficient digestion under their optimized conditions. The H2O-DBD-digestion method has the advantage of not using any chemicals, which realizes one-step, environmental friendly, and interferences free sample digestion. Compared to conven-tional sample digestion methods, the proposed method retains advantages for sample analysis by requiring extremely low reagent blank and may accomplish sample digestion for field analysis because of low power and no chemical consumption.
■
ASSOCIATED CONTENT*
S Supporting InformationThe Supporting Information is available free of charge on the
ACS Publications website at DOI: 10.1021/acs.anal-chem.7b04376.
Power, voltage, and frequency of AC voltage; diagram of digestion and analytical procedure; instrumental param-eters of ICPMS and in EPR experiments; effects of operation conditions on the sample digestion; effects of COD detection; ion chromatograms for solutions of the HNO3-DBD-digestion method; comparison of intensities
of elements of digestion blanks of the methods; comparison of performance with other similar digestion methods (PDF)
■
AUTHOR INFORMATIONCorresponding Author
*E-mail: [email protected]. Fax/Phone: +86 28 8541 0528.
ORCID
Lu Yang:0000-0002-6896-8603
Chengbin Zheng:0000-0002-7496-8335
Author Contributions
The manuscript was written through contributions of all authors. All authors have given approval to the final version of the manuscript.
Notes
The authors declare no competing financial interest.
■
ACKNOWLEDGMENTSThe authors gratefully acknowledge the National Nature Science Foundation of China (Nos. 21529501, 21622508, and 21575092) for financial support.
■
REFERENCES(1) Capelo-Martínez, J. L.; Ximénez-Embún, P.; Madrid, Y.; Cámara, C. TrAC, Trends Anal. Chem. 2004, 23, 331−340.
(2) Chen, L. G.; Song, D. Q.; Tian, Y.; Ding, L.; Yu, A. M.; Zhang, H. Q. TrAC, Trends Anal. Chem. 2008, 27, 151−159.
(3) Keith, L. H.; Gron, L. U.; Young, J. L. Chem. Rev. 2007, 107, 2695−2708.
(4) Grindlay, G.; Mora, J.; de Loos-Vollebregt, M.; Vanhaecke, F.
Spectrochim. Acta, Part B 2013, 86, 42−49.
(5) Todolí, J. L.; Gras, L.; Hernandis, V.; Mora, J. J. Anal. At.
Spectrom. 2002, 17, 142−169.
(6) Picoloto, R. S.; Wiltsche, H.; Knapp, G.; Mello, P. A.; Barin, J. S.; Flores, E. M. M. Spectrochim. Acta, Part B 2013, 86, 123−130.
(7) Pereira, L. S.; Pedrotti, M. F.; Enders, M. S.; Albers, C. N.; Pereira, J. S.; Flores, E. M. M. Anal. Chem. 2017, 89, 980−987.
(8) Ai, X.; Wu, L.; Zhang, M. N.; Hou, X. D.; Yang, L.; Zheng, C. B. J.
Agric. Food Chem. 2014, 62, 8586−8593.
(9) Hartwig, C. A.; Pereira, R. M.; Rondan, F. S.; Cruz, S. M.; Duarte, F. A.; Flores, E. M. M.; Mesko, M. F. J. Anal. At. Spectrom. 2016, 31, 523−530.
(10) Jia, Y.; Yu, H. M.; Wu, L.; Hou, X. D.; Yang, L.; Zheng, C. B.
Anal. Chem. 2015, 87, 5866−5871.
(11) Pereira, J. S. F.; Picoloto, R. S.; Pereira, L. S. F.; Guimaraes, R. C. L.; Guarnieri, R. A.; Flores, E. M. M. Anal. Chem. 2013, 85, 11034− 11040.
(12) Yu, H. M.; Ai, X.; Xu, K. L.; Zheng, C. B.; Hou, X. D. Analyst 2016, 141, 1512−1518.
(13) Feng, F. D.; Zheng, Y. Y.; Shen, X. J.; Zheng, Q. Z.; Dai, S. L.; Zhang, X. M.; Huang, Y. F.; Liu, Z.; Yan, K. P. Environ. Sci. Technol. 2015, 49, 6831−6837.
(14) Nie, Y.; Zheng, Q. F.; Liang, X. J.; Gu, D. Y.; Lu, M. Z.; Min, M.; Ji, J. B. Environ. Sci. Technol. 2013, 47, 7934−7939.
(15) Subrahmanyam, C.; Renken, A.; Kiwi-Minsker, L. Chem. Eng. J. 2007, 134, 78−83.
(16) Zhang, H. B.; Li, K.; Sun, T. H.; Jia, J. P.; Lou, Z. Y.; Feng, L. L.
Chem. Eng. J. 2014, 241, 92−102.
(17) Tichonovas, M.; Krugly, E.; Racys, V.; Hippler, R.; Kauneliene, V.; Stasiulaitiene, I.; Martuzevicius, D. Chem. Eng. J. 2013, 229, 9−19. (18) Obradović, B. M.; Sretenović, G. B.; Kuraica, M. M. J. Hazard.
Mater. 2011, 185, 1280−1286.
(19) Zhu, C. Z.; Wang, X. H.; Huang, Q.; Huang, L.; Xie, J. J.; Qing, C. S.; Chen, T. H. Chem. Eng. J. 2013, 225, 567−573.
Table 3. Analytical Results of Spiked Elements
method sample element (ng gadded−1) found (ng g−1) recovery (%)
H2O S-1 Cr 25.00 20.82 ± 0.60 83.0 ± 2.4 Cd 25.00 24.47 ± 0.54 98.0 ± 2.2 Co 30.00 29.27 ± 0.50 98.0 ± 1.7 As 30.00 29.46 ± 0.97 98.0 ± 3.2 S-2 Cr 25.00 20.80 ± 0.51 83.0 ± 2.0 Cd 25.00 26.43 ± 0.36 106.0 ± 1.4 Co 30.00 26.79 ± 0.32 89.0 ± 1.1 As 30.00 29.21 ± 0.92 97.0 ± 3.1 H2O2 S-1 Cr 25.00 24.10 ± 0.69 96.0 ± 2.8 Cd 25.00 28.61 ± 0.60 114.0 ± 2.3 Co 30.00 30.60 ± 0.54 102.0 ± 1.8 As 30.00 31.16 ± 1.16 104.0 ± 3.8 S-2 Cr 25.00 24.11 ± 0.41 96.0 ± 1.6 Cd 25.00 28.81 ± 0.73 115.0 ± 2.9 Co 30.00 30.04 ± 0.33 100.0 ± 1.1 As 30.00 31.07 ± 1.21 104.0 ± 4.0 HNO3 S-1 Cr 25.00 23.46 ± 0.42 94.0 ± 1.7 Cd 25.00 23.80 ± 0.40 95.0 ± 1.6 Co 30.00 25.94 ± 0.34 86.0 ± 1.1 As 30.00 25.61 ± 1.05 85.0 ± 3.5 S-2 Cr 25.00 26.51 ± 0.82 106.0 ± 3.2 Cd 25.00 24.64 ± 0.67 99.0 ± 2.7 Co 30.00 25.91 ± 0.29 86.0 ± 1.0 As 30.00 26.30 ± 1.05 88.0 ± 3.5
Analytical Chemistry Technical Note
DOI:10.1021/acs.analchem.7b04376
Anal. Chem. 2018, 90, 1547−1553
(20) Iop, G. D.; Krzyzaniak, S. R.; Silva, J. S.; Flores, E. M. M.; Costa, A. B.; Mello, P. A. J. Anal. At. Spectrom. 2017, 32, 1789−1797.
(21) Chen, S. F.; Cao, G. Y. Chemosphere 2005, 60, 1308−1315. (22) Zhang, C. H.; Namihira, T.; Kiyan, T.; Nakashima, K.; Katsuki, S.; Akiyama, H.; Ito, H.; Imaizumi, Y. IEEE 2005, 1377−1380.
(23) Katsuki, S.; Tanaka, K.; Fudamoto, T.; Namihira, T.; Akiyama, H.; Bluhm, H. Jpn. J. Appl. Phys. 2006, 45, 239−242.
(24) Li, R.; Liu, Y. N.; Cheng, W. Y.; Zhang, W. J.; Xue, G.; Ognier, S. Chem. Eng. J. 2016, 296, 132−140.
(25) Tu, X.; Yu, L.; Yan, J. H.; Cen, K. F.; Chéron, B. G. Phys.
Plasmas 2009, 16, 113506.
(26) Rauf, M. A.; Ashraf, S. S. J. Hazard. Mater. 2009, 166, 6−16. (27) Benitez, F. J.; Acero, J. L.; Real, F. J. J. Hazard. Mater. 2002, 89, 51−65.
(28) Chu, W.; Ching, M. H. Water Res. 2003, 37, 39−46. (29) Summerfelt, S. T. Aquacult. Eng. 2003, 28, 21−36.
(30) Lukes, P.; Locke, B. R. J. Phys. D: Appl. Phys. 2005, 38, 4074− 4081.
(31) Malik, M. A.; Ghaffar, A.; Malik, S. A. Plasma Sources Sci.
Technol. 2001, 10, 82−91.
(32) Andreozzi, R.; Caprio, V.; Marotta, R.; Vogna, D. Water Res. 2003, 37, 993−1004.