HAL Id: inserm-01629338
https://www.hal.inserm.fr/inserm-01629338
Submitted on 6 Nov 2017
HAL is a multi-disciplinary open access
archive for the deposit and dissemination of
sci-entific research documents, whether they are
pub-lished or not. The documents may come from
teaching and research institutions in France or
abroad, or from public or private research centers.
L’archive ouverte pluridisciplinaire HAL, est
destinée au dépôt et à la diffusion de documents
scientifiques de niveau recherche, publiés ou non,
émanant des établissements d’enseignement et de
recherche français ou étrangers, des laboratoires
publics ou privés.
organisation and transcriptional gene silencing in plants
Axel Poulet, Ceíine Duc, Maxime Voisin, Sophie Desset, Sylvie Tutois,
Emmanuel Vanrobays, Matthias Benoit, David Evans, Aline Probst,
Christophe Tatout
To cite this version:
Axel Poulet, Ceíine Duc, Maxime Voisin, Sophie Desset, Sylvie Tutois, et al.. The LINC complex
contributes to heterochromatin organisation and transcriptional gene silencing in plants. Journal
of Cell Science, Company of Biologists, 2017, 130 (3), pp.590-601. �10.1242/jcs.194712�.
�inserm-01629338�
RESEARCH ARTICLE
The LINC complex contributes to heterochromatin organisation
and transcriptional gene silencing in plants
Axel Poulet1,2,*, Céline Duc1,*, Maxime Voisin1, Sophie Desset1, Sylvie Tutois1, Emmanuel Vanrobays1, Matthias Benoit3, David E. Evans2, Aline V. Probst1and Christophe Tatout1,‡
ABSTRACT
The linker of nucleoskeleton and cytoskeleton (LINC) complex is an evolutionarily well-conserved protein bridge connecting the cytoplasmic and nuclear compartments across the nuclear membrane. While recent data support its function in nuclear morphology and meiosis, its involvement in chromatin organisation has not been studied in plants. Here, 3D imaging methods have been used to investigate nuclear morphology and chromatin organisation in interphase nuclei of the model plant Arabidopsis thaliana in which heterochromatin clusters in conspicuous chromatin domains called chromocentres. Chromocentres form a repressive chromatin environment contributing to transcriptional silencing of repeated sequences, a general mechanism needed for genome stability. Quantitative measurements of the 3D position of chromocentres indicate their close proximity to the nuclear periphery but that their position varies with nuclear volume and can be altered in specific mutants affecting the LINC complex. Finally, we propose that the plant LINC complex contributes to proper heterochromatin organisation and positioning at the nuclear periphery, since its alteration is associated with the release of transcriptional silencing as well as decompaction of heterochromatic sequences.
KEY WORDS: Nuclear organisation, 3D imaging, Lamina, LINC complex, Heterochromatin, Chromocentre
INTRODUCTION
In eukaryotic cells, the nuclear envelope (NE), consisting of a double membrane interrupted by nuclear pores, delimits the nuclear compartment from the cytoplasm. The NE has many functions beyond the one of a simple barrier (Graumann and Evans, 2013; Méjat and Misteli, 2010). It regulates exchanges between the nucleus and the cytoplasm via the nuclear pore complex (Adams and Wente, 2013; Tamura et al., 2010), organises telomeres, connects the centromere to the centrosome during cell division, and bridges nucleus and cytoskeleton via the linker of nucleoskeleton and cytoskeleton (LINC) complex (Crisp et al., 2006). During the past few years, the LINC complex has been shown to play a central role in many NE functions. The LINC complex senses stimuli from the outside of the cell and transmits information through the cytoskeleton
to the nucleus, contributes to nuclear migration required to correctly position the nucleus within the cell, and can interact with nucleoskeleton components such as lamins inside the nucleus. Lamins can form direct or indirect contacts with chromatin in many organisms (Mattout et al., 2015), and the nucleoskeleton and the NE are therefore expected to participate in the position of chromatin within the nucleus (Bickmore and van Steensel, 2013). The NE is an elastic structure and can expand or retract upon constraints from within or from outside the nucleus. Indeed, alterations in the nucleoskeleton or the cytoskeleton have been associated with modifications of nuclear shape and size. Lamin mutants, such as those observed in the premature ageing syndrome Hutchinson– Gilford progeria syndrome (HGPS) display ghost-like instead of spherical nuclear shapes (Shumaker et al., 2006). In the cytoskeleton, actin, microtubules and actomyosin have all been shown to participate in nuclear shape (Gerlitz and Bustin, 2011). Most plant cells do not display spherical nuclei but the functional significance of nuclear reshaping toward elongated or lobed nuclei remains a question of debate. Two main hypotheses have been proposed (Webster et al., 2009): first, that nuclear reshaping may modify the nuclear rigidity needed for nuclear movement. Second, that nuclear reshaping may induce chromatin reorganisation, which in turn modifies gene expression. In light of this second hypothesis, it could be envisaged that nuclear structures that determine nuclear shape would also impact on chromatin organisation and function. In addition to nuclear shape, nuclear size has been shown to be modulated independently of genome size through cellular factors in a range of organisms (Levy and Heald, 2010; Neumann and Nurse, 2007). These studies also highlighted that the ploidy and katyoplasmic ratio defined by the ratio between nuclear size and cell volume are independently regulated. Similar results have been reported in plants (Bourdon et al., 2012; Jovtchev et al., 2006; Sugimoto-Shirasu and Roberts, 2003).
Plants are amenable models to study nuclear organisation as natural variations in nuclear morphology occur in various tissues such as epidermis, trichomes and root hairs (Qian et al., 2009; Traas et al., 1998) or during seed formation and germination (van Zanten et al., 2011), as well as in mutants in which the NE or lamin-like components are altered (Dittmer et al., 2007; Goto et al., 2014; Janski et al., 2012; Tamura and Hara-Nishimura, 2011; Zhou et al., 2012). Plants encode a LINC complex consisting of SUN (Sad1 and Unc-84 homology) (Graumann and Evans, 2010; Graumann et al., 2014) and KASH (Klarsicht, Anc-1 and Syne homology) proteins including WPP domain-interacting proteins (WIPs), SUN-interacting nuclear envelope (SINEs) and TIK (Zhou et al., 2012, 2015a; Graumann et al., 2014). Furthermore, possible candidates for lamin-like and lamin-binding proteins have been identified and are known, respectively, as CROWDED NUCLEI (CRWN) (Dittmer et al., 2007; Wang et al., 2013) and KAKU4 (Goto et al., 2014). Strikingly, sun, wip, kaku4 and crwn mutants all display nuclear shape and/or nuclear size modifications suggesting
Received 4 July 2016; Accepted 4 December 2016
1Université Clermont Auvergne, CNRS, Inserm, GReD, F-63000 Clermont–Ferrand, France.2Sainsbury Laboratory Cambridge, University of Cambridge, Cambridge CB2 1LR, UK.3Department of Biological and Medical Sciences, Oxford Brookes University, Oxford OX3 0BP, UK.
*These authors contributed equally to this work ‡Author for correspondence (christophe.tatout@uca.fr)
C.D., 0000-0001-7426-4541; S.D., 4897-4977; E.V., 0000-0002-3209-6743; A.V.P., 0000-0001-9534-8058; C.T., 0000-0001-5215-2338
Journal
of
Cell
Science
that mechanical constraints such as those applied by the cytoskeleton at the NE may be released in mutant backgrounds (Dittmer et al., 2007; Goto et al., 2014; Oda and Fukuda, 2011; van Zanten et al., 2011; Zhou et al., 2012). Finally, the SUN–WIP– WIT2–myosin-XI-i complex and CRWN1 have been proposed to independently determine elongated nuclear shape, highlighting the function of cytoskeleton and nucleoskeleton in nuclear morphology (Zhou et al., 2015b). However, to date it is not known whether plants deficient in NE or lamina components would also show altered chromatin organisation or whether in turn, mutants that affect the organisation of chromatin would impact nuclear size and shape.
To address these questions, three cell types displaying contrasted nuclear organisation, namely guard cells, pavement cells and root hair cells, have been chosen to investigate both nuclear shape and chromatin organisation. For the latter, we took advantage of the fact that repressed chromatin domains called heterochromatin can easily be tracked in Arabidopsis interphase nuclei in which they form compact and dense chromatin domains called chromocentres (Fransz et al., 2002). Nuclei were classed according to their tissues of origin using 3D quantitative parameters, such as sphericity and elongation, and we show that in wild-type plants most of the chromocentres are located close to the nuclear periphery. Loss-of-function mutants for lamina, LINC complex components or chromatin remodellers and modifiers were then evaluated for their impact on nuclear morphology as well as heterochromatin organisation and function in these three specific cell types. For that purpose, we computed quantitative imaging parameters and 3D fluorescence in situ hybridisation (3D-FISH) as well as reverse transcription coupled to quantitative real-time PCR (qPCR) values. Plants deficient for components of the LINC complex, such as KASH (wifi) and SUN (sun1 sun4 sun5 triple mutant) show altered nuclear shape, increased distance of chromocentres from the nuclear periphery, altered heterochromatin organisation and reactivation of transcriptionally silent repetitive sequences. Taken together, this study reveals a crucial role for the LINC complex in heterochromatin positioning and function.
RESULTS
Different cell types show quantitative variations in nuclear organisation
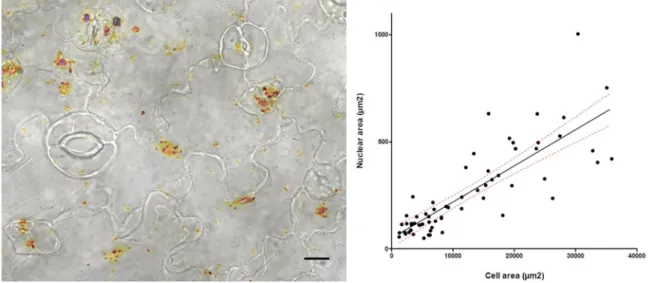
Plants are well known for their variation in genome size but also display a wide range of nuclear morphologies. For example, in the model species Arabidopsis thaliana hypocotyls and trichomes (Traas et al., 1998), root hairs (Sugimoto-Shirasu et al., 2005) and pollen tubes (Dittmer et al., 2007; Grob et al., 2014; Wang et al., 2013) have been used to illustrate variations in cell and nuclear morphogenesis. Here, we chose three different cell types displaying distinct nuclear features to characterise their nuclear shapes and chromatin organisation (Fig. 1A). First, we chose cotyledon epidermal cells, which consist mainly of guard cells (GCs), with round nuclei, and pavement cells (PCs), which are lobed and display elongated nuclei. While guard cells have mostly 2C content, the DNA content varies between 2C and 16C in pavement cells due to one or several rounds of endoreplication and their cell size expands roughly in proportion to the amount of DNA (Melaragno et al., 1993). Epidermis cells follow the karyoplasmic ratio theory, as cell size correlates with nuclear DNA content, which increases through endoreplication (Fig. S1). A third cell type investigated was the easily accessible root hair cell (RC), which displays elongated and endoreplicated nuclei (Ketelaar et al., 2002).
To assess nuclear size, shape and chromocentre organisation, nuclear DNA in whole-mount tissue was stained using the Hoechst 33258 intercalating agent (see Materials and Methods), and 3D images of an average number of 100 nuclei for cotyledon and 40 nuclei for root hair cells were acquired from 8–10 seedlings per genotype (Table S1). 3D images of nuclei were then processed to segment the nucleus as well as the chromocentres in 3D (Fig. 1B). In order to confirm that segmented objects within the nucleus are indeed chromocentres, we simultaneously performed Hoechst DNA staining and 3D fluorescence in situ hybridisation (3D-FISH) on whole-mount tissue. 180 bp satellite repeats and 45S rDNA repeats, which are the main repetitive sequences enriched in chromosome regions forming chromocentres, were used as probes. Most of the intranuclear objects segmented by using the ImageJ plugin NucleusJ overlap, with 180 bp and 45S signals indicating that these are indeed chromocentres (Fig. 1C); however, in certain nuclei
Fig. 1. 3D segmentation of nuclei and chromocentres using the NucleusJ
plug-in. (A) Maximum Z-projections of guard cells
(GCs), pavement cells (PCs) and root hair cell (RCs) nuclei stained with the Hoechst DNA intercalating agent. Chromocentres correspond to bright nuclear foci. (B) Same nuclei as in A subjected to NucleusJ 3D segmentation to delimit the nucleus and the chromocentres. Results of nucleus and chromocentre segmentation are shown as an overlay of the maximal Z-projection of nucleus (blue) and chromocentres ( pink). (C) 3D-FISH experiments. Images of maximal
Z-projections of a PC nucleus stained with Hoechst and processed by NucleusJ to obtain the segmented nucleus (blue) and
chromocentres (Cc, pink) as well as the 45SrDNA (red) and centromeric 180 bp satellite repeats (green) signals. Scale bar: 2 µm.
Journal
of
Cell
some of the chromocentres identified by in situ hybridization are not detected by DNA staining. This results in an underestimation of the chromocentre number using our method.
Using a dataset of 1770 wild-type (WT) nuclei obtained from five biological replicates (Table S1), we computed quantitative parameters obtained by NucleusJ to characterise nuclear morphology and heterochromatin organisation (Table S2). The computed parameters explain up to 60% of the phenotypic variation across the two main axes of a principal component analysis (PCA) (Fig. 2A,B), and the nuclei belonging to the three different cell types form three different clouds although PC and RC values overlap. PCs display the greatest variability, and RC nuclei an intermediate variability whereas GC nuclei are easily grouped together (Fig. 2A).
GCs exhibit nuclei of small volume (21.8±0.4 µm3; mean±s.e.m.),
which are rounder, as indicated by reduced elongation, and smoother according to their higher sphericity, which takes into account the volume and area of the segmented nucleus (Fig. 2C; Table S2). By contrast, in PCs and RCs, the mean nuclear volumes are larger (respectively, 115.2±3.4 and 123.3±3.9 µm3) and nuclei are more
elongated. The PCA analysis revealed that elongation and sphericity display a strong negative correlation (r2=0.75, P<0.0001, Fig. 2D)
and are among the best parameters to discriminate the three nuclear types. In contrast, flatness, another morphological parameter, only poorly discriminates the three populations of nuclei (Table S2).
Whole-mount tissue preparations stained with Hoechst also gave the opportunity to correlate the nuclear shape parameters
Fig. 2. Phenotypic variability of GC, PC and RC nuclei in WT plants can be explained by several 3D nuclear parameters. Principal component analysis of (A) individual nuclei from GCs (n=697, black), PCs (n=590, green) and RCs (n=213, red) and (B) quantitative parameters generated by NucleusJ are depicted along the two main axes. Volume, nuclear volume; VCcTotal, the total volume of all chromocentres; NbCc, the number of chromocentres. (C) Selected NucleusJ
parameters highlight the phenotypic variations among the three types of nuclei. The box represents the 25–75th percentiles, and the median is indicated. The
whiskers are equal to 1.5× the interquartile range. Outliers are represented by dots. The complete analysis is given in Table S2. (D) Scatter plot matrix and
absolute correlation between pairs of variables. The two major correlations between elongation and sphericity (r2=0.75) and NbCc and VCcTotal (r2=0.63) are
highlighted in yellow and orange, respectively. *P≤0.01, **P≤0.001, ***P≤0.0001 (t- and F-tests, respectively, for C and D).
Journal
of
Cell
with chromocentre organisation. GC nuclei contain fewer chromocentres and a lower total chromocentre volume per nucleus than larger nuclei such as those of PCs and RCs (Fig. 2C). We then determined a modified relative heterochromatin fraction (RHF, Tessadori et al., 2007a,b), called the relative heterochromatin volume (RHV) as voxel volumes of chromocentres relative to the voxel volume of the nucleus. As we observed a lower chromocentre number and volume in GCs (Fig. 2C) and a positive correlation between the amount of heterochromatin and nuclear volume in PCs (Fig. S2), we expected a constant RHV between the three cell types. However, the RHV was about twofold higher in GCs compared to that observed in PCs and RCs due to the small nuclear volume of the guard cells (Fig. 2C; Table S2). Finally, a strong positive correlation was observed between the number of chromocentres and the total amount of heterochromatin (r2=0.63, P<0.0001) indicating that
either parameter can be used to discriminate between the three cell types (Fig. 2D).
Taken together, the phenotypic variability among the three nuclear types is best explained by two nuclear shape parameters, namely elongation and sphericity and the number of chromocentres. Chromocentres are preferentially positioned at the nuclear periphery
Radial position, a widely used 2D parameter to characterise object position, was used to describe centromere position in living cells of various Arabidopsis tissues expressing the centromeric histone variant CenH3 and histone H2B fused to fluorescent proteins (Fang and Spector, 2005). These experiments confirmed the position of chromocentres next to the nuclear periphery and the nucleolus. Furthermore, modelling also predicted that chromocentres would tend to be located at the nuclear periphery (de Nooijer et al., 2009). Here, we took advantage of Hoechst-stained nuclei to investigate whether chromocentres preferentially localise to the nuclear periphery in the three different cell types with different nuclear shapes. To this aim, we quantified the position of each chromocentre of a given nucleus relative to the boundary of the DNA staining assuming that the intercalating agent stains the whole nuclear DNA. Three parameters were computed: (1) d(Cc border), which is the distance between the two closest voxels from the chromocentre rim and the limit of the DNA staining, (2) d(Cc barycentre), the distance from the barycentre of each chromocentre and (3) d(Nuc barycentre), the barycentre of the nucleus corresponding to the mass centre of the nucleus (Fig. 3A). The latter was used as a parameter to generate a theoretical uniform distribution of chromocentres for each nucleus of GCs, PCs and RCs (Fig. 3B, top). When comparing to the uniform distribution of chromocentre positions, we observed that the chromocentre distances from the nuclear periphery differ from this theoretical distribution. Chromocentres are situated close to the nuclear periphery (Fig. 3B; Table S2) with mean d(Cc border) and d(Cc barycentre) parameters in GC, PC and RC of, respectively, 0.20± 0.06, 0.30±0.11 and 0.27±0.09 µm and 0.54±0.09, 0.72±0.16, 0.68±0.11 µm (mean±s.e.m.; Fig. 3C; Table S2). The minimal distance between the chromocentres and the limit of the DNA stain (see empty rim observed in the experimental datasets, Fig. 3B middle and bottom) is∼0.100 µm, which is also the resolution limit of our optical system. We therefore cannot rule out that this distance is not a biological reality, but the limit of our experimental system. Finally, the two distance parameters d(Cc border) and d(Cc barycentre) are strongly correlated in the three cell types with an overall r2of 0.85 (P<0.0001), suggesting that the three cell types
share chromocentres with similar features.
Taken together, the results show that chromocentres are not randomly distributed but instead preferentially localise at a small distance from the nuclear periphery and that the distance between chromocentres and the nuclear periphery is larger in PC and RC nuclei, which show larger volumes and are less spherical. Alterations of nuclear shape parameters in LINC complex and lamina-like mutants
As chromocentres are situated close to the nuclear periphery, we hypothesised that alterations of components of the LINC and lamina-like complexes might perturb position, compaction or even formation of chromocentres. Previous studies have highlighted that chromatin organisation is different in distinct genetic backgrounds (Tessadori et al., 2009) and cellular contexts (Tessadori et al., 2007a), and that it depends on environmental conditions such as light (Bourbousse et al., 2015; Tessadori et al., 2007b) or growth medium (Vaillant et al., 2008). For these reasons, standardised experimental procedures were applied to reduce phenotypic variability within and across repetitions of a given genotype, and mutant datasets were normalised with WT plants grown within the same experiments (see Materials and Methods).
In order to evaluate the impact of mutants affecting either the LINC complex or the nuclear lamina on chromatin organisation, these mutants were compared to ddm1 and atxr chromatin mutants (Table 1). Loss of the chromatin remodelling factor DDM1 leads to reduced DNA methylation, altered repressive histone marks at heterochromatic regions and decondensed chromocentres (Probst et al., 2003; Soppe et al., 2000; Vongs et al., 1993). ATXR5 and ATXR6 are histone H3K27 mono-methyltransferases and the atxr5 atxr6 double mutant displays decondensed chromocentres (Jacob et al., 2009). CRWNs are postulated to be components of the plant lamina-like structure and the crwn1 crwn2 double mutant has previously been described to induce small nuclei (Dittmer et al., 2007) and a more condensed chromatin organisation (Grob et al., 2014; van Zanten et al., 2011; Wang et al., 2013). The quintuple wifi mutant (Zhou and Meier, 2014), lacking three KASH proteins WIP1–WIP3 and the two WPP domain-interacting tail-anchored proteins WIT1 and WIT2, was selected to affect the KASH components of the LINC complex as well as some of its interactors located at the outer nuclear membrane. Finally, we combined available sun knockout mutant alleles in the Col-0 background [sun1-1 (Graumann et al., 2010), sun4-1 and sun5-1 (Graumann et al., 2014)] to obtain double and triple mutants (Fig. S3A). The different mutant combinations of one Cter-SUN1 and two mid-SUN (SUN4 and SUN5) proteins, which include a SUN domain, respectively, at the C-terminal region or in the middle of the protein (Graumann et al., 2014). yield viable plants sun1 sun4 sun5 triple mutants showing increased leaf area compared to the WT (Fig. S3C) as well as reduced and disorganised root hair growth (Fig. S3D). Furthermore, the triple mutant most strongly affects nuclear sphericity and elongation compared to sun1 sun4 or sun4 sun5 double mutants (Fig. S3B) and was therefore selected for further analysis.
We first analysed whether the 13 genes altered in our mutants (Table 1) are differentially expressed in roots and cotyledon. For that purpose, a survey of available RNA-Seq data was performed and eight Col-0 datasets including whole seedling roots, whole cotyledon epidermis and guard cells obtained from FACS-sorted protoplasts were selected. All genes are expressed in the different tissues although at different levels (Fig. S4). The data do not show a strong bias between cell types, except for SUN4 and CRWN1, which are strongly expressed, respectively, in epidermis and guard cells. As expected from previous work (Baubec et al., 2014), DDM1, ATXR5 and ATXR6 show weak expression in cotyledon tissue.
Journal
of
Cell
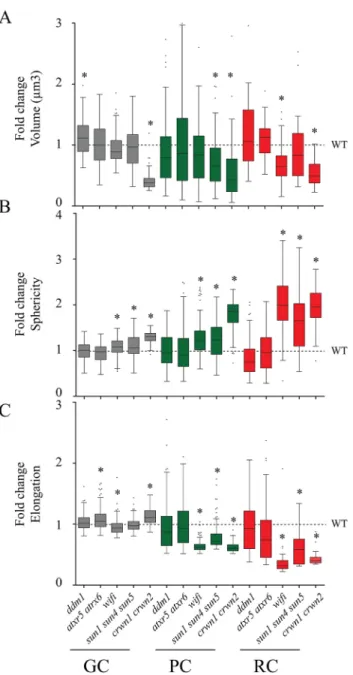
The different mutants were then evaluated for their impact on nuclear morphology. The three mutants deficient in nuclear periphery components (wifi, sun1 sun4 sun5 and crwn1 crwn2) display similar profiles (Fig. 4; Table S3). All three mutants show reduced nuclear volume, increased sphericity and decreased
elongation compared to WT (P<0.001) the strongest effects being observed for crwn1 crwn2. Despite the different nuclear organisation parameters observed for the three cell types in WT plants (Fig. 2), nuclear size and form parameters are altered for all cell types in the mutants. The most prominent effects were observed
Fig. 3. Chromocentres are located close to the nuclear periphery. (A) NucleusJ was used to compute the distance between the limit of the Hoechst DNA staining (blue) and the chromocentres (Cc, pink), boundary [d(Cc border)] or barycentre [d(Cc barycentre)]. The barycentre of the nucleus d(Nuc barycentre) (white cross) is also indicated. (B) Graphical representation of chromocentre distribution in respect to the limit of Hoechst DNA staining among the three cell types. The theoretical uniform distribution of chromocentres (top) is compared to observed distributions for d(Cc border) (middle) and d(Cc barycentre) (bottom). The uniform distribution of chromocentres is obtained by placing the same number of chromocentres as in the corresponding datasets between the periphery and the corresponding nuclear barycentres, for each nucleus of the dataset. Chromocenters and nuclei numbers are given at the bottom of the figure. The scales
of the graphs were standardized by setting the maximum d(Nuc barycentre) value at 2.5 µm to include all the data in the graphical representations. A Student’s
t-test has been used to demonstrate the non-random distribution of chromocentres in the six observed datasets (P<2.2 10−16). (C) Boxplots as in Fig. 2 of d(Cc
border) and d(Cc barycentres) in the three observed datasets. **P≤0.001; ***P≤0.0001; ns, not significant (t-test).
Journal
of
Cell
in the RCs, which are the most elongated cells in the WT, but can be seen, at the least for the sphericity parameter, also in GCs. The two mutants with defects in chromatin organisation display a higher variability of nuclear shape parameters as demonstrated by the larger size of the whiskers in the plots, especially for elongation in RCs, but the mean volume, sphericity or elongation were not significantly different from WT (Table S3).
Taken together, affecting either of the two LINC components (SUN or KASH proteins) or a component of the nuclear lamina, causes altered nuclear shapes in three different cell types with the strongest effects for the cell type with the most elongated nuclei. In contrast, mutants known to affect chromatin organisation, do not significantly impact nuclear organisation.
Alterations of chromocentre compaction and alleviation of silencing in mutants
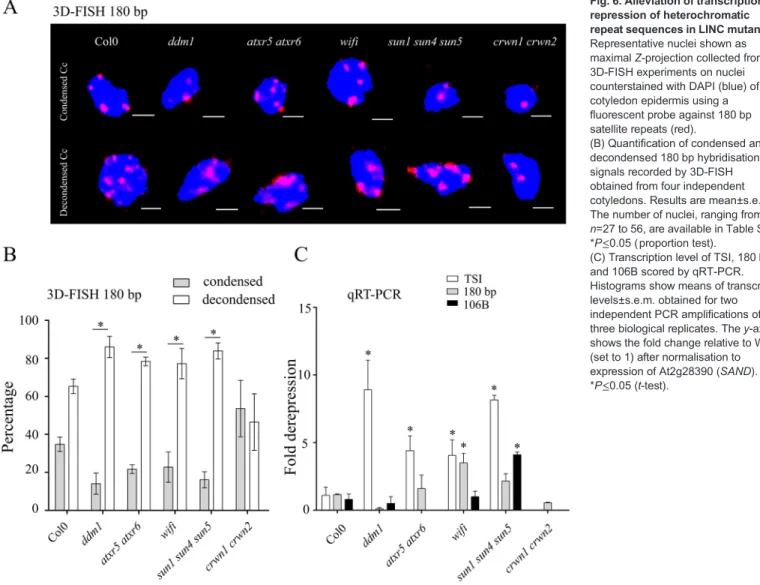
Differences in heterochromatic parameters were less pronounced between WT and mutants (Fig. 5; Table S3) except for crwn1 crwn2, which displays a significant reduction in the number of chromocentres in GCs and RCs as well as an increased RHV in all cell types (Fig. 5A, P<0.0001) as previously described (Dittmer et al., 2007; Grob et al., 2014; Wang et al., 2013). In ddm1 and atxr5 atxr6 mutants the RHV is reduced in GCs and RCs, but the difference is significant only in GCs (Fig. 5B). When we scored the distance between the border of chromocentres and the nuclear periphery, we find that this distance is increased in all three types of nuclei in the sun1 sun4 sun5 triple mutants (statistically significant in GCs and PCs, P<0.0001) (Fig. 5C; Table S3). Despite KASH and SUN domain proteins being part of the LINC complex (Graumann et al., 2014; Zhou and Meier, 2014), we did not detect any significant change in wifi mutants. This might be due to the potential redundancy with other Arabidopsis KASH domain proteins (Poulet et al., 2016) or alternatively due to a specific function of SUN domain proteins in chromatin organisation. To correlate the differences observed by NucleusJ for heterochromatic parameters with the organisation of the centromeric satellite repeats, we performed 3D-FISH in whole-mount preparations of cotyledons using short locked nucleic acid (LNA)-DNA oligonucleotide probes generated to specifically recognise the 180 bp centromeric repeats (Fig. 6A; Table S4). We imaged epidermis nuclei and classed each 3D nucleus into either the condensed type (Fig. 6A, top) or the decondensed type (Fig. 6A, bottom). We noticed that at this developmental stage that a significant fraction of the WT nuclei in the cotyledon epidermis are of the decondensed type (65±4%, mean±
s.e.m.; Fig. 6B) with an equal distribution between GCs and PCs and that this fraction was higher in ddm1 and atxr5 atxr6 mutants. In the crwn1 crwn2 double mutants that show a reduced number of chromocentres and increased chromocentre volume, these chromocentres have tendency to be more condensed than in the WT. Interestingly, while we did not detect any changes in chromocentre position in wifi mutants (Fig. 5C), in both wifi and sun1 sun4 sun5 mutant combinations, in which the LINC complex is affected, chromocentres were further decondensed compared to the WT (Fig. 6A,B). This may suggest that loss of the LINC complex affects chromocentre position and chromatin compaction through different mechanisms.
As chromatin decompaction had been correlated in certain mutants with release of transcriptional gene silencing (TGS) at centromeric and pericentromeric repeats (Jacob et al., 2009; Probst et al., 2003; Yelagandula et al., 2014), TGS release was investigated in the different mutants. Using reverse transcription coupled to qPCR, we quantified transcript levels of the centromeric repeats 180 bp (Nagaki et al., 2003) and 106B (Thompson et al., 1996), and the pericentromeric repeats called transcriptional silent information (TSI) (Steimer et al., 2000) (Fig. 6C) as well as three housekeeping genes (Fig. S3). While for neither of the different mutant types, expression of the euchromatic genes was significantly altered (Fig. S3), we find as previously described (Jacob et al., 2009; Steimer et al., 2000) that TGS at TSI is alleviated in ddm1 and atxr5 atxr6 mutants. In agreement with the maintained chromocentre organisation in crwn1 crwn2 mutants, centromeric and pericentromeric repeats were effectively repressed in this mutant background. In contrast, TGS in wifi and sun1 sun4 sun5 was alleviated at both centromeric and pericentromeric repeats (Fig. 6C) in accordance with the increased number of nuclei with decondensed heterochromatin type.
Taken together, the organisation of centromeric repeats into chromocentres is differentially affected in mutants of the nuclear lamina or the LINC complex. Increased compaction of centromeric repeats in crwn1 crwn2 mutants correlates with maintenance of transcriptional silencing in this mutant background. In contrast, altering LINC complex function causes chromocentre decondensation and affects maintenance of transcriptional gene silencing of centromeric and pericentromeric repeats.
DISCUSSION
In this study, we have performed in a single set of experiments a phenotypic characterisation of WT and mutant plants affected Table 1. Mutants used in this study
Mutant names Alleles T-DNA Gene name Acc. number Family Mutant class
wifi wit1-1 GABI-Kat 470E06 WIT1 At5g11390 KASH-interacting Nuclear periphery
wit2-1 SALK_CS39986 WIT2 At1g68910
wip1-1 SAIL_390_A08 WIP1 At4g26455 KASH
wip2-1 SALK_052226 WIP2 At5g56210
wip3-1 GABI-Kat 459H07 WIP3 At3g13360
sun1 sun4 sun5 sun1-1 SAIL_84_G10 SUN1 At5g04990 SUN
sun4-1 SALK_022028 SUN4 At1g71360
sun5-1 SALK_126070C SUN5 At4g23950
crwn1 crwn2 crwn1-1 SALK_023383 CRWN1 At1g67230 Lamin-like
crwn2-1 SALK_090952 CRWN2 At1g13220
ddm1 ddm1-10 SALK_000590 DDM1 At5g66750 Chromatin remodeller Chromatin
atxr5 atxr6 atxr5-1 SALK_130607C ATXR5 At5g09790 Histone methyl transferase
atxr6-1 SAIL_240_H01 ATXR6 At5g24340
Mutant description can be found in Zhou and Meier (2014) for wifi, Dittmer et al. (2007) for crwn1 crwn2, and Jacob et al. (2009) for atxr5 atxr6. To keep working in Col-0 genetic background, the ddm1-10 T-DNA insertion was selected in this work (Jordan et al., 2007). The sun1 sun4 sun5 triple mutant has been generated for the first time in this study and is described in Fig. S1.
Journal
of
Cell
in nuclear or heterochromatin organisation. We analysed a comprehensive dataset of more than 3000 nuclei and scored ten 3D quantitative parameters relative to nuclear morphology and heterochromatin organisation for three distinct cell types (GCs, PCs and RCs) in WT and mutant backgrounds. In order to maximise the effect on nuclear morphology, we chose the quintuple wifi mutant (Zhou and Meier, 2014) and the triple sun1 sun4 sun5 mutant affecting the LINC complex as well as crwn1 crwn2 (Dittmer et al., 2007; Wang et al., 2013) affecting the potential plant lamina. Sphericity, elongation and the number of chromocentres display the best range of variations between the distinct cell types in the WT and between WT and mutants and therefore will provide promising phenotypic parameters to screen for new structural components of
the nuclear periphery involved in nuclear morphology during interphase in the future.
The Arabidopsis nucleus is an attractive model to study the 3D position of heterochromatic repeats as these repeats cluster into chromocentre structures that are microscopically traceable due to their intense staining seen with DNA-intercalating agents. A 2D parameter known as the radial distance is frequently used to compute position of chromatin domains or nuclear bodies within the nucleus (Croft et al., 1999). Radial distance defines concentric shells from the nucleus centre, and although this strategy applies well for round nuclei it is less suitable for nuclei adopting ellipsoid or elongated shapes, such as those illustrated in Fig. 1. Furthermore,
Fig. 4. Alteration of nuclear morphology in mutant nuclei from guard cells, pavement cells and root hair cells. Tukey boxplots as in Fig. 2 of nuclear morphology parameters highlighting the phenotypic variations in three types of nuclei (GCs in grey, PCs in green and RCs in red) for the five mutant backgrounds. All parameters recorded for mutant backgrounds were
standardised using WT mean set as 1 (black dashed line). *P≤0.001(t-test).
Number of analysed nuclei and a more detailed statistical analysis are available, respectively, in Tables S1 and S3.
Fig. 5. Alteration of chromatin organisation in mutant nuclei from guard cells, pavement cells and root hair cells. Tukey boxplots of chromatin organisation parameters highlighting the phenotypic variations in three types of nuclei (GC in grey, PC in green and RC in red) for five mutant backgrounds. All parameters recorded for mutant backgrounds were standardised using WT
mean set as 1 (black dashed line). *P≤0.001 (t-test). The number of analysed
nuclei and a more detailed statistical analysis are available, respectively, in Tables S1 and S3.
Journal
of
Cell
this approach requires the acquisition of 3D images, which then are projected in 2D to analyse the radial position. Here, we have opted to use spatial (3D) positioning to compute the distance and confirmed that chromocentres are located at the boundary of the Hoechst-stained nuclei in good agreement with pioneer studies using centromeric histone variant CenH3 in live-cell imaging (Fang and Spector, 2005). Compared to the diploid GCs, chromocentres are situated more internally in the endoreplicated PC and RC nuclei, which also show larger volumes and a reduced heterochromatic content. The latter is in agreement with the hypothesis that endoreplicated nuclei have a more decondensed heterochromatic organisation (Schubert et al., 2012). Surprisingly, almost all of the chromocentres are close to the periphery, including those usually linked to the nucleolus, which are easy to identify thanks to their larger size, suggesting that the nucleolus may also localise close to the nuclear periphery in interphase nuclei.
Given the peripheral localisation of chromocentres in the different cell types, we investigated the impact of components of the LINC complex as well as the nuclear lamina on the maintenance of a repressive state at heterochromatic loci. Indeed, a current view of nuclear organisation is that chromocentres, the nucleolus and components of the nuclear lamina are acting together to structure the chromatin in the nuclear volume (Liu and Weigel, 2015; Simon et al., 2015). The clustering of centromeric and pericentromeric
sequences into chromocentres could compartmentalise silent chromatin away from euchromatin and thereby contribute to transcriptional repression. Furthermore, euchromatic loops are anchored at the chromocentre (Fransz et al., 2002; Grob et al., 2014), suggesting an important role for chromocentres in structuring gene-rich euchromatin in nuclear space. Therefore, disorganisation of chromocentres might have a more extensive impact on gene expression. The characterisation of molecular components of the nuclear periphery or the inner nuclear membrane that interact with heterochromatin and chromocentres and help to anchor heterochromatin will therefore be important to better understand how the arrangement of a gene in nuclear space contributes to gene expression. While such components are yet to be discovered in plants, some are already described in metazoans. A well-known example is the lamin-B receptor (LBR), a major component of the lamina, which in turn interacts with heterochromatin protein 1 (HP1, also known as CBX5) as well as with the methyl CpG-binding protein MeCP2 (Guarda et al., 2009; Ye et al., 1997). HP1 and MeCP2, respectively, recognise the repressive H3K9me2 mark and CpG DNA methylation, which are key features of heterochromatin sequences enriched in pericentromeric regions. Furthermore, lamins were also described to be associated with genomic regions known as lamina-associated domains (LADs), which contain a high proportion of repeated sequences enriched in H3K27me3, a
Fig. 6. Alleviation of transcriptional repression of heterochromatic repeat sequences in LINC mutants. Representative nuclei shown as maximal Z-projection collected from 3D-FISH experiments on nuclei counterstained with DAPI (blue) of cotyledon epidermis using a fluorescent probe against 180 bp satellite repeats (red).
(B) Quantification of condensed and decondensed 180 bp hybridisation signals recorded by 3D-FISH obtained from four independent cotyledons. Results are mean±s.e.m. The number of nuclei, ranging from n=27 to 56, are available in Table S5.
*P≤0.05 (proportion test).
(C) Transcription level of TSI, 180 bp and 106B scored by qRT-PCR. Histograms show means of transcript levels±s.e.m. obtained for two independent PCR amplifications of three biological replicates. The y-axis shows the fold change relative to WT (set to 1) after normalisation to expression of At2g28390 (SAND).
*P≤0.05 (t-test).
Journal
of
Cell
signature of facultative heterochromatin (Guelen et al., 2008; Pickersgill et al., 2006). The double crwn1 crwn2 mutant does not decompact chromocentres nor release transcriptional silencing at heterochromatic sequences, suggesting either that the resulting imbalance of the different CRWN proteins with potentially complementary but also distinct functions results in different chromocentre structures or that different mechanisms might operate to anchor heterochromatin in plants. Indeed, neither does the plant homologue of HP1 (LHP1) localise to chromocentres nor have lamin-B receptor homologues yet been identified in plants. However, the absence of CRWN1 and CRWN2 induces chromocentre fusions. This recalls the phenotype of silent information regulator 4 (Sir4) overexpression in Saccharomyces cerevisiae, in which telomeric repeats are relocated from the periphery to a more central position where they cluster together. In that case, transcriptional repression increases in this new central repressive chromatin domain meaning that it can be efficiently established away from the nuclear periphery (Ruault et al., 2011).
While lamina structures are significantly divergent between metazoans and plants, the LINC complex, or at least the SUN domain proteins, are conserved throughout evolution (Graumann et al., 2014), suggesting that the LINC complex might play a more ancestral role in chromatin organisation. Our phenotypic analysis of the triple sun and wifi mutants revealed decompaction of chromocentres, which are located at a more internal position as well as a transcriptional derepression of heterochromatic repeats, while several euchromatic genes are expressed to similar levels as in WT (data not shown). This suggests that the LINC complex affects chromatin organisation and contributes to transcriptional repression of heterochromatic sequences. Evidence gained in S. cerevisiae indicated that Mps3 a C-terminal SUN homologue is involved in the recruitment of heterochromatic sequences such as telomeric repeats at the NE, an essential process needed for spindle formation in the course of chromosome segregation. This requires an indirect interaction between the N-terminal domain of Mps3 and Sir4 or non-disjunction protein 1 (Ndj1) (Bupp et al., 2007; Conrad et al., 2007). These reports highlighting the interaction between Mps3 and telomeric repeats have been recently extended to centromeres, which also contribute to spindle formation (Fennell et al., 2015). So far, a direct interaction between chromatin and SUN proteins has only been shown for Dictyostelium SUN-1 using chromatin immunoprecipitation and southwestern blot experiments demonstrating the capacity of the N-terminal domain of SUN-1 to bind chromatin (Xiong et al., 2008). However, the N-terminal region of Dictyostelium SUN-1 is only poorly conserved in other species including Arabidopsis (Graumann et al., 2010, 2014).
The importance of the 3D arrangement of chromatin within the nucleus and its impact on gene expression patterns is becoming an important field of investigation in animals (Tashiro and Lanctôt, 2015) and plants (Liu and Weigel, 2015). Plants perceive various stresses at the cell wall and plasma membrane, which induce reorganisation of the cytoskeleton and transmit chemical or mechanical signals to the NE where they trigger chromatin changes affecting gene expression (Landrein and Hamant, 2013). Therefore, elucidating the mechanistic links between NE proteins, such as the LINC complex, chromatin organisation and gene expression will be an important step further for a better understanding of genome expression in response to environmental stress.
Taken together, this functional analysis of the evolutionarily conserved LINC complex strengthened evidence for its role in nuclear morphology and revealed its contribution to chromocentre
positioning, heterochromatin compaction and maintenance of TGS. Further studies should be dedicated to understanding whether heterochromatin alteration is a consequence of nuclear morphology alteration or intrinsic function of the LINC complex.
MATERIALS AND METHODS
Plant materials
T-DNA insertion mutants were obtained from The European Arabidopsis Stock Centre (NASC, http://arabidopsis.info/) and were all in the Columbia-0 (Col-Columbia-0) ecotype background. T-DNA accession numbers and genes used in this study are described in Table 1. Seed batches from all genotypes were propagated together in the greenhouse under standard conditions. After 2 days of stratification at 4°C in the dark, Arabidopsis seedlings were grown under a 16-h-light–8-h-dark cycle at 23°C on germination medium containing 0.8% (w/v) agar, 1% (w/v) sucrose and 1× Murashige and Skoog salts (M0255; Duchefa Biochemie, Netherlands). Whole plants were harvested 14 days after germination (dag) for cotyledons and root observations. For each biological replicate, a typical experimental plan included a WT control and one or several mutants. For each genotype, three plants were used for genotyping, 8–10 for 3D image analysis, 4–6 for 3D in situ hybridisation and 15 for qRT-PCR analysis.
Sample preparation, Hoechst staining and 3D-FISH
3D images were collected from cells in their original tissue environment in whole-mount preparations (Bauwens et al., 1994) of 14 dag cotyledons and root hairs. Briefly, whole seedlings were collected and fixed using 1% formaldehyde and 10% DMSO in 1× PBS with 6.7 mM EGTA ( pH 7.5) under vacuum for 5 min and incubated for 25 min at room temperature. Tissues were then washed with methanol and ethanol washes, to obtain transparent tissue preparations. Nuclei in whole-mount preparations were either stained with Hoechst 33258 or repetitive sequences were revealed by 3D-FISH after progressive rehydration with PBS with 0.1% Tween 20.
For Hoechst staining, fixed tissues were stained overnight at 4°C in a solution of Hoechst 33258 (Sigma) at 25 µg/ml in PBS. To perform live-cell imaging, DNA was stained using PicoGreen®(Molecular probes) diluted to
1:400 in 0.01% Triton X-100 for 1 h at room temperature. Samples were then washed three times with 1× PBS, excess water removed with paper tissue and placed on a slide in PBS with glycerol (20:80) solution and covered with a coverslip for microscopic observations.
For 3D-FISH, hydrated tissues were washed twice in 2× SSC then incubated for 30 min in 2× SSC with HB50 (1:1) (50% formamide, 2× SSC, 50 mM sodium phosphate pH 7) and finally 30 min in HB50. Tissues were directly immersed in HB50 containing 1 µM final of LNA probes specific for the 180 bp centromeric repeats (Exiqon; 5′-GTATGATTGAGTATAA-GAACTTAAACC-3′). Tissues were hybridised overnight at 37°C, rinsed twice for 30 min at 42°C in SF50 (50% formamide, 2× SSC) and incubated overnight with 0.25 µg/ml Hoechst 33258 in PBS at 4°C. Samples were rinsed twice in 2× SSC and twice in PBS and mounted in PBS with glycerol (20:80) as described above.
To reveal simultaneously the 45S rDNA loci and the centromeric 180 bp repeats, the probes were labelled with Cy3-dUTP or Cy5-dUTP (GE Healthcare) by nick-translation (Roche) using a plasmid containing the 45S rDNA sequence from Triticum aestivum (Gerlach and Bedbrook, 1979) or the 180 bp probe from Arabidopsis thaliana (Martinez-Zapater et al., 1986) and 3D-FISH experiments were performed as previously described (Bauwens et al., 1994).
Microscope and 3D imaging methods
Microscopic observations were performed by structured illumination microscopy to produce confocal-like images using an Optigrid module (Leica Microsystems MAAF DM 16000B). All images were acquired using a 63× oil objective allowing a theoretical resolution of xy=0.24 and z=0.46 µm further reduced by the factor 2.3 according to the Nyquist– Shannon sampling theorem (Pawley, 2006) such that the final lateral and axial resolution used in this study were, respectively, xy=0.1 and z=0.2 µm. Furthermore, all initial anisotropic voxels are converted to isotropic voxel (i.e. cubic, xyz=0.1 µm) prior to calculation (Poulet et al., 2015). The
Journal
of
Cell
ImageJ plugin NucleusJ was used to characterise nuclear morphology and chromatin organisation (Poulet et al., 2015). A detailed description of the quantitative parameters generated by NucleusJ can be found in supplemental materials of Poulet et al. (2015). d(Nuc barycentre) is the barycentre of the nucleus measured by computing the distance map of the nucleus, which is the distance between each voxel of a given nucleus and the limit of the image background. Computation of the distance map is realised with the ImageJ plugin developed by Bob Dougherty (http://imagej. net/Local_Thickness) and is based on the Euclidean distance transformation (Saito and Toriwaki, 1994). d(Nuc barycentre) is preferred to the equivalent spherical radius (ESR) generated by NucleusJ as most of the nuclei investigated in this study are not spherical but instead have an elongated morphology. Theoretical data for the chromocentre distance for each nucleus were generated using the R package runif function to produce a theoretical uniform distribution on the interval from the minimum (min=0 at the nuclear periphery) to the maxmium (max=barycentre of the nucleus). The number n of chromocentres visualised as points per nucleus equals the number of chromocentres detected for each nucleus.
RNA extraction and qPCR
Total RNAs were extracted from 30 cotyledons using Tri-Reagent (Euromedex), treated with RQ1 DNase I (Promega) and purified using phenol-chloroform extraction. Reverse transcription was primed either with oligo(dT)15 or with random hexamers using M-MLV reverse transcriptase (Promega) (Table S4). The resulting cDNAs were diluted three times and further used in qPCR with the LightCycler®480 SYBR Green I Master kit
on the Roche LightCycler® 480. Transcript levels of interest were
normalised to SAND (At2g28390) (Czechowski et al., 2005) using the comparative threshold cycle method.
RNA-Seq data mining
Already published RNA-Seq datasets from the WT Col-0 ecotype were used in order to monitor the expression of candidate genes investigated in this study. The Illumina RNA-Seq data are available at the NCBI Sequence Read Archive (http://www.ncbi.nlm.nih.gov/Traces/sra/sra.cgi) under accession numbers SRR1463334, SRR1463335 and SRR826283 for cell-sorted guard cells from 10 dag cotyledons, SRR1463325 and SRR1463326 for epidermis from 10 dag cotyledons and SRR1042766, SRR1042767 and SRR656215 for roots from 7-day-old seedlings. Reads from RNA-Seq libraries were mapped onto the candidate gene sequences allowing no mismatches using TOPHAT v 2.0.14 (Kim et al., 2013) using standard settings and maximum of multihits set at 1, minimum intron length set at 15 bp, and maximum intron length set as 6000 bp. Reads were summed for each gene using HTseq-count with the overlap resolution mode set as intersection-non empty and with no strand-specific protocol (Anders et al., 2015). Transcription levels were normalised to SAND as for qRT-PCR and expressed in reads per kilobase of exon model (RPKM) per million mapped reads.
Statistics
Statistical analyses were performed using R (The R Core Team, 2015). All boxplots are represented as box containing 50% of the individuals starting from the first quartile (Q1) to the third quartile (Q3) with whiskers equal to 1.5 of the interquartile range (IQR=Q1–Q3). PCA was carried out with the FactoMineR package, an extension of R (Lê et al., 2008). R scripts were developed to automatically undertake statistical tests (t-test and correlation), generate PCA and boxplots on the data obtained after 3D image analysis using NucleusJ (available at http://imagejdocu.tudor.lu/doku.php? id=plugin:stacks:nuclear_analysis_plugin:start). A Student’s t-test was used to compare the theoretical uniform distribution of chromocentres to the observed data (distance chromocentre border to nuclear border and distance chromocentre barycentre to nuclear border) and means between WT and mutant backgrounds for qRT-PCR. A proportion test was applied to analyse the significance of the proportion of condensed chromocentres.
Acknowledgements
We thank Iris Meier (Ohio State University, USA) for providing wifi seeds and information about WIP and WIT genes and mutants, Paul Fransz (University of Amsterdam, The Netherlands) for technical advice and training in 3D-FISH
experiments and Maxime Claux for technical assistance in graphical representations.
Competing interests
The authors declare no competing or financial interests.
Author contributions
A.V.P. and C.T. supervised the study. A.P., S.D., C.D. and M.V. performed experiments. A.P. and C.T. designed the study and analysed the data. A.V.P., D.E.E. and C.T. wrote the manuscript.
Funding
This work was supported by Auvergne University and Oxford Brookes University to A.P., by the Agence Nationale de la Recherche (ANR-11 JSV2 009 01, ANR-12-ISV6-0001 to A.V.P.), by the Conseil Régional d’Auvergne and European Regional Development Fund (FEDER; to C.T.), and the Centre National de la Recherche Scientifique (PEPS-site to C.T.).
Supplementary information
Supplementary information available online at
http://jcs.biologists.org/lookup/doi/10.1242/jcs.194712.supplemental
References
Adams, R. L. and Wente, S. R. (2013). Uncovering nuclear pore complexity with innovation. Cell 152, 1218-1221.
Anders, S., Pyl, P. T. and Huber, W. (2015). HTSeq–a Python framework to work with high-throughput sequencing data. Bioinformatics 31, 166-169.
Baubec, T., Finke, A., Mittelsten Scheid, O. and Pecinka, A. (2014). Meristem-specific expression of epigenetic regulators safeguards transposon silencing in Arabidopsis. EMBO Rep. 15, 446-452.
Bauwens, S., Katsanis, K., Van Montagu, M., Van Oostveldt, P. and Engler, G. (1994). Procedure for whole mount fluorescence in situ hybridization of interphase nuclei on Arabidopsis thaliana. Plant J. 6, 123-131.
Bickmore, W. A. and van Steensel, B. (2013). Genome architecture: domain organization of interphase chromosomes. Cell 152, 1270-1284.
Bourbousse, C., Mestiri, I., Zabulon, G., Bourge, M., Formiggini, F., Koini, M. A., Brown, S. C., Fransz, P., Bowler, C. and Barneche, F. (2015). Light signaling controls nuclear architecture reorganization during seedling establishment. Proc. Natl. Acad. Sci. USA 112, E2836-E2844.
Bourdon, M., Pirrello, J., Cheniclet, C., Coriton, O., Bourge, M., Brown, S., Moïse, A., Peypelut, M., Rouyère, V., Renaudin, J.-P. et al. (2012). Evidence for karyoplasmic homeostasis during endoreduplication and a ploidy-dependent increase in gene transcription during tomato fruit growth. Development 139, 3817-3826.
Bupp, J. M., Martin, A. E., Stensrud, E. S. and Jaspersen, S. L. (2007). Telomere anchoring at the nuclear periphery requires the budding yeast Sad1-UNC-84 domain protein Mps3. J. Cell Biol. 179, 845-854.
Conrad, M. N., Lee, C.-Y., Wilkerson, J. L. and Dresser, M. E. (2007). MPS3 mediates meiotic bouquet formation in Saccharomyces cerevisiae. Proc. Natl. Acad. Sci. USA 104, 8863-8868.
Crisp, M., Liu, Q., Roux, K., Rattner, J. B., Shanahan, C., Burke, B., Stahl, P. D. and Hodzic, D. (2006). Coupling of the nucleus and cytoplasm role of the LINC complex. J. Cell Biol. 172, 41-53.
Croft, J. A., Bridger, J. M., Boyle, S., Perry, P., Teague, P. and Bickmore, W. A. (1999). Differences in the localization and morphology of chromosomes in the human nucleus. J. Cell Biol. 145, 1119-1131.
Czechowski, T., Stitt, M., Altmann, T., Udvardi, M. K. and Scheible, W.-R. (2005). Genome-wide identification and testing of superior reference genes for transcript normalization in arabidopsis. Plant Physiol. 139, 5-17.
de Nooijer, S., Wellink, J., Mulder, B. and Bisseling, T. (2009). Non-specific interactions are sufficient to explain the position of heterochromatic chromocenters and nucleoli in interphase nuclei. Nucleic Acids Res. 37, 3558-3568.
Dittmer, T. A., Stacey, N. J., Sugimoto-Shirasu, K. and Richards, E. J. (2007). LITTLE NUCLEI Genes affecting nuclear morphology in Arabidopsis thaliana. Plant Cell 19, 2793-2803.
Fang, Y. and Spector, D. L. (2005). Centromere positioning and dynamics in living Arabidopsis plants. Mol. Biol. Cell 16, 5710-5718.
Fennell, A., Fernández-Álvarez, A., Tomita, K. and Cooper, J. P. (2015). Telomeres and centromeres have interchangeable roles in promoting meiotic spindle formation. J. Cell Biol. 208, 415-428.
Fransz, P., de Jong, J. H., Lysak, M., Castiglione, M. R. and Schubert, I. (2002). Interphase chromosomes in Arabidopsis are organized as well defined chromocenters from which euchromatin loops emanate. Proc. Natl. Acad. Sci. USA 99, 14584-14589.
Gerlach, W. L. and Bedbrook, J. R. (1979). Cloning and characterization of ribosomal RNA genes from wheat and barley. Nucleic Acids Res. 7, 1869-1885.
Journal
of
Cell
Gerlitz, G. and Bustin, M. (2011). The role of chromatin structure in cell migration. Trends Cell Biol. 21, 6-11.
Goto, C., Tamura, K., Fukao, Y., Shimada, T. and Hara-Nishimura, I. (2014). The novel nuclear envelope protein KAKU4 modulates nuclear morphology in arabidopsis. Plant Cell 26, 2143-2155.
Graumann, K. and Evans, D. E. (2010). The plant nuclear envelope in focus. Biochem. Soc. Trans. 38, 307-311.
Graumann, K. and Evans, D. E. (2013). The nuclear envelope-structure and protein interactions. Ann. Plant Rev. 46, 19-56.
Graumann, K., Runions, J. and Evans, D. E. (2010). Characterization of SUN-domain proteins at the higher plant nuclear envelope. Plant J. 61, 134-144. Graumann, K., Vanrobays, E., Tutois, S., Probst, A. V., Evans, D. E. and Tatout,
C. (2014). Characterization of two distinct subfamilies of SUN-domain proteins in Arabidopsis and their interactions with the novel KASH-domain protein AtTIK. J. Exp. Bot. 65, 6499-6512.
Grob, S., Schmid, M. W. and Grossniklaus, U. (2014). Hi-C analysis in arabidopsis identifies the KNOT, a structure with similarities to the flamenco locus of drosophila. Mol. Cell 55, 678-693.
Guarda, A., Bolognese, F., Bonapace, I. M. and Badaracco, G. (2009). Interaction between the inner nuclear membrane lamin B receptor and the heterochromatic methyl binding protein, MeCP2. Exp. Cell Res. 315, 1895-1903.
Guelen, L., Pagie, L., Brasset, E., Meuleman, W., Faza, M. B., Talhout, W., Eussen, B. H., de Klein, A., Wessels, L., de Laat, W. et al. (2008). Domain organization of human chromosomes revealed by mapping of nuclear lamina interactions. Nature 453, 948-951.
Jacob, Y., Feng, S., LeBlanc, C. A., Bernatavichute, Y. V., Stroud, H., Cokus, S., Johnson, L. M., Pellegrini, M., Jacobsen, S. E. and Michaels, S. D. (2009). ATXR5 and ATXR6 are H3K27 monomethyltransferases required for chromatin structure and gene silencing. Nat. Struct. Mol. Biol. 16, 763-768.
Janski, N., Masoud, K., Batzenschlager, M., Herzog, E., Evrard, J.-L., Houlné, G., Bourge, M., Chabouté, M.-E. and Schmit, A.-C. (2012). The GCP3-interacting proteins GIP1 and GIP2 are required forγ-tubulin complex protein localization, spindle integrity, and chromosomal stability. Plant Cell 24, 1171-1187.
Jordan, N. D., West, J. P., Bottley, A., Sheikh, M. and Furner, I. (2007). Transcript profiling of the hypomethylated hog1 mutant of Arabidopsis. Plant Mol. Biol. 65, 571-586.
Jovtchev, G., Schubert, V., Meister, A., Barow, M. and Schubert, I. (2006). Nuclear DNA content and nuclear and cell volume are positively correlated in angiosperms. Cytogenet Genome Res. 114, 77-82.
Ketelaar, T., Faivre-Moskalenko, C., Esseling, J. J., Ruijter, N. C. A. de, Grierson, C. S., Dogterom, M. and Emons, A. M. C. (2002). Positioning of nuclei in arabidopsis root hairs an actin-regulated process of tip growth. Plant Cell 14, 2941-2955.
Kim, D., Pertea, G., Trapnell, C., Pimentel, H., Kelley, R. and Salzberg, S. L. (2013). TopHat2: accurate alignment of transcriptomes in the presence of insertions, deletions and gene fusions. Genome Biol. 14, R36.
Landrein, B. and Hamant, O. (2013). How mechanical stress controls microtubule behavior and morphogenesis in plants: history, experiments and revisited theories. Plant J. 75, 324-338.
Lê, S., Josse, J. and Husson, F. (2008). FactoMineR: an R package for multivariate analysis. J. Stat. Softw. 25, 1-18.
Levy, D. L. and Heald, R. (2010). Nuclear size is regulated by importinα and Ntf2 in xenopus. Cell 143, 288-298.
Liu, C. and Weigel, D. (2015). Chromatin in 3D: progress and prospects for plants. Genome Biol. 16, 170.
Martinez-Zapater, J. M., Estelle, M. A. and Somerville, C. R. (1986). A highly repeated DNA sequence in Arabidopsis thaliana. Mol. Gen. Genet. 204, 417-423.
Mattout, A., Cabianca, D. S. and Gasser, S. M. (2015). Chromatin states and nuclear organization in development—a view from the nuclear lamina. Genome Biol. 16, 174-189.
Méjat, A. and Misteli, T. (2010). LINC complexes in health and disease. Nucleus 1, 40-52.
Melaragno, J. E., Mehrotra, B. and Coleman, A. W. (1993). Relationship between endopolyploidy and cell size in epidermal tissue of arabidopsis. Plant Cell Online 5, 1661-1668.
Nagaki, K., Talbert, P. B., Zhong, C. X., Dawe, R. K., Henikoff, S. and Jiang, J. (2003). Chromatin immunoprecipitation reveals that the 180-bp satellite repeat is the key functional DNA element of arabidopsis thaliana centromeres. Genetics 163, 1221-1225.
Neumann, F. R. and Nurse, P. (2007). Nuclear size control in fission yeast. J. Cell Biol. 179, 593-600.
Oda, Y. and Fukuda, H. (2011). Dynamics of arabidopsis SUN proteins during mitosis and their involvement in nuclear shaping. Plant J. 66, 629-641. Pawley, J. B. (2006). Points, pixels, and gray levels: digitizing image data. In
Handbook of Biological Confocal Microscopy (ed. J. B. Pawley), pp. 59-79. Springer.
Pickersgill, H., Kalverda, B., de Wit, E., Talhout, W., Fornerod, M. and van Steensel, B. (2006). Characterization of the Drosophila melanogaster genome at the nuclear lamina. Nat. Genet. 38, 1005-1014.
Poulet, A., Arganda-Carreras, I., Legland, D., Probst, A. V., Andrey, P. and Tatout, C. (2015). NucleusJ: an ImageJ plugin for quantifying 3D images of interphase nuclei. Bioinformatics 31, 1144-1146.
Poulet, A., Probst, A. V., Graumann, K., Tatout, C. and Evans, D. (2016). Exploring the evolution of the proteins of the plant nuclear envelope. Nucleus 1-14. [Epub ahead of print].
Probst, A. V., Fransz, P. F., Paszkowski, J. and Mittelsten Scheid, O. (2003). Two means of transcriptional reactivation within heterochromatin. Plant J. Cell Mol. Biol. 33, 743-749.
Qian, P., Hou, S. and Guo, G. (2009). Molecular mechanisms controlling pavement cell shape in Arabidopsis leaves. Plant Cell Rep. 28, 1147-1157.
Ruault, M., De Meyer, A., Loïodice, I. and Taddei, A. (2011). Clustering heterochromatin: sir3 promotes telomere clustering independently of silencing in yeast. J. Cell Biol. 192, 417-431.
Saito, T. and Toriwaki, J.-I. (1994). New algorithms for euclidean distance transformation of an n-dimensional digitized picture with applications. Pattern Recogn. 27, 1551-1565.
Schubert, V., Berr, A. and Meister, A. (2012). Interphase chromatin organisation in Arabidopsis nuclei: constraints versus randomness. Chromosoma 121, 369-387.
Shumaker, D. K., Dechat, T., Kohlmaier, A., Adam, S. A., Bozovsky, M. R., Erdos, M. R., Eriksson, M., Goldman, A. E., Khuon, S., Collins, F. S. et al. (2006). Mutant nuclear lamin A leads to progressive alterations of epigenetic control in premature aging. Proc. Natl. Acad. Sci. USA 103, 8703-8708. Simon, L., Voisin, M., Tatout, C. and Probst, A. V. (2015). Structure and function of
centromeric and pericentromeric heterochromatin in Arabidopsis thaliana. Front Plant Sci. 30, 1049-1057.
Soppe, W. J. J., Jacobsen, S. E., Alonso-Blanco, C., Jackson, J. P., Kakutani, T., Koornneef, M. and Peeters, A. J. M. (2000). The late flowering phenotype of fwa mutants is caused by gain-of-function epigenetic alleles of a homeodomain gene. Mol. Cell 6, 791-802.
Steimer, A., Amedeo, P., Afsar, K., Fransz, P., Scheid, O. M. and Paszkowski, J. (2000). Endogenous targets of transcriptional gene silencing in arabidopsis. Plant Cell Online 12, 1165-1178.
Sugimoto-Shirasu, K. and Roberts, K. (2003).“Big it up”: endoreduplication and cell-size control in plants. Curr. Opin. Plant Biol. 6, 544-553.
Sugimoto-Shirasu, K., Roberts, G. R., Stacey, N. J., McCann, M. C., Maxwell, A. and Roberts, K. (2005). RHL1 is an essential component of the plant DNA topoisomerase VI complex and is required for ploidy-dependent cell growth. Proc. Natl. Acad. Sci. USA 102, 18736-18741.
Tamura, K. and Hara-Nishimura, I. (2011). Involvement of the nuclear pore complex in morphology of the plant nucleus. Nucleus 2, 168-172.
Tamura, K., Fukao, Y., Iwamoto, M., Haraguchi, T. and Hara-Nishimura, I. (2010). Identification and characterization of nuclear pore complex components in Arabidopsis thaliana. Plant Cell Online 22, 4084-4097.
Tashiro, S. and Lanctô t, C. (2015). The international nucleome consortium. Nucleus 6, 89-92.
Tessadori, F., Chupeau, M.-C., Chupeau, Y., Knip, M., Germann, S., van Driel, R., Fransz, P. and Gaudin, V. (2007a). Large-scale dissociation and sequential reassembly of pericentric heterochromatin in dedifferentiated Arabidopsis cells. J. Cell Sci. 120, 1200-1208.
Tessadori, F., Schulkes, R. K., Driel, R. van and Fransz, P. (2007b). Light-regulated large-scale reorganization of chromatin during the floral transition in Arabidopsis. Plant J. 50, 848-857.
Tessadori, F., van Zanten, M., Pavlova, P., Clifton, R., Pontvianne, F., Snoek, L. B., Millenaar, F. F., Schulkes, R. K., van Driel, R., Voesenek, L. A. C. J. et al. (2009). Phytochrome B and histone deacetylase 6 control light-induced chromatin compaction in Arabidopsis thaliana. PLoS Genet. 5, e1000638.
The R Core Team (2015). R: A Language and Environment for Statistical Computing. R Foundation for Statistical Computing Version 3.2.3.
Thompson, H. L., Schmidt, R. and Dean, C. (1996). Identification and distribution of seven classes of middle-repetitive DNA in the Arabidopsis thaliana genome. Nucleic Acids Res. 24, 3017-3022.
Traas, J., Hü lskamp, M., Gendreau, E. and Höfte, H. (1998). Endoreduplication and development: rule without dividing? Curr. Opin. Plant Biol. 1, 498-503. Vaillant, I., Tutois, S., Jasencakova, Z., Douet, J., Schubert, I. and Tourmente,
S. (2008). Hypomethylation and hypermethylation of the tandem repetitive 5S rRNA genes in Arabidopsis. Plant J. Cell Mol. Biol. 54, 299-309.
Van Zanten, M., Koini, M. A., Geyer, R., Liu, Y., Brambilla, V., Bartels, D., Koornneef, M., Fransz, P. and Soppe, W. J. J. (2011). Seed maturation in Arabidopsis thaliana is characterized by nuclear size reduction and increased chromatin condensation. Proc. Natl. Acad. Sci. USA 108, 20219-20224. Vongs, A., Kakutani, T., Martienssen, R. A. and Richards, E. J. (1993).
Arabidopsis thaliana DNA methylation mutants. Science 260, 1926-1928.
Journal
of
Cell
Wang, H., Dittmer, T. A. and Richards, E. J. (2013). Arabidopsis CROWDED NUCLEI (CRWN) proteins are required for nuclear size control and heterochromatin organization. BMC Plant Biol. 13, 200.
Webster, M., Witkin, K. L. and Cohen-Fix, O. (2009). Sizing up the nucleus: nuclear shape, size and nuclear-envelope assembly. J. Cell Sci. 122, 1477-1486. Xiong, H., Rivero, F., Euteneuer, U., Mondal, S., Mana-Capelli, S., Larochelle, D., Vogel, A., Gassen, B. and Noegel, A. A. (2008). Dictyostelium sun-1 connects the centrosome to chromatin and ensures genome stability. Traffic 9, 708-724.
Ye, Q., Callebaut, I., Pezhman, A., Courvalin, J.-C. and Worman, H. J. (1997). Domain-specific interactions of human HP1-type chromodomain proteins and inner nuclear membrane protein LBR. J. Biol. Chem. 272, 14983-14989. Yelagandula, R., Stroud, H., Holec, S., Zhou, K., Feng, S., Zhong, X.,
Muthurajan, U. M., Nie, X., Kawashima, T., Groth, M. et al. (2014). The
histone variant H2A.W defines heterochromatin and promotes chromatin condensation in arabidopsis. Cell 158, 98-109.
Zhou, X. and Meier, I. (2014). Efficient plant male fertility depends on vegetative nuclear movement mediated by two families of plant outer nuclear membrane proteins. Proc. Natl. Acad. Sci. USA 111, 11900-11905.
Zhou, X., Graumann, K., Evans, D. E. and Meier, I. (2012). Novel plant SUN– KASH bridges are involved in RanGAP anchoring and nuclear shape determination. J. Cell Biol. 196, 203-211.
Zhou, X., Graumann, K. and Meier, I. (2015a). The plant nuclear envelope as a multifunctional platform LINCed by SUN and KASH. J. Exp. Bot. 66, 1649-1659. Zhou, X., Groves, N. R. and Meier, I. (2015b). Plant nuclear shape is independently determined by the SUN-WIP-WIT2-myosin XI-i complex and CRWN1. Nucleus 6, 144-153.
Journal
of
Cell
Figure S1: Correlation between nuclear and cell area in the cotyledon epidermis.
A) Epidermis from WT cotyledons was imaged with 63x magnification using a
Leica-Structured Illumination Microscope after nuclear staining with PicoGreen® (brown).
Differential Interference Contrast (DIC) and PicoGreen staining are recorded for the same
area of the epidermis and a maximal Z projection is produced from the PicoGreen-stained
images. An overlay between DIC and Z projection images is used to determine cell and
nuclear area using standard procedures under Image J. Scale bar: 10µm. B) Nuclear area is
plotted against cell area (both expressed in µm
2). Linear regression analysis indicates a
positive correlation between nuclear and cell area (r
2= 0.68; p-value < 0.0001). 95%
confidence intervals are indicated as red dashed line. n=62.
A
B
Figure S2: Total amount of heterochromatin and nuclear volume positively correlates
in pavement cells.
A) Nuclear and chromocentre parameters obtained from pavement cells were used to plot the
total volume of chromocentres (VCcTotal; µm3) against the nuclear volume (VNuc; µm3).
Linear regression analysis (black line) and 95% confidence intervals (red dashed line) are
indicated. B) The values obtained from nuclear volumes in pavement cells were grouped in 5
classes according to their volume: 0-30, 30-60, 60-120, 120-240 and >240 µm
3respectively
with n = 70, 108, 200, 178 and 57 nuclei. Each group was then plotted against the
corresponding mean ± SD of VCcTotal (µm
3). Linear regression analysis (black line)
indicates a positive correlation between the total amount of heterochromatin and the nuclear
volume with r
2= 0.996 and p-value <0.0001. 95% confidence intervals are indicated as red
dashed lines.
Fig. S3: Functional analysis of triple sun1 sun4 sun5 mutant
A) Arabidopsis sun3-1, sun4-1 and sun5-1 T-DNA insertions as described in Graumann et al.
(2014). Transcript levels were analysed in homozygous mutant lines with two PCR primer
pairs (red arrows) flanking the T-DNA insertions (Table S5). The Actin gene (ACT) was used
as control. No detectable expression in any of the single mutants was observed with primers
across the T-DNA insertions. B) Tukey boxplots for selected parameters of nuclear
morphology (elongation and sphericity) generated by NucleusJ using Col-0, double and triple
sun mutants. ns: non-significant; *: P≤0.01, **: P≤0.001, ***: P≤0.0001. C) Analysis of
seedling size at 10 days after germination (left). Boxplots of surface area (µm
2) were recorded
by ImageJ (right); D) Root hair phenotype showing disorganised root hairs in the triple
mutant in comparison to Col-0.
Fig. S4: RNA expression of candidate genes in epidermis, guard cells and roots.
RNA-Seq datasets from wild type Col-0 ecotype from guard cells (GC) at 10 day-old
cotyledon (SRR1463325, SRR1463326), epidermis at 10 day-old cotyledon (SRR1042766,
SRR1042767, SRR656215) and roots at 7 day-old cotyledon (SRR1463334, SRR1463335,
SRR826283) were used in order to monitor the expression of candidate genes investigated in
this study. Histograms show means of transcription levels expressed in RPKM ± SEM.
At2g28390 (SAND) was used as a reference and set at 1 RPKM (dashed line in red).
0 5 10 15 Root GC Epidermis Relative expression in RPKM RNA-Seq SAND
Table S1: Numbers of nuclei collected for the various genetic backgrounds
Wild type background Nuclear periphery mutants chromatin mutants
Col-0 rep1 Col-0 rep2 Col-0 rep3 Col-0 rep4 Col-0 rep5 wifi sun1 sun4 sun5 crwn1
crwn2 ddm1-10 atxr5 atxr6 TOTAL Average
GC 94 154 120 202 127 190 112 82 108 107 1296 118
PC 91 126 139 114 120 174 124 119 127 132 1266 115
RC 26 59 44 59 25 57 27 39 48 38 422 38


![Fig. 3. Chromocentres are located close to the nuclear periphery. (A) NucleusJ was used to compute the distance between the limit of the Hoechst DNA staining (blue) and the chromocentres (Cc, pink), boundary [d(Cc border)] or barycentre [d(Cc barycentre)]](https://thumb-eu.123doks.com/thumbv2/123doknet/14548731.536660/6.918.165.754.84.855/chromocentres-periphery-nucleusj-distance-hoechst-chromocentres-barycentre-barycentre.webp)