HAL Id: hal-00845200
https://hal.archives-ouvertes.fr/hal-00845200
Preprint submitted on 16 Jul 2013
HAL is a multi-disciplinary open access
archive for the deposit and dissemination of sci-entific research documents, whether they are pub-lished or not. The documents may come from teaching and research institutions in France or abroad, or from public or private research centers.
L’archive ouverte pluridisciplinaire HAL, est destinée au dépôt et à la diffusion de documents scientifiques de niveau recherche, publiés ou non, émanant des établissements d’enseignement et de recherche français ou étrangers, des laboratoires publics ou privés.
Genuine saving trajectory and vulnerability: the
example of New-Caledonia
Cécile Couharde, Vincent Geronimi, Elodie Maître d’Hôtel, Armand Taranco
To cite this version:
Cécile Couharde, Vincent Geronimi, Elodie Maître d’Hôtel, Armand Taranco. Genuine saving trajec-tory and vulnerability: the example of New-Caledonia. 2011. �hal-00845200�
Genuine saving trajectory
and vulnerability: the
example of New-Caledonia
Cécile Couharde, Vincent G
eronimi, Elodie Maitre
d’Hotel, Armand Taranco
Qu’est-ce que le CEMOTEV ?
Le CEMOTEV (Centre d’Etudes sur la Mondialisation, les Conflits, les Territoires et les Vulnérabilités), équipe d’accueil habilitée par le ministère de l’Enseignement supérieur et de la Recherche (EA n°4447), a pour objectif de renforcer les activités de recherche sur la diversité et la complexité liées à la mondialisation et au développement durable en mettant l’accent sur : (1) les dimensions de temporalités, d’inerties historiques, d’irréversibilités qui permettent d’éclairer les vulnérabilités cachées ; (2) les dimensions territoriales des processus économiques et sociaux, introduites par la mondialisation, les questions d’environnement et de développement, les nouvelles articulations entre les différents niveaux d’échelle (mondial, continental, national, régional et local) qu’elles produisent, ainsi que les conflits générés.
Le CEMOTEV est structuré autour de deux axes de recherche :
- L’axe CARMEN - Conflits Autour des Ressources Naturelles, Mondialisation et Gouvernance des Territoires - qui privilégie trois domaines de recherche : les enjeux territoriaux liés aux ressources naturelles et énergétiques ; la gouvernance des territoires et des aires protégées ; le tourisme, l’environnement et le développement : du local au global.
- L’axe RÉVÉES - Recherches et Études sur les Vulnérabilités Économiques Environnementales et Sociales – qui privilégie trois domaines de recherche : l’identification de la nature des risques et l’appréhension de l’exposition aux risques ; les relations entre vulnérabilité et développement soutenable ; l’analyse des capacités de réponse aux chocs.
Thématiques de recherche : Mondialisation et gouvernance, vulnérabilités, conflits, économie des territoires, valorisation et gestion des ressources naturelles et des actifs environnementaux, paiements pour services environnementaux, réseaux énergétiques et cultures agro-énergétiques, aires « protégées » et territoires, tourisme du local au global, filières de production mondiale.
Pluridisciplinarité : Les thématiques abordées font appel à divers champs de la science économique : économie de l’environnement, économie du développement, économie du développement durable, économie internationale, économie industrielle. Elles sont abordées dans une perspective pluridisciplinaire avec la géographie.
Réseaux et projets au Nord et au Sud : Les problématiques de la mondialisation, de la vulnérabilité, des conflits, du développement durable conduisent le CEMOTEV à mettre l’accent sur les nouvelles dynamiques des relations Nord-Sud. Les réseaux de recherche existants (en Afrique, en Amérique latine et en Asie) et la participation aux projets de recherche renforcent les logiques partenariales Nord-Sud.
Pour en savoir plus vous pouvez consulter le site internet
http://www.cemotev.uvsq.fr/ (en construction)
Laboratoire CEMOTEV
Université de Versailles Saint-Quentin-en-Yvelines 47, bd Vauban, 78047 Guyancourt Cedex, France cemotev@uvsq.fr
Genuine saving trajectory and vulnerability:
the example of New-Caledonia
Cécile Couharde
CEMOTEV, University of Versailles Saint-Quentin, France. Email: cecile.couharde@uvsq.fr
Vincent G
eronimi
CEMOTEV, University of Versailles Saint-Quentin, France. Email: vincent.geronimi@uvsq.fr
Elodie Maitre d’Hotel
GEMDEV (Scientific Network on Globalisation and Development), France. E-mail : elodiemaitredhotel@yahoo.fr
Armand Taranco
University Paul Cézanne, France. E-mail : armand.taranco@univ-cezanne.fr
Cahier du CEMOTEV n°2011-02
Pour citer ce document
Couharde C., Geronimi V., Maitre d’Hotel E., Taranco A., 2011, « Genuine saving trajectory and vulnerability : the example of New-Caledonia », Cahier du CEMOTEV n°2011-02, Université de Versailles Saint-Quentin-en-Yvelines.
Abstract : Genuine Saving Trajectory and Vulnerability: the Example of New-Caledonia
Cécile Couharde, Vincent Geronimi, Elodie Maitre d’Hotel, Armand Taranco
The aim of this article is to study the vulnerability of the New-Caledonian economy from the analysis of the historical trajectories of genuine saving and its component linked to natural capital. To this end, we calculate New-Caledonia’s genuine saving, in accordance with the World Bank’s approach. This calculation enables the assertion that at first glance the New-Caledonian economy doesn’t show vulnerability signs insofar as the appreciation of assets linked to physical and human capital more than compensated the depreciation of assets linked to natural capital between 1970 and 2007. However, the analysis of the various components of the genuine saving trajectory using a Kalman filter reveals threshold effects in the nickel sector, thresholds from which the sustainability of New-Caledonia’s development trajectory may be challenged.
Key Words: genuine saving, nickel, New-Caledonia, Kalman filter, vulnerability
Résumé : Trajectoire de l’épargne véritable et vulnérabilité : l’exemple de la Nouvelle-Calédonie
Cécile Couharde, Vincent Geronimi, Elodie Maitre d’Hotel, Armand Taranco
L'objectif de cet article est d'analyser la vulnérabilité de l'économie de la Nouvelle Calédonie à partir des trajectoires suivies par l'épargne véritable et par sa composante liée au capital naturel. À cette fin, nous calculons l’épargne véritable de la Nouvelle-Calédonie, conformément à l'approche développée par la Banque mondiale. Ce calcul révèle que l’économie néo-calédonienne ne présente pas, à première vue, des signes de vulnérabilité. Entre 1970 et 2007, l'évolution des actifs liés au capital physique et au capital humain a, en effet, plus que compensé la dégradation des actifs liés au capital naturel. Toutefois, l'analyse des différentes composantes de la trajectoire de l’épargne véritable à partir d'un filtre de Kalman révèle dans le secteur nickel des seuils, à partir desquels la soutenabilité de la trajectoire de développement de la Nouvelle-Calédonie peut être remise en cause.
Table of contents
Introduction 7
1. Caledonian genuine saving: an evaluation using the World Bank’s approach 8
1.1. Theoretical foundation and Genuine Saving’s mode of calculation 8
1.2. Evaluation of Caledonian genuine saving 10
2. Genuine saving trajectory: an analysis using kalman filter 14
2.1. Theoretical framework: the Kalman filter 14
2.2. Cycles, trends and breaks in the evolution of genuine saving 16
3. Evaluation of the vulnerability of the new-caledonian economy 18
3.1. Sensitivity of genuine saving to the nickel sector 18
3.2. Threshold effects 20
Conclusion 24
References 25
Introduction
Although New-Caledonia records a sustained economic growth (more than 3.5% per year on average over the 1988-2008 period (CEROM1, 2008), its economy can still be described as vulnerable2. New-Caledonia is part of the Small Island Developing States list as established by the United Nations. These Small Island Developing States share common features, some of which New-Caledonia shows particularly clearly: small population (242,000 inhabitants), remoteness from world markets and vulnerability to external shocks. This vulnerability is explained both by the high concentration of exports in the nickel sector and by a high instability linked to the strong volatility of the nickel exchange rate. However, these criteria don’t capture all the fundamental stakes that natural resources represent for the sustainability of the development trajectory of a territory such as New-Caledonia. Indeed, it faces the challenge of having to reconcile the exploitation of its natural resources–largely dominated by the nickel sector, a current income source – without jeopardizing its future development. The genuine saving concept introduced by Pearce & Atkinson (1993) and popularized by the World Bank (Hamilton, 1994; Hamilton & Clemens 1999; Hamilton, 2000) allows the definition of conditions under which a development trajectory may be considered sustainable. Indeed, its calculation provides a measure of the economy’s ability to maintain or not its per capita consumption levels in the future. Genuine saving can be defined as the sum of net investments in physical, natural and human capital. By considering all capital stocks relevant to production, consumption, and future welfare creation possibilities, the genuine saving approach may fall within a vulnerability-oriented analysis. Indeed, the assimilation of a country’s wealth to a portfolio of physical, natural, human and financial assets allows the questioning of its resilience abilities.
However, insofar as it falls from the outset within a long-term perspective, the measure of genuine saving doesn’t enable the grasping of short and medium-term dynamics which shape the economy’s trajectories and the true nature of vulnerability. Indeed, on a macroeconomic scale, vulnerability can be assimilated to a country’s chance for its trajectory’s sustainability to be hampered by the hazards it undergoes on these short and medium-term horizons.
The aim of this article is precisely to study the vulnerability elements of the New-Caledonian economy from the analysis of the historical trajectories followed by genuine saving and its component linked to natural capital. Particularly, we try to answer the following questions: what are the main hazards which disturbed the trajectory followed by New-Caledonian genuine saving? What part is played by the nickel sector? From which thresholds are these hazards likely to challenge the sustainability of the development trajectory followed by New-Caledonia?
The rest of the article is organized as follows. In a first section, we present the genuine saving measure proposed by the World Bank and we apply it to New Caledonia. In a second section we analyse more precisely the trajectory followed by New-Caledonian genuine saving through the Kalman filter method. In a third section we try to clarify the influence of the nickel sector over genuine saving and to grasp the vulnerability of New-Caledonian economy through threshold detection. The last section concludes.
1 “Comptes Economiques Rapides de l’Outre-Mer”: Quick Overseas Economic Accounting.
2 According to our own estimates of the economic vulnerability indicator used by the UNDP’s Development
Committee, New-Caledonia is part of the world’s most vulnerable economies: 127th out of 130 countries for which the indicator was calculated.
1. Caledonian genuine saving: an evaluation using the World
Bank’s approach
First, the genuine saving concept and its World Bank-developed mode of calculation are presented (1.1); this method is then applied to the Caledonian economy (1.2).
1.1. Theoretical foundation and Genuine Saving’s mode of calculation
The consideration of natural resources and its impact on growth trajectories has generated a profuse theoretical literature. The great majority of contributions presuppose that society presents an inter-temporal social welfare criterion it tries to maximize, under technical restrictions of manufactured, technological, and human capital stock accumulation, and natural capital stock evolution. The social welfare criterion is most of the time the expected utility (D’Autume and Schubert, 2008). Particularly, some growth models relative to the optimal use of the income generated by resource extraction try to set rules regarding the amounts to use today and those to invest in physical capital so as to increase future consumption. The key question these models ask is whether an optimal growth is sustainable in the sense that it would allow a welfare level which wouldn’t decrease over time. The basic result is that, unless economies little limited by natural resources are considered, consumption reaches zero on the long term (Solow, 1986, 1993). Thus, it is necessary to establish rules allowing the non-decrease of welfare in time by maintaining the stock of capital, including natural capital. This question was studied by Hartwick (1977) who defined an intuitive rule according to which natural resources rent should be reinvested in physical capital.
From this theoretical framework, several empirical studies have been developed so as to measure the sustainability of development trajectories. In these studies, development is deemed sustainable if it ensures, at a minimum, that national wealth per habitant is maintained, while preserving (or replacing) the sources of this wealth, that is to say the different capital types: physical, natural, and human. Environmental constraints to economic growth appear as soon as the degradation of one of the natural capital’s functions doesn’t allow anymore an unchanged progress in economic activity: raw materials depletion, waste accumulation, insufferable nuisances, and life threats.
Seeing that these environmental constraints and their possible impact on future growth weren’t combined with any numeric criteria, the World Bank defined in the late nineties and from the works of Pearce and Atkinson (Pearce & Atkinson, 1993), an “adjusted net saving” (or genuine saving) indicator (Hamilton & Clemens, 1999). This indicator broadens the measure of net saving coming out from national accounting by including elements concerning the evolution of human and natural capital stocks into the appreciation of countries’ wealth (World Bank, 2006). Particularly, the depletion of natural resources is analysed as a natural assets liquidation process and thus contributes negatively to net income and therefore to net savings. Conversely, education expenditures contribute positively to a country’s wealth by increasing the saving ability of economies.
This approach provides a systematic and consistent frame of analysis in terms of sustainable development: for wealth to be maintained for future generations and thus for development to be sustainable, savings have to be sufficient to at least cover the total capital diminution, the
different types of capital being assumed fully interchangeable. In addition, this approach makes it possible to key into the national accounting aggregates from which is deduced a genuine saving indicator.
Thus, if we consider a closed economy with three factors of production: labour (L), physical capital ( K ) and a resource flow (R) extracted from a natural capital stock (N), the accounting equality between uses and resources is written as:
qR rK wL Q I C+ = = + + (1)
Where C is public and private consumptions, I is public and private gross investments, w is the real wage rate, r is the interest rate, q is the resource’s output rate and Q is the product.
The expression of ecologically adjusted income, or net income, is written thus:
rK wL qR Q qR I C+ − = − = + (2)
With qR being the value of the depreciation of natural capital.
If we take into account the depreciation of physical capital (δ ), with K δ being the depreciation rate by time unit, we then obtain the genuine saving definition:
INCOME NATIONAL NET PRODUCT NATIONAL NET SAVING GENUINE ) (r K wL K qR Q K qR I C+ − −δ = − −δ = + −δ (3) That is: ON DEPRECIATI CAPITAL NATURAL SAVING NET SAVING GENUINE qR K C Q K qR I−− =−−− δ δ (4)
Thus, genuine saving can be defined as net saving minus natural resources depletion, analysed here as a natural asset liquidation process.
The approach developed by the World Bank then consists in calculating this genuine saving while also considering human capital, approximated through current education expenditures. Indeed, these are not considered as consumption, but as an investment in human capital. They thus contribute to a country’s wealth and must be added to its net saving. In addition to the depreciation of natural capital, natural resources depletion also takes into account flows of pollution.
Altogether, genuine saving (GS) is obtained using the following equation (Bolt et al., 2002) :
CD RDN CSE NS GS = + − − (5) Where : NS, Net Saving;
CSE, Current Education Expenditures including operating expenses (wages, books) but not investment expenses considered as fixed capital (buildings and facilities);
CD, Pollution-linked damages which only concern CO2 emissions. These are counted based on a social cost estimated in the literature to 20 USD/ton in 1995 (Frankhauser, 1994).
The genuine saving rate (GSR) is then obtained by dividing genuine saving (GS) by Gross National Disposable Income (GNDI) :
GNDI GS
GSR = (6)
1.2. Evaluation of Caledonian genuine saving
A- Data presentation
The data we have mobilised directly or not to evaluate Caledonian genuine saving over the 1970-2007 period are presented in Table A of Appendix.
Series relevant to gross saving for the 1970-1988 period come from New-Caledonia’s national accounting (Institut de la Statistique et des Etudes Economiques3). Changes in the final consumption calculation occurred in 1998 without provoking a retropolation as yet. Thus according to the ISEE, from 1970 to 1997, New-Caledonia’s gross saving might be overestimated because of the underestimation of total final consumption over this period. Without any data covering the more recent period, Gross Saving was reconstructed by deducing government’s and households’ final consumption from the Gross National Disposable Income (GNDI).
Data relative to the calculation of the depreciation of fixed capital aren’t available because New-Caledonia doesn’t have a capital account. That is why the retained data were the yearly ones from World Bank’s Adjusted Net Saving Data Center database, available online (World Bank, 2007). These data retrace the depreciation of fixed capital counted as GNDI percentage. Current and capital public education expenditures are available in an education account set up by ISEE. However, these data only cover the 2000-2006 period. Expenditures over the 1970-1999 and 2006-2007 periods are assessed using data relevant to school population (available at the ISEE for 1970-2007) and to average education expenditures per pupil (available for 2003-2005)4.
Natural capital is composed of non-renewable resources, essentially ones extracted from the underground, and of renewable resources limited to forests according to the method developed by the World Bank. The depletion of natural capital is calculated from the extraction rents of these resources. Nickel exploitation rents in New-Caledonia are calculated from the annual extracted quantities of nickel available for 1970-2007 from the ISEE, and from the nickel exchange rate available in the World Bank’s Adjusted Net Saving Data Center database. These quantities, multiplied by the nickel exchange rate, give the nickel production
3 ISEE, Institute of Statistics and Economic Studies
4 To this end, a series of average education expenditures per pupil was reconstructed for the 1970-2003 period by
applying the average schooling cost’s growth rate to the series referring to the year 2003. Total education expenditures are then obtained by multiplying these average expenditures per pupil by the school population. Given that these total expenditures include functioning expenditures and capital ones, it is presupposed in accordance with the World Bank’s recommendation that functioning expenditures amount to 90% of the total.
in value for the whole period. The value of the exploitation rent of this natural resource is calculated by applying a rent rate estimated to 35% by the World Bank5 (Hamilton et
Clemens, 1999). The evaluation of forest degradation rents in New-Caledonia relies on data relevant to timber production both in volume and value, available from the “Direction du Développement Rural”6, and on data about the production costs that we have reconstructed
from the trading accounts of a sawmill.
Pollution-linked damages were assessed using data concerning the CO2 quantities emitted in New-Caledonia, available in the World Development Indicators database (World Bank, 2008) for the period 1970-2004, and coming from the “Direction de l’Industrie, des Mines et de l’Energie”7 for the period 2005-2007. According to the approach developed by the World Bank, the emitted quantities per inhabitant are multiplied by the Caledonian population (ISEE data) so as to obtain quantities of emitted CO2 in tons (after molar molecular mass adjustment). Pollution-linked damages are then obtained by applying the social cost of one emitted carbon ton (estimated to 20USD in 1995) to these emitted quantities.
5 Nickel exploitation rents thus amount to 35% of nickel production value. 6 Rural Development Directorate
B- New-Caledonian genuine saving and genuine saving rate
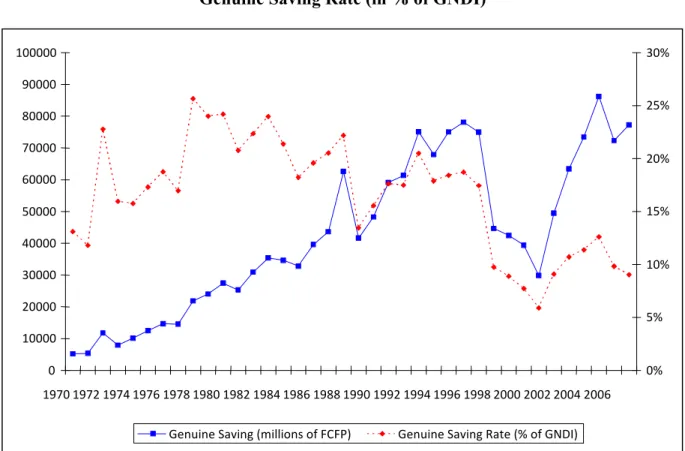
By gathering all these elements, the results lead to a genuine saving which is increasing over the whole period (Figure 1). The appreciation of assets linked to physical capital (net savings) and human capital (education expenditures) thus has more than compensated the depreciation linked to the devaluation of natural assets and pollution emissions.
Figure 1. Genuine Saving (in millions of FCPF8) and Genuine Saving Rate (in % of GNDI)
Source: authors’ calculation
As genuine saving is stated in current prices, it is not possible to distinguish between what result from price effects and what result from volume effects in the explication of its evolution. That is why most of the studies retain as a relevant indicator the genuine saving rate which relates genuine saving to Gross National Disposable Income (GNDI) and allows international comparison. The evolution of this indicator over the period shows a break in 1979 after which the genuine saving rate is characterized by a decreasing trend. If genuine saving tends to increase in New Caledonia, since 1970, this increase is still inferior to that of the GNDI (Figure 1).
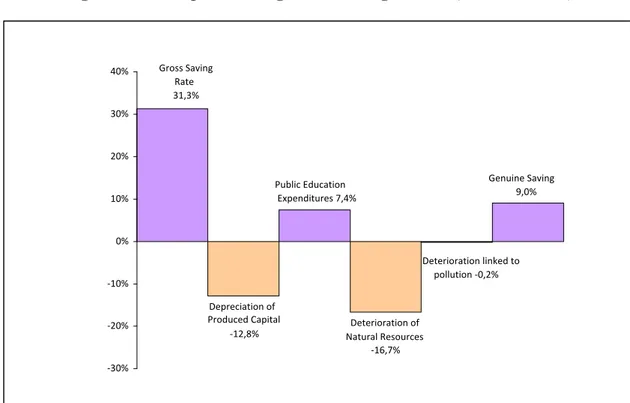
Figure 2 allows the specification of the characteristics of sustainable development in New-Caledonia in 2007, obtained from a genuine saving-oriented approach.
8 FCFP: Franc des Colonies Françaises du Pacifique (“French Colonies of the Pacific franc”)
0 10000 20000 30000 40000 50000 60000 70000 80000 90000 100000 1970197219741976197819801982198419861988199019921994199619982000200220042006 0% 5% 10% 15% 20% 25% 30%
Figure 2. Decomposition of genuine saving in 2007 (in % of GNDI)
Source: authors’ calculations
For New-Caledonia, in 2007, the positive genuine saving (9% of GNDI) means globally that the future consumption can’t be decreasing, i.e. that the total wealth value hasn’t been diminished. The depreciation of produced capital (-12.8%), the deterioration of natural resources (mainly linked to the nickel exploitation, -16.7% of GNDI) and that linked to pollution (-0.2% of GNDI) are more than compensated by the importance of gross saving (31.3% of GNDI) and public education expenditures (7.4%). The nickel extraction rent is thus reinvested in the creation of human and physical capital, beyond what is necessary to keep total wealth unchanged.
Thus, the calculation of genuine saving allows a first evaluation of the sustainability of New-Caledonian development. However, it only gives a limited view of the country’s vulnerability which may be defined on a macroeconomic scale as the country’s chance to see the sustainability of its trajectory hampered by the hazards it undergoes (Guillaumont, 2006). In the case of New-Caledonia, this issue is all the more pressing since genuine saving shows a high instability which is mainly explained by the volatility of the nickel exchange rate.
Deterioration of Natural Resources -‐16,7% Gross Saving Rate 31,3% Depreciation of Produced Capital -‐12,8%
Deterioration linked to pollution -‐0,2% Genuine Saving 9,0% Public Education Expenditures 7,4% -‐30% -‐20% -‐10% 0% 10% 20% 30% 40%
2. Genuine saving trajectory: an analysis using kalman filter
In order to analyse more precisely the trajectory followed by genuine saving, we apply a Kalman filter to the data series (2.1.). Indeed, this approach allows the isolation of the trend, the cyclical and the irregular components of genuine saving, and the detection of potential breaks in the dynamical regime which may affect an economy highly dependent on raw materials such as that of New Caledonia (2.2.).
2.1. Theoretical framework: the Kalman filter
In many situations, time series may be represented by a state space model. The Kalman filter, which relies on a state space model, allows the realization of a certain number of operations on time series such as decomposition into trend, cyclical, and irregular components, prediction, and it also enables contribution to the detection of structural breaks. Harvey (1989) introduced this approach in mono-varied and multi-varied structural models to estimate the unobservable components of a time series.
The Kalman filter generalises a good deal of modellings (ARMA, for instance) and filters. Thus, the Hodrick-Prescott filter may be considered as a particular case of a structural model as it has been underlined by Harvey & Jaeger (1993).
The state space model consists of a state equation and an observation equation. The state equation describes the internal dynamics of the model and is formulated as:
t t t
t =G−1α−1+w
α (7)
Whereα is the state vector, t G is the transition matrix and t
( )
w is a zero mean vector tGaussian white noise with diagonal variance-covariance matrix.
The equation of observation links the observed variable Y (here the data series) to the state t
vectorα : t t t t t H Y = α +ε (8) t
ε is the observation disturbance , a zero mean Gaussian white noise with variance σε2, and
which is not correlated to
( )
w . tWe use the local linear trend model which can be formulated as:
t t t t t t t ξ β β η β µ µ + = + + = − − − 1 1 1 (9) t
µ is the unobserved level and β the slope at date t. t
( )
ηt is the level disturbance, a zero mean Gaussian white noise with variance2
η
σ .
( )
ξt is the slope disturbance, a zero mean Gaussian white noise with variance2
ς
( )
ηt and( )
ξt are independent.The
( )
ηt noise drives the trend level whereas the( )
ξt disturbance makes the trend’s slope fluctuate.As to the cycle, it is modelled by two (only for technical reasons) processes,
( )
κt and( )
*t κ : ⎥ ⎦ ⎤ ⎢ ⎣ ⎡ + ⎥ ⎦ ⎤ ⎢ ⎣ ⎡ ⎥ ⎦ ⎤ ⎢ ⎣ ⎡ − = ⎥ ⎦ ⎤ ⎢ ⎣ ⎡ − − * * 1 1 * sin cos sin cos t t t t t t f f f f κ κ γ γ ρ γ γ (10) f is the cycle’s frequency in radians (0 < f < π), r is the damping factor.
( )
κt is a zero mean Gaussian white noise with variance2
κ
σ .
( )
*t
κ is a Gaussian white noise with mean 0 and variance 2*
κ σ . We suppose that 2 2* κ κ σ σ = .
( )
κt and( )
* t κ are independent.In these conditions, the state equation is written:
⎥ ⎥ ⎥ ⎥ ⎦ ⎤ ⎢ ⎢ ⎢ ⎢ ⎣ ⎡ + ⎥ ⎥ ⎥ ⎥ ⎦ ⎤ ⎢ ⎢ ⎢ ⎢ ⎣ ⎡ ⎥ ⎥ ⎥ ⎥ ⎦ ⎤ ⎢ ⎢ ⎢ ⎢ ⎣ ⎡ − = ⎥ ⎥ ⎥ ⎥ ⎦ ⎤ ⎢ ⎢ ⎢ ⎢ ⎣ ⎡ = − − − − * * 1 1 1 1 * 0 0 sin cos sin cos 0 0 0 0 1 0 0 0 1 1 t t t t t t t t t t t t t f f f f κ κ ξ η γ γ β µ ρ ρ ρ ρ γ γ β µ α (11)
The transition matrix is as follows:
⎥ ⎥ ⎥ ⎥ ⎦ ⎤ ⎢ ⎢ ⎢ ⎢ ⎣ ⎡ − = f f f f Gt cos sin 0 0 sin cos 0 0 0 0 1 0 0 0 1 1 ρ ρ ρ ρ
The observation equation links the unobservable components of the series to the values of the observed series and is written:
[
]
t tt
Y = 1 0 1 0α +ε (12)
The observation equation translates the series’ decomposition into trend, cyclical and irregular components.
The model’s set of parameters written ( , , 2, 2, 2, 2)
ε κ ξ η σ σ σ σ ρ f = Θ is estimated by the
∑
∑
= = − − − = Θ N t t t N t t F V F N L 1 2 1 2 1 ln 2 1 ) 2 ln( 2 ) ( ln π (13)and is calculated recursively using Kalman filtering.
t
V is the prediction error at date t and F is the corresponding variance. The data number is N. t
Variables V and t F are calculated recursively by the filter. t
Once the parameters are estimated, the Kalman filter allows the recursive calculation of the trend, cyclical and irregular components at a given date and from data known up to this date. It is then possible to smooth these components at a given date by relying on the whole data set. This is the method we use to characterize the temporal evolution of these components.
2.2. Cycles, trends and breaks in the evolution of genuine saving
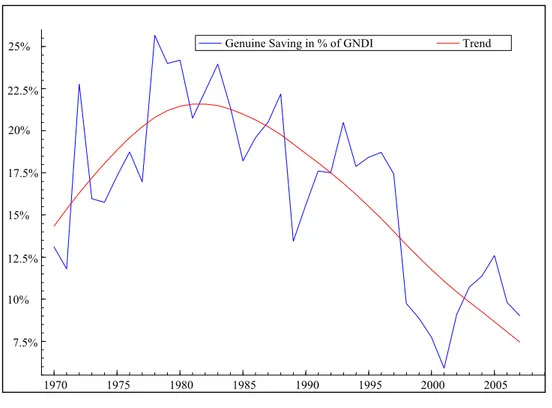
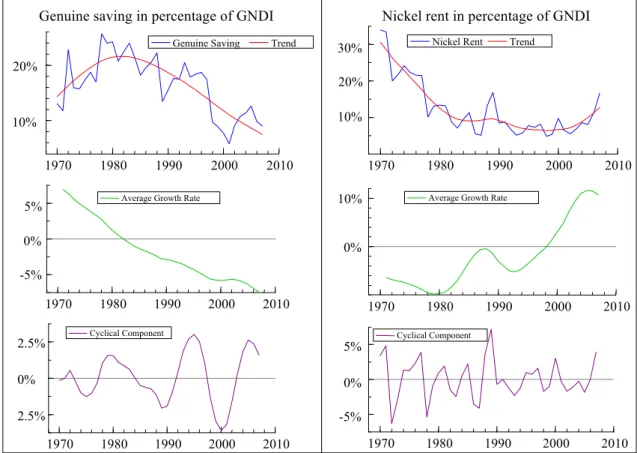
The decomposition of the genuine saving rate’s evolution into trend and cycle, and the research of structural breaks allow one to refine this instability according to short and medium-term horizons. The evolution of New-Caledonian genuine saving rate and its trend are shown on Figure 39.
Figure 3: Evolution and trend of the genuine saving rate (% of GNDI, 1970-2007)
Source: authors’ calculations
9 Decomposition obtained using Kalman filter with the following parameters. Trend: fixed level, stochastic
slope. Cyclical component: long stochastic cycle (11.85 years). Irregular component considered.
1970 1975 1980 1985 1990 1995 2000 2005 25% 22.5% 20% 17.5% 15% 12.5% 10% 7.5%
The slope of the genuine saving rate’s trend changes sign between the beginning (1970-1981) and the end (1982-2007) of the period. During the latter, the genuine saving rate clearly follows a decreasing trend.
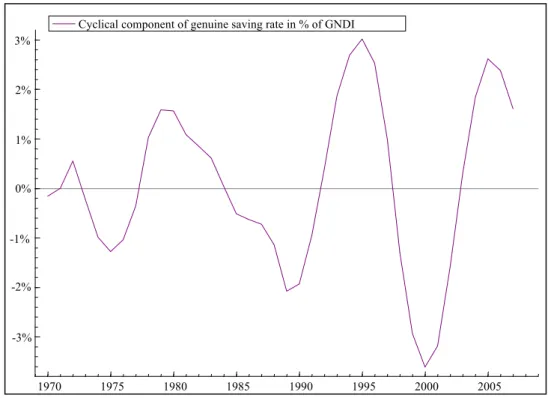
Around this trend, the cyclical and irregular fluctuations are very significant over the whole period. Three about twelve year-long cycles can be identified. They are characterized by deterioration over time which shows a growing amplitude degree (Figure 4). These findings cover a worrying dynamic of New-Caledonian economy and prompt one to inquire whether this dynamic refers to a decrease in the “resilience” ability of the said economy, which wouldn’t be able to absorb shocks anymore.
Figure 4: Cyclical component of genuine saving rate (% of GNDI, 1970-2007)
Source: authors’ calculations
The genuine saving rate also shows high medium-term instability, as is confirmed by the presence of structural breaks. This medium-term instability is particularly explained by the economy’s high degree of dependence on nickel. Indeed, the evolution of genuine saving rate reveals three significant statistical breaks (Table 1) which coincide with breaks in the evolution of the nickel rent.
1970 1975 1980 1985 1990 1995 2000 2005 3% 2% 1% 0% -1% -2% -3%
Table 1: Dates of structural breaks in the evolution of genuine saving and nickel rent (1970-2007)
Genuine Saving Rate Nickel Rent 1972 (0,0090) 1972 (0,0035) 1978 (0,0097) 1978 (0,0006) 1989 (0,0232) 1988 (0,0207)
Source: authors’ calculations10
1972 refers to the mining aftershock analysed as constituting the point of departure of the creation of a transfer economy (Freyss, 1995). As to the break witnessed in 1978, it corresponds to a downward shock on nickel extraction volumes. From this date, the genuine saving rate reaches a climax: the natural resource is then deteriorated faster than the net saving grows. The third break date is linked to an upward shock on international nickel exchange rate (+182% between 1987 and 1988), which explains the genuine saving rate’s important decrease the same year (more than 8 GNDI points).
The part played by the nickel extraction and transformation rent in the instability which characterizes New-Caledonian genuine saving’s trajectory thus seem to be central. This result is not surprising insofar as, on the one hand, this variable constitutes one of the main components of genuine saving rate, and on the other hand, its evolution is highly sensitive to the volatility of nickel price. It prompts one to inquire into the vulnerability of New-Caledonian economy.
3. Evaluation of the vulnerability of the new-caledonian economy
Vulnerability is analysed through the negative effects of shocks upon the trajectory of genuine saving. The decomposition of the fluctuations of genuine saving and its components into trends and cycles allows the New-Caledonian development trajectory’s sensitivity degree to the nickel sector to be specified (3.1). This decomposition particularly enables the detection of thresholds from which nickel rents disruptions can challenge the sustainability of the New-Caledonian development trajectory (3.2.).3.1. Sensitivity of genuine saving to the nickel sector
In accordance with the method used to analyse the genuine saving rate, we apply a Kalman filter to the nickel rent data series stated in percentage of the gross national disposable income in order to compare the trend and the cyclical component to those of the genuine saving rate. However, caution is required regarding what can be learned from such a comparison. Indeed, the genuine saving rate is an accounting indicator which doesn’t allow the consideration of retroaction effects between the different variables it consists of. Thus, though nickel extraction contributes to the deterioration of natural capital and so has a negative impact on genuine saving, it also results in exportations that feed growth and thus net saving. Keeping these reservations in mind it is however possible to put forward a few observations by
10 Authors’ calculations from auxiliary residues. P-values are in brackets. The Kalman filter used for the
distinguishing between phases when the two variables seem to evolve concurrently and phases when they don’t (Figure 5).
Figure 5: Comparison of the genuine saving rate and nickel rent (% of GNDI), 1970-2007
Source: authors’ calculations11.
Thus, the increasing trend of genuine saving rate observed in the beginning of the period happens at a point where nickel rent (in percentage of GNDI) shows a decreasing trend. From 1982 on, the trend evolution of genuine saving rate shows a strong decrease despite a slight decrease then quasi-stability of the nickel rent trend. Only after 2000 do we find a negative relationship between the two trends: the growth of nickel rent, particularly induced by the nickel price increase, follows the trend decrease of the genuine saving rate. The relationship between genuine saving and nickel rent thus doesn’t seem linear and asserts the existence of thresholds.
The estimation of nickel rent’s cyclical component, on the other hand, shows cycles of much higher amplitude (4% of GNDI against 2.21%) and shorter duration than those observed for genuine saving rate (5 years against 12). Indeed, the estimate confirms for nickel rent (based on GNDI) an average cycle duration on the whole period of about 4 and a half years. Genuine saving rate cycles are thus characterized by a lesser amplitude and a longer average duration than those observed for nickel rent. This result prompts one to think that the other components
11 Trend and cycle calculated from a Kalman filter with fixed level and stochastic slope.
1970 1980 1990 2000 2010
Genuine saving in percentage of GNDI
20%
10%
Genuine Saving Trend
1970 1980 1990 2000 2010
Nickel rent in percentage of GNDI
30% 20% 10%
Nickel Rent Trend
1970 1980 1990 2000 2010 5%
0% -5%
0%
Average Growth Rate
1970 1980 1990 2000 2010 10% Average Growth Rate
1970 1980 1990 2000 2010 2.5% 0% 2.5% Cyclical Component 1970 1980 1990 2000 2010 -5% 0% 5% Cyclical Component
of genuine saving also play a part in the New-Caledonian development trajectory’s sustainability by absorbing part of the nickel sector shocks.
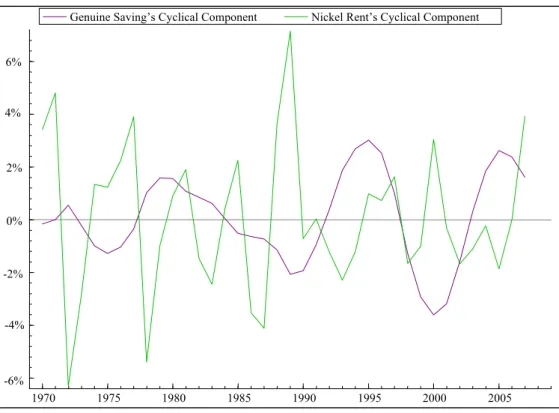
Figure 6, superimposing the cyclical components of genuine saving and nickel rent, enables further conclusions.
Figure 6: Cyclical components of genuine saving and nickel rent
Source: authors’ calculations12
In the first place, the cyclical evolutions of genuine saving and nickel rent show a “scissor effect”: all else being equal, a positive shock on nickel rent coincides with a negative shock on genuine saving. Secondly, the lesser amplitude and shorter duration of genuine saving cycles compared to those of nickel rent are confirmed. However, after 1992, the amplitude of genuine saving cycles becomes as high as that of nickel rent cycles. This last phenomenon may be interpreted as the strengthening of the synchronisation degree of the cycles followed by the two variables, and as a sign of bigger vulnerability for the New-Caledonian economy showing a decrease in its resilience to nickel sector shocks absorption.
3.2. Threshold effects
In order to get a more precise notion of genuine saving’s vulnerability degree in relation to the nickel sector, we simulate the impact on the genuine saving rate trend of an increase in the deterioration linked to nickel rent. This calculation then enables the deduction of thresholds from which the sustainability of the New-Caledonian development trajectory is challenged.
12 Trend and cycle calculated from a Kalman filter with fixed level and stochastic slope
1970 1975 1980 1985 1990 1995 2000 2005 6% 4% 2% 0% -2% -4% -6%
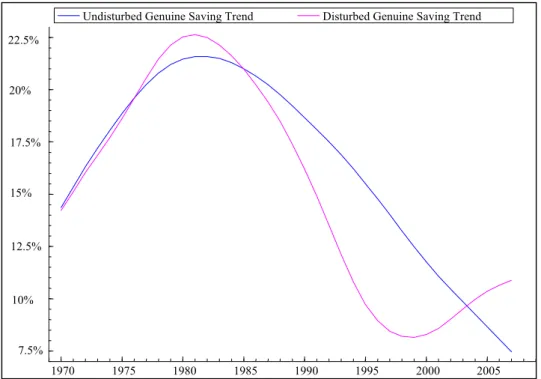
First, the genuine saving rate’s sensitivity to a nickel rent disturbance is estimated via the simulation of an increase (10% of GNDI) of the deterioration linked to nickel rent over the 1993-1997 cycle, a low cycle for the rent level. The impact of such a shock (comparable to that observed in 1989-1990) results in a very significant change in the genuine saving trend. Indeed, it shows a strong deterioration corresponding to a decrease representing up to 6% of GNDI (Figure 7).
Figure 7: simulation of an increase in the nickel rent-linked deterioration corresponding to 10% of GNDI (1970-2007)
Source: authors’ calculation
This result confirms the existence of a New-Caledonian development vulnerability source which is linked to genuine saving rate’s high sensitivity to a disturbance of nickel rent. The genuine saving rate becomes negative from an upward shock equivalent to 18 GNDI points (still on the 1993-1997 cycle). In addition, following this shock, the decomposition into cycles and trends changes substantially and the trend becomes linear (Figure 8).
This constitutes a first non-sustainability threshold, which presupposes a considerable increase of the nickel exchange rate or the extracted volume. Such shock configuration is not excluded at first sight. It is particularly consistent with the threefold increase expected in the metallurgic production in relation to the concurrent functioning of three metallurgical plants starting in 2013. 1970 1975 1980 1985 1990 1995 2000 2005 22.5% 20% 17.5% 15% 12.5% 10% 7.5%
Figure 8: simulation of an increase in the nickel rent-linked deterioration corresponding to 18% of GNDI
Source: authors’ calculations
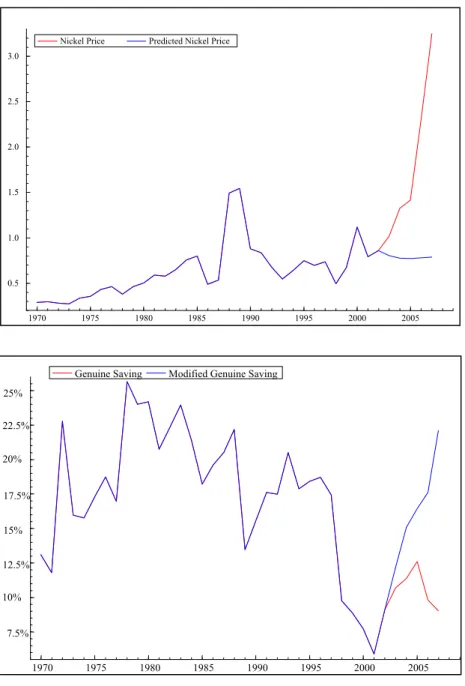
Genuine saving rate’s vulnerability to nickel fluctuations can also be read from a downward nickel exchange rate simulation. Figure 9 thus shows the evolution that genuine saving rate would have followed without the upward shock on nickel exchange rate between 2003 and 2007. To this end, we simulate the values of the nickel exchange rate data series up to 2007 using the Kalman filter and relying on the evolutions recorded for the 1970-2002 period so as to erase the upward shock on nickel exchange rate at the end of this period. Without this shock, genuine saving rate would have known a very significant trend reversal, with a strong increase even higher than 22% of GNDI.
1970 1975 1980 1985 1990 1995 2000 2005 25% 20% 15% 10% 5% 0%
Figure 9: What if the 2003-2007 shock had not existed?
Realized and predicted nickel prices (1970-2007), Simulation of the evolution of realized and predicted genuine saving rate (1970-2007)
Source: authors’ calculations
1970 1975 1980 1985 1990 1995 2000 2005 0.5 1.0 1.5 2.0 2.5 3.0
Nickel Price Predicted Nickel Price
1970 1975 1980 1985 1990 1995 2000 2005 25% 22.5% 20% 17.5% 15% 12.5% 10% 7.5%
Conclusion
The aim of this article was to question the sustainability of the New-Caledonian development trajectory. To this end, we have calculated New-Caledonian genuine saving, in accordance with the approach developed by the World Bank. For New-Caledonia, the calculation of genuine saving allows the assertion that the appreciation of assets linked to physical capital (net savings) and to human capital (education expenditures) has more than compensated the depreciation of assets linked to natural capital between 1970 and 2007. The application of the method developed by the World Bank results in a high genuine saving rate, ranging from 5 to 10% of gross national disposable income over the recent period. Such an observation supports the idea that the New-Caledonian economy doesn’t show vulnerability signs insofar as the growth of future consumption doesn’t seem to be jeopardized.
However, the analysis using a Kalman filter of the various components of the genuine saving trajectory leads to results that challenge that trajectory’s sustainability. Our results reveal indeed a decreasing trend for genuine saving rate since the early 1980s which is essentially caused by the increase of nickel extraction rents. In addition, the presence of structural breaks in the evolution of genuine saving rate coincides with those detected for nickel rent. Finally, the cyclical component of the genuine saving rate is characterized by a growing intensity over time which follows the lines of a higher degree of synchronisation with the cycles recorded by the nickel sector. The analysis of genuine saving’s historical trajectory thus reveals a vulnerability of the New-Caledonian economy which results in the existence of threshold effects in the nickel sector activity; thresholds from which the sustainability of the New-Caledonian development trajectory may be challenged.
References
Bolt K., Matete M., Clemens M., 2002. Manual for calculating adjusted net savings, World Bank, Washington D.C., 23 p.
Brelaud C., Couharde C., Géronimi V., Maître d’Hôtel E., Radja K., Schembri P., Taranco A., 2009. Capital naturel et développement durable en Nouvelle-Calédonie : Etude 1, Mesures de la richesse totale et soutenabilité du développement de la Nouvelle-Calédonie,
Document de travail n° 82, Agence Française de Développement, Paris, 78 p.
CEROM, 2008. Les défis de la croissance calédonienne, Agence Française de Développement-Institut national de la Statistique et des Etudes Economiques-Institut d’Emission d’Outre-Mer, Nouméa, 60 p.
D’Autume A., Schubert K., 2008. Le concept d’épargne véritable est-il adapté pour mesurer la durabilité du développement économique ?, 12ème Colloque de l'Association de
Comptabilité Nationale, Paris, 4-6 juin, 23 p.
Fankhauser S., 1994. The social costs of greenhouse gas emissions: an expected value approach, Energy Journal, 15(2), 157-184.
Freyss J., 1995. Economie assistée et changement social en Nouvelle-Calédonie, Presses Universitaires de France, Paris, 452 p.
Guillaumont P., 2006. La vulnérabilité macroéconomique des pays à faible revenu et les réponses de l’aide, Revue d’économie du développement, 4(20), 21-77.
Hamilton K., 1994. Green adjustments to GDP, Resources Policy, 20(3), 155-168.
Hamilton K., 2000. Genuine saving as a sustainability indicator, Environment Department
Paper n° 77, World Bank, Washington D.C., 15 p.
Hamilton K., Clemens M., 1999. Genuine savings rates in developing countries, World Bank
Economic Review, 13(2), 333-356.
Hartwick J. M., 1977. Intergenerational equity and the investing of rents from exhaustible resources, American Economic Review, 67(5), 972-974.
Harvey A. C., 1989. Forecasting Structural Time Series and the Kalman Filter, Cambridge-New York University Press, 554 p.
Harvey A. C., Jaeger A., 1993. Detrending, stylized facts and the business cycle, Journal of
Applied Econometrics, 8(3), 231-247.
Harvey A. C., Koopman S. J., 1992. Diagnostic checking of unobserved-components time series models, Journal of Business and Economic Statistics, 10(4), 377-389.
Pearce D. W., Atkinson G. D., 1993. Capital theory and the measurement of sustainable development: an indicator of “weak” sustainability, Ecological Economics, 8(2), 103-108. Solow R., 1986. On the intergenerational allocation of natural resources, Scandinavian
Journal of Economics, 88(1), 141-149.
Solow R., 1993. Sustainability: an economist’s perspective, in: Dorfman R. and Dorfman N. S. (eds), Economics of the environment : selected readings, Norton, London-New York, 179-187.
World Bank, 2006. International experiences with environmental and economic accounting, State Environmental Protection Administration, World Bank, Washington D.C., 48 p.
World Bank, 2007. Adjusted Net Savings data center [online], World Bank, Washington D.C. URL : http://go.worldbank.org/3AWKN2ZOY0.
World Bank, 2008. World Development Indicators database [CD-ROM], World Bank, Washington D.C.
Appendix
Table A. Origin of the data used to evaluate Caledonian genuine saving13
Data Directly obtained Reconstructed Gross Domestic Product ISEE (1970-2007)
Balance of Incomes and Transfers Institut d’Emission d’Outre Mer (IEOM), 1998-2007
Institut des Statistiques et des Etudes Economiques (ISEE),
1970-1997 : Public transfers Gross Saving Institut des Statistiques et des
Etudes Economiques (ISEE), 1970-1998
Institut des Statistiques et des Etudes Economiques (ISEE),
1999-2007 : final consumption of households and government Fixed Capital Depreciation World Bank, 1970-2007
Public Education Expenditures Institut des Statistiques et des Etudes Economiques (ISEE),
2000-2005
Institut des Statistiques et des Etudes Economiques (ISEE),
1970-1999 ; 2006-2007 : school populations, average costs, public
accounts Nickel quantities and prices Institut des Statistiques et des
Etudes Economiques (ISEE), 1970-2007
Nickel costs (or rent rate) World Bank, 1970-2007 Timber quantities, prices, costs (or
rent rate)
Direction du Développement Rural (DDR), 1970-2007 Greenhouse gas emitted quantities World Bank (1970-2004)
Direction des Mines et de l’Energie de la Nouvelle-Calédonie
(DIMENC), 2005-2007
Gross National Disposable Income (GNDI) is an aggregate of primary incomes received by resident units, to which is added the balance of transfers between residents and non-residents. It measures the value residents dispose of for actual final consumption and savings. GNDI is addition of Gross Domestic Product and of the net balance of primary incomes and current transfers with the rest of the world. GNDI is different from Gross National Income (GNI) as it amends the latter with the balance of transfers (GNDI = GNI + incoming transfers – outgoing transfers).
The transition from GDP to GNDI consists of operations appearing in the external account of primary incomes and current transfers between resident and non-resident units (current income and capital taxes, social contributions, and other current transfers).
The ISEE has data series concerning the Gross Domestic Product since the 1970s. However, the data regarding the balance of payments exist only from 1998 on. Before 1998, we have no other choice but to approximate the balances of primary incomes and current transfers. Given the particular status of overseas territory, these balances are mainly explained by public transfers coming from metropolitan France. Indeed, the analysis for the 1998-2007 period shows that the balances of primary incomes and current transfers represent on average 74% of public transfers. We thus applied this ratio to public transfers for the 1970-1997 period in order to approximate the net flows of primary incomes and current transfers over the same period. We then use the growth rates of these approximated flows to reconstruct level data series which are compatible with the 1998-2007 series.
13 ISEE: Institute of Statistics and Economic Studies; IEOM: Overseas Issuing Institute; DDR: Rural
