Development of MIT Geospatial Data to CityGML Workflows
by
Bradley Wu
B.S. Electrical Engineering and Computer Science
Massachusetts Institute of Technology, 2011
Submitted to the Department of Electrical Engineering and Computer
Science in partial fulfillment of the requirements for the degree of
Master of Engineering in Electrical Engineering and Computer Science
at the
MASSACHUSETTS INSTITUTE OF TECHNOLOGY
June 2014
MA SSACHUSETTS INSTITTE
F TECHNOLOGy
JUL 15 201
LIBRARIES
2014 Massachusetts Institute of Technology. All rights reserved.
Signature redacted
Department of Electrical Engineering and Computer Science
May 23, 2014
Signature redacted
Certified by:
Mandayam A. Srinivasan
Senior Research Scientist, Mechanical Engineering
Signature redacted
Thesis Supervisor
Accepted by:
Albert R. Meyer
Chairman, Masters of Engineering Thesis Committee
Author:
Development of MIT Geospatial Data to CityGML Workflow
by
Bradley Wu
Submitted to the Department of Electrical Engineering and Computer Science on May 23, 2014, in partial fulfillment of the requirements for
the degree of Master of Engineering in Computer Science and Engineering
Abstract
BlindAid is a virtual environment system that helps blind people learn in advance about places they plan to visit. A core component of the BlindAid system is the actual set of virtual models that represent physical locations. In order for BlindAid to be useful, there must be a means to generate new virtual environments. The research in this thesis explores the process of translating geospatial data received from MIT into the CityGML data format, which will then be used to generate virtual environments for BlindAid. We discuss the main challenge of preserving both geometry and semantic information with respect to different data formats. We also identify several initial workflows for geospatial data obtained from the
Massachusetts Institute of Technology Department of Facilities, including Sketchup,
GIS Shapefile, and Industry Foundation Class models. These workflows serve as a
foundation that we can build upon to bring in a variety of geospatial data to BlindAid in the future.
Thesis Supervisor: Mandayam A. Srinivasan
Acknowledgements
I would like to thank a number of individuals, without whom this thesis project would not have been possible. First and foremost I want to thank my immediate supervisor, David Schloerb for his constant guidance and support in my research. Thank you for providing such an interesting topic and for being part of all our insightful discussions. It has truly been a memorable experience working with you this past year. I would also like to thank my thesis supervisor, Dr. Mandayam A. Srinivasan, for making the entire project possible.
I would also like to give huge thanks to Michael Parkin for taking the time to explain
and provide the geospatial data of MIT that was instrumental for this thesis. Thank you to Leon von Berlo for pointing me in the right direction with his feedback, knowledge, and suggestions regarding IFC and CityGML data; and to Irene Chen, for always being there for me with love and encouragement. Lastly, I would like to thank my family for their unending support and care throughout my time at MIT and my work on this thesis.
Contents
1
Introdu ction
...
7
2 B ackgrou n d
...
9
2.1 B lin dA id
...
9
2.2 3D City D ata
...
12
2.3 D ata Form ats
...
12
2.3.1 G IS and Shapefiles
...
12
2.3.2 B IM an d IFC
...
14
2.3.3 CityG M L
...
16
2.4 D ata Sources
...
17
2.4 .1 O penStreetM ap
...
18
2.4 .2 G oogle Earth
...
19
2.4.3 Karlsruhe Institute of Technology (KIT)
...
21
2.4.4 Massachusetts Institute of Technology (MIT)
...
22
3 M IT D ata
...
23
3.1 Interior D ata
...
24
3.2 Exterior D ata
...
26
4 Soft w are T ools
...
28
4 .1 B IM Server
...
28
4 .2 A rch iCA D
...
29
4 .3 Sketch U p
...
30
4.4 LandXplorer CityGML View er
...
30
4 .5 Esri A rcM ap
...
31
5 Interior D ata W orkfl ow
...
32
5.1 AutoCAD Drawing W orkflow
...
32
5.2 IFC W orkfl ow
...
34
5.3 Sh ap efi le W orkfl ow
...
39
5.4 R esults an d D iscussion
...
4 2
6 Exterior D ata W orkfl ow
...
4 3
6 .1 Sk etch U p W orkfl ow
...
4 3
6.2 G IS D ata W orkfl ow
...
4 5
7 Con clusions ...
4 7
R eferen ces ...
4 8
Appendix A: Geospatial Data Software...
51
Appendix B: Detailed CityGML Workflow Procedures...52
B.1 IFC to CityGML ...
52
B.2 Shapefile to CityGML...55
B.3 SketchUp to CityGML ...
58
Appendix C: Program Code ...
60
C.1 Reading IFC into Memory ...
60
C.2 Determining IFC Object Hierarchy...61
C.3 Parsing IfcSpace Semantic Information...
62
C.4 Retrieving IfcSpace Geometry Information ...
63
C.5 Approximation of IfcDoor and IfcSpace Locations ... 64
C.6 IFC Preprocessing Logic ...
65
1
Introduction
In this thesis, we investigated converting geospatial data obtained from the
Massachusetts Institute of Technology (MIT) Department of Facilities into the City
Geography Markup Language (CityGML) data format. The work is part of the
ongoing development of BlindAid, a desktop virtual environment system that is intended to enable people who are blind to learn in advance about places they plan to visit. Specifically, this thesis project had two goals. First was to help create virtual environments of the MIT campus (i.e. three dimensional, 3D, spatial models of MIT that a BlindAid user would explore to learn about the campus), as needed for
planned experiments to evaluate the BlindAid system. The second goal was to begin the development of methods to import geospatial data in the future. Indeed, the primary motivation for this thesis was the fact that, even if the BlindAid system is shown to be useful through our experiments, no one will ever use it without access to a comprehensive set of geospatial data.
MIT's Department of Facilities was selected as the source of the data because they possessed the geospatial data we needed for our experiments, and it was available to us as part of the MIT community. Just as importantly, however, the Department of Facilities maintains geospatial data of the campus and surrounding community with a sophistication level at the forefront of current spatial data initiatives. Frankly, there were no alternative sources available to us with the kind of 3D spatial and semantic information needed for the future BlindAid system we envisioned.
generally not available at this time, there is rapid advancement in this area, which
we will discuss in Chapter 2, and our strategy is to develop the BlindAid system in
parallel so that it will be ready when the data becomes available. In line with this
strategy, CityGML was selected as the most promising future format for BlindAid
files.
To meet these goals, our plan was to develop workflows for importing the MIT data
into CityGML. The workflow concept involves converting the data in manual steps
using various software tools. Although time-intensive, this approach is adequate for
the purpose of creating the small number of VEs needed for our experiments and
better suited to development than a fully automated approach. Furthermore, if
2 Background
2.1 BlindAid
Navigating an unknown environment can be unpleasant, uncomfortable, and often unsafe for someone who is visually impaired. First developed in 2006, BlindAid is a system designed to help alleviate that burden, serving as a tool that enables learning about an unfamiliar place through virtual exploration (Lahav, Schloerb, Kumar, & Srinivasan, 2008).
The most common tools and techniques to learn about someplace new typically involve a sighted friend verbally describing a space or route. They may also include physically taking a person there, creating a tactile map, or building a physical replica of the target environment. However, physical models are not often available and expensive to make. Once obtained, they also must be periodically updated to keep up with construction or other changes to the real life environment
The BlindAid system currently reads in manually constructed virtual environments (VEs) made by translating AutoCAD floorplan drawings into a set of walls in a BlindAid-readable text file. While a computer aided design (CAD) program can offer some initial editing and feature creation, the current workflow ultimately requires additional manual editing of the text files themselves to clean up the walls and add other types of objects to the BlindAid environment before use. Users interact with the virtual environment using a Geomagic Touch X haptic device - formerly
the device as a Phantom in this thesis because it is the nomenclature that has been
used in the Touch Lab for many years. In BlindAid, a user interacts with the virtual
environment using the Phantom haptic device, which functions similarly to a
miniature virtual white cane. BlindAid detects and records the user's movement
within the virtual environment and gives tactile and audio feedback. If the user
touches a virtual door, for example, the Phantom stylus pushes back and the
system's computer plays a short sound to indicate that a door is there. If the user
pushes against the door, the Phantom stylus will put up partial or total resistance to
further movement depending on if the door was public (unlocked) or private
(locked), respectively. With enough pressure, the user can push through a public
door and proceed to a room behind it.
Figure 1. Photograph of the BlindAid system in use. The user interacts with the system using a Geomagic Touch X haptic device and computer keyboard.
The computer's keyboard is also an important part of the BlindAid interface. While users operate the Phantom with one hand, the other hand is typically in control of a few special keys on a keyboard. The keyboard gives users the ability to zoom in and out as well as request more detail about objects they are touching (Schloerb, Lahav,
Desloge, & Srinivasan, 2010). The full capabilities of the keyboard interface are still being explored, and there is continuing research investigating which keyboard
interface controls are most beneficial to visually impaired users. New types of haptic
and audio virtual tools are also being developed to aid users in their exploration of the VE.
One of the most important aspects of BlindAid is for the user to be able to easily interact with the virtual environment. When the user enters a building, the system should know the building's identity. The shape of the building should be accurate enough for the user to get a sense of the geometry of the room or building. If a user touches a virtual object, the system should be able to provide a description of that object if prompted by the user. The user should be able to differentiate between different objects - for instance, be able to distinguish a door from a wall. A key goal investigated by this thesis is, therefore, to discover an effective workflow capable of delivering geometric and semantic information from external sources into the BlindAid system. Additionally, the BlindAid VEs have previously been 2D, but we now plan to extend them to fuller 3D representations. Thus to be more specific, our workflow must support the importing of 3D geospatial data.
2.2 3D City Data
3D city models have garnered more and more attention as urban planning initiatives
respond to widespread population growth and urbanization in many countries. This
growth imparts an increasing burden to update city infrastructure and provide the
resources for proper maintenance. Technology has long assisted in the design,
administration, and management of cities. 2D maps have been used for centuries to
visualize landscape and the development of Geographical Information Systems (GIS)
has allowed existing city information to be enhanced with metadata such as
population densities and regional statistics for improved analysis (Podevyn, 2012).
Computer aided design (CAD) has been an effective resource for spatial analysis and
evaluating new developments. Advances in 3D computer based designs result in 3D
city models being now "adopted not merely to improve production or construction
processes, but to visualise the end results" (Ibid.).
2.3 Data Formats
While there are many different geospatial data formats, much progress has been
made towards the standardization of city model data. This project focused on three
standard formats, GIS Shapefiles, BIM/IFC, and CityGML, which we will now discuss.
2.3.1 GIS and Shapefiles
GIS stands for Geographic Information System, and it is a computer system designed
any information system that provides spatial data entry, management, retrieval, analysis, and visualization functions. Users interact with GIS data through GIS applications that serve as tools to create and edit data as well as analyze spatial information (Maliene, Grigonis, Palevicius, & Griffiths, 2011). GIS data represents various real-world objects (e.g. roads, trees, etc.) using points, lines, and polygons.
The GIS data we worked with came in the form of Shapefiles, a popular vector data format for GIS. This data format is developed and regulated by Esri, a company originally founded as the Environmental Systems Research Institute, as an open data interoperability specification between Esri and other GIS software (Esri, 1998). The shapefiles themselves store points, lines, and polygons as their primitive geographic data types, and can use them to represent almost any geographical feature.
Furthermore, each object described in the shapefile can have attributes that describe semantic characteristics such as name and description fields. Shapefiles also work hand in hand with Esri's geodatabase, which stores spatial data in a centralized location and is able to apply sophisticated rules and relationships to the data (Esri, 2014). Together, a set of shapefiles and an associated geodatabase offer a powerful representation of geospatial data.
However, shapefiles do have limitations in that they cannot describe topographical information such as surface contours or 3D geometry. In addition, all polygons and polylines are composed of points. This means smooth curves such as objects with circle geometries will have a jagged representation unless a large number of points are used to represent them, in which case the polygon representation will require
much more data storage space. Nevertheless, shapefiles offer a very flexible data
format that can be used to represent geographic objects and associate semantic
attributes to them. The topographical limitation to represent 3D objects can also be
overcome by using a layering technique, as we discuss in Chapter 5.
2.3.2 BIM and IFC
Building Information Modeling (BIM) is defined by the National Building
Information Model Standard Project Committee as "a digital representation of
physical and functional characteristics of a facility" (National Building Information
Model Standard Project Committee, 2014). The concept of BIM has been around
since the 1970s and is now serviced by applications such as Graphisoft's ArchiCAD
and AutoDesk's Revit software (Eastman et al., 2011). BIM extends the traditional
building design of 2D drawings and floor plans to a 3D model that includes not just
geometry but also spatial relationships, geographic information, building
component properties, and more.
BIM is often associated with Industry Foundation Classes (IFCs), an open
specification of BIM developed by buildingSMART (Liebich et al., 2007). The IFC
data model is an entity-relationship model in which hundreds of entities are
organized into an object-based inheritance hierarchy. Examples of entities include
building elements such as IfcDoor objects and basic constructs such as
IfcCartesianPoint objects. Each entity either has its own concept of identity, with
attributes for name and description, or is referenced by another entity that does.
classifications - IfcObjectDefinition, IfcRelationship, or IfcPropertyDefinition.
An IfcObject typically defines a physical feature such as a wall or a door. Its
IfcObjectDefinition will contain details about its identity (name and description),
physical dimensions, and location.
IfcRelationship captures the relationship among different objects. It is responsible
for tying certain objects together in the overall IFC hierarchy. One example of its usage is having an IfcRelAggregates object link all of the IfcDoor objects of a single building floor together. In this case, IfcRelAggregates first defines the common aggregate characteristic (floor number), and then it includes all IfcDoor objects that share this characteristic in its object definition.
Finally the IfcPropertyDefinition captures the general set of properties that may be used to describe a certain feature. For example, an IfcSpace object representing a room in a building is described by its room name, room number, room type, room size, building location, etc. In the IFC file, each of these properties is listed as a separate IfcPropertySingleValue object that includes the property name, property value, and the object that this property is associated with (Liebich et al., 2007).
An IFC data model is able to provide a semantically rich description of a building. It is often used as an architectural blueprint when designing buildings as it has the capacity for accurate geometry and semantic detail. As part of this thesis project, we initially used IFC data provided by MIT as the primary data source of interior data because, compared to other sources, it provided the most comprehensive
information.
2.3.3 CityGML
In this project, we selected the CityGML specification as the final intermediate
format to be read by BlindAid because it is capable of representing various terrains
and 3D objects in different levels of detail simultaneously, handling simple, single
scale models without topology and few semantic properties as well as very complex
models with full topology and fine-grained semantic details. With this flexibility,
"CityGML enables lossless information exchange between different GI systems and
users" (Open Geospatial Consortium, 2006). It has also become a widely accepted
standard and many initiatives have already adopted CityGML as the model of choice
(Nouvel, Shulte, Eicker, Pietruschka, & Coors, 2013; Kolbe, Nagel, & Stadler, 2009).
CityGML is a common semantic information model for the representation of 3D
urban objects that can be shared over different applications. It is an application
schema of the XML-based Geography Markup Language (GML) built to facilitate the
sharing and exchange of virtual 3D city models. CityGML came about because at the
time, most virtual 3D city models were limited to purely graphical or geometrical
models and neglected semantic and topological information (e.g., doors, stairs,
elevators, etc.).
CityGML identifies relevant objects and features in a city environment and defines
classes and relations for them with respect to their geometrical, topological,
exterior), vegetation, bodies of water, and more. Each city object also contains information about its spatial properties, object hierarchies, aggregations, and additional descriptions, if applicable (Open Geospatial Consortium, 2006).
CityGML's data model fits the needs of BlindAid perfectly. The upcoming BlindAid experiments require a VE that represents a series of indoor and outdoor spaces on the MIT campus, and CityGML is able to represent the needed geometric data and semantic information for a wide range of indoor and outdoor objects. Furthermore, CityGML offers five LoD (Level of Detail) representations that we can use to vary the fidelity of models if need be - for example inside spaces versus outside spaces.
Finally, CityGML is defined as an open semantic model for the representation of 3D urban objects that can be shared over different applications (Open Geospatial Consortium, 2006). Many existing geospatial software applications already support import and export of CityGML from their own native data formats, and we predict the interoperability of CityGML will only increase in the future.
2.4 Data Sources
Many organizations have made efforts to provide virtual maps of cities around the world including public, private, government, and academic institutions. Each data source may offer different data formats, scopes, and details. We will now go over the geospatial data sources we considered for the BlindAid project.
2.4.1 OpenStreetMap
OpenStreetMap (OSM) is a collaborative global mapping project started in the UK in
2004 by Steve Coast whose goal is to create a free editable map of the world. From
its website, "OpenStreetMap is an open initiative to create and provide free map data to anyone who wants them" (OpenStreetMap, 2014).
OSM collects data freely given from its geographically diverse user base. Many of the
early contributors were cyclists surveying the land for cycling routes and bicycle
trails (Allan, 2014). Now, software tools such as the ArcGIS Editor for OSM enable
various GIS professionals to contribute geospatial data (Vines, 2010). The raw data
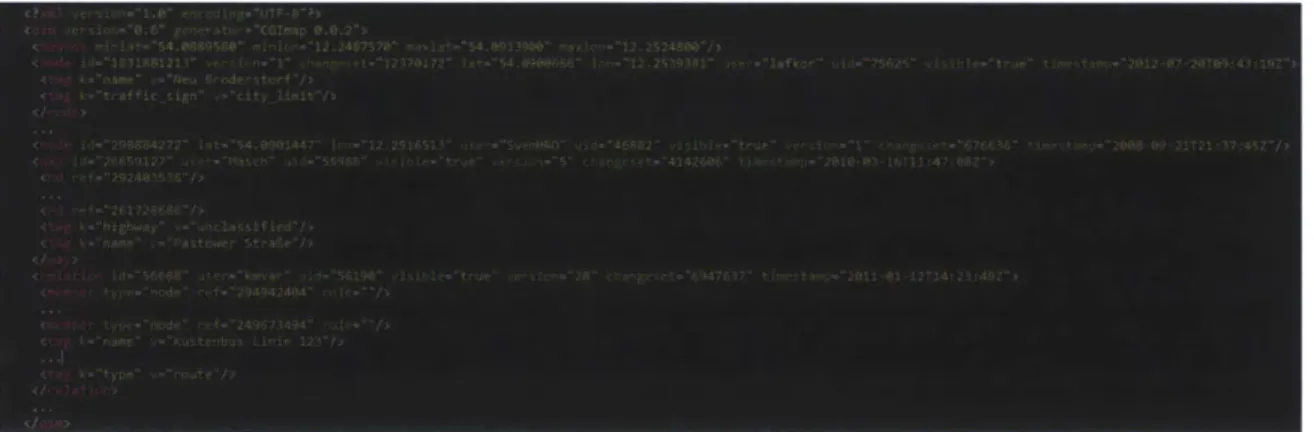
format of OSM is primarily XML, as shown in Figure 2, but there exist editors such as
JOSM that allow users to directly upload collected data to the OSM database ("JOSM",
2014).
Figure 2. Snippet of OSM XML, the raw data format of OpenStreetMap data.
OSM uses a topological data structure that consists of four core elements - Nodes,
Ways, Relations, and Tags. A Node is a geographic point defined by its longitude and
general structure that describes the relationship between two or more data elements. Finally, a Tag can be attached to all data elements and it describes the meaning of the particular element to which it is attached (OpenStreetMap, 2014). When put together, these four core elements are able to describe the many features
of the world. The entirety of OSM data is stored in an OSM geospatial database and can be downloaded in a single large (over 400GB uncompressed, 29GB compressed)
OSM XML file, Planet.osm.
In the past few years, OpenStreetMap has experienced a massive growth in its user base. Having had only 100,000 registered users in January 2009, OpenStreetMap broke 1 million registered users in January 2013 and now has nearly 1.6 million users (OpenStreetMap Wiki, 2014). OpenStreetMap is now well established in the geospatial data community with several commercial users including Craigslist,
Foursquare, and Apple, Inc. (Cooper, 2012).
While OSM data is currently 2D - limited for our approach - the third dimension is a growing topic within the organization. As the 3D initiatives of OSM continue, it is likely that BlindAid will be able to obtain suitable data from OSM for much of the world in the future.
2.4.2 Google Earth
Google Earth is a proprietary database with software capable of visually portraying map and geographical information on a virtual globe. Google Earth was acquired by Google in 2004 from Keyhole, Inc, and is now used for many day-to-day and other
purposes pertaining to viewing various locations on the earth. Figure 3 shows a sample screenshot taken from Google's KML tutorial of what a user might see when looking at the 3D model of a building and its surroundings.
Figure 3. Geometric building data seen through Google Earth software (KML Tutorial, 2014).
Google Earth's data is structured in KML (Keyhole Markup Language), which is an XML based notation used to express geographic features. An example snippet of KML is shown in Figure 4. Each feature specified in a KML file is associated with a longitude and latitude that give an absolute position in the global space. KML also supports the inclusion of ground overlays, paths, and polygons that can be used to illustrate various features or "drape" an image over the Earth's terrain (Google Developers, 2014).
Figure 4. Snippet of KML, the raw data format of Google Earth data.
Unlike OSM data, KML does not provide any true model information other than each
feature's position in the world. As a result, we would be unable to generate a 3D
geometric model of city features using just KML and data from Google Earth. On the
other hand, being based on the versatile and ubiquitous XML format means many
existing applications are capable of importing and exporting KML. This could be
advantageous for us if we ever need to import supplemental data that are available,
such as Points of Interests (POI), from various sources. Unfortunately, until Google
opens access to Google Earth's underlying 3D model to the public, its potential value
to the BlindAid project is very limited.
2.4.3 Karlsruhe Institute of Technology (KIT)
KIT has conducted some of the leading research on semantic data models - most notably for this project, IFC and CityGML. The IFCExplorer is an ongoing project to
build an application that allows a user to seamlessly view and manipulate IFC and
CityGML data. Currently, their software is still undergoing research and
provides viewing-only functionality ("Semantic Data Models", 2014).
2.4.4 Massachusetts Institute of Technology (MIT)
As discussed in Chapter 1, MIT's Department of Facilities was the source of the geospatial data that we used in this thesis project for various reasons. MIT
maintains this data to manage construction and maintenance projects as well as for general space planning and for logistics related to major events on campus. In support of our project, they graciously provided us with data for the MIT campus and the surrounding area in IFC, SketchUp, AutoCAD, and GIS Shapefile formats. While the provided data was not comprehensive of all MIT buildings and spaces in order to keep the set of files to a manageable size, it was more than adequate for our workflow development and, perhaps, for the future experiments as well. From this data, various other data formats can be generated using different commercial software such as the Esri GIS mapping software.
The remainder of the thesis focuses on the MIT data and the development of workflows to CityGML.
3 MIT Data
The MIT Department of Facilities geospatial data includes building floor plans, 3D architectural models, pedestrian traffic paths, and much more. This data is derived from architects, independent contractors, internal space surveying initiatives, and other sources. The data may be classified into two types: interior and exterior. Interior building data describes the spaces inside MIT buildings and would be used in BlindAid to map out and render the inside of a building. The complete data set includes both geometric and semantic details for all interior features such as doors, walls, rooms, hallways, stairs, etc. Similarly, the exterior data describes the outdoor spaces surrounding MIT buildings including features such as roads, sidewalks, benches, bike ramps, and much more.
Due to the natural interior/exterior division of the data, we chose to create two workflows to CityGML, one for each type. While not as streamlined as if we had received all the geospatial data (interior & exterior) together in one large file, this approach offers the advantage of having smaller modular pieces of data to work with. It also influenced the future development of the BlindAid system by causing us to realize that a user exploring a VE can only be in one location at a time. Hence, it is not necessary to render both inside and outside spaces at the same time, leading to better efficiency for the system. Indeed, the inside and outside VE models can be almost entirely independent provided the transition points (doors) match and any differences in the boundary geometry does not lead to misunderstanding by the
3.1 Interior Data
The interior data we received from MIT included building models and architectural
plans at various levels of detail for the entire campus. The building data was
provided in GIS Shapefile (SHP), AutoCAD Drawing (DWG), and IFC formats. Of these
formats, only IFC files contained 3D geometry data so they appeared to be the most
promising files to be converted to CityGML. Figure 5 shows an IFC file of an MIT
building displayed in ArchiCAD, showing its potential to generate the geometry for virtual 3D models a user could explore.
I
Figure 5. An IFC data model of MIT Building 26, floor 1 rendered in ArchiCAD.
The IFC files provided rich semantic information that described various building
object details such as room number, room type, room dimensions, etc.
from the geometry of different building features. Before importing the IFC data to
BlindAid, we would first need to connect the geometry and semantic detail together,
a process we will go over with more detail in Section 5.3.
As it turns out, the availability of MIT IFC data was limited to a subset of buildings
due to the complexity and effort required to fully model a 3D space. However, the
IFC data we received proved sufficient for our workflow development and should be
sufficient for the planned future BlindAid tests. Assuming more IFC data is available,
translation of IFC files may be one of the better approaches for interior data in the
future due to the comprehensiveness of its data.
Another possibility is to use the data provided in GIS shapefiles. While not fully 3D,
the individual 2D shapefiles specify different vertical layers corresponding to
different floors in a building. Hence, we could render an approximate 3D model by
stacking the shapefile layers and assuming a nominal height for each layer. The
shapefiles did come with semantic information describing types of rooms and
building properties. However, the details for each group of objects (e.g. rooms and
doors) were split into separate shapefiles that would need to be merged.
We note that even though data about MIT buildings was provided in AutoCAD
drawings, we did not pursue this particular source of data very deeply for a number
of reasons. In addition to being 2D drawings - something we can approach the same way as shapefiles - the AutoCAD files grouped objects such as doors and walls into disjoint layers, similar to the major drawback of IFC files. Working with the
shapefile formats without offering much in return, so we chose to focus our efforts
into the other more promising formats.
Finally, the set of interior geospatial data received from MIT presents several
options for creating CityGML workflows. Each type of data format offers the
geometry and semantic information needed by BlindAid in varying degrees of
completeness. Furthermore, the choice of which starting data format to use affects
the BlindAid system design (e.g. representing VEs as fully 3D or in a layer-by-layer
approximation). In Chapter 5, we will discuss our selection of file types and the
challenges encountered in developing the associated interior workflows.
3.2 Exterior Data
Exterior data was provided by MIT in AutoCAD (DWG), Shapefile (SHP), and
SketchUp (SKP) data formats. Of these three formats, only the SKP files contain true
3D geometry information, whereas DWG and SHP formats provide a level-by-level
representation. Unfortunately, the Sketchup building model files did not offer any of
the interior semantic information needed by BlindAid. The models were simply
collections of 3D geometries and did not provide classification details we could use
to identify buildings and rooms. In contrast, the 2D formats identify outside features
like trees and benches using descriptive names.
The primary goal of working with exterior data is to create a complete virtual
environment of a space that will tie separate interior spaces together into a spatially
transition from one space to another, namely doors. By identifying the precise locations of doors in an exterior model, we can link them to corresponding doors in the interior building model, provided the semantic information is there. Using these doors we can transition from an outside model to an inside one, and vice versa.
Chapter 6 will discuss each of the exterior workflows to CityGML we investigated. We stress the importance of finding enough semantic information for the
integration of exterior and interior data, and we will address the main issues encountered by each data type.
4 Software Tools
In this section we describe the main software tools we used in the development of
our MIT data to CityGML workflows. The tools consist mainly of viewing and editing
software for the various data formats we worked with. Several tools provided native
data format conversion functionality, and were instrumental to the workflow
process. The list does not include every piece of software we investigated, but it
details the most useful and relevant tools used in the project. See Appendix A for a
more complete list of software tools and how to acquire them.
4.1 BIMServer
BIMServer, short for Building Information Model server, is an open source project
that turns a computer into a 'BIMServer' capable of uploading and servicing building
model data. "The core of the software is based on the open standard IFC" thus
BIMServer supports the import and export of IFC data files and various other files
(BIMServer, 2014). BIMServer does not save IFC files directly. Instead, imported IFC
data are interpreted by a core-object and stored in an underlying database. This
method offers the advantage of being able to generate IFC as well as other data
formats on the fly (Ibid.).
For this project, we took advantage of a BIMServer CityGML GeoBIM extension that
translates IFC data into CityGML. The most attractive feature of this GeoBIM
and is able to output data in CityGML with LoD 4, the level of detail with the most
detail and the only one that includes interior data (Laat & von Berlo, 2010). Previous
efforts to generate CityGML from IFC exist, but they generally have limited semantic
mapping and the geometry transformations have errors.
4.2 ArchiCAD
ArchiCAD is an architectural Building Information Model CAD software developed
by Graphisoft that initially debuted in 1987. It is recognized as one of the first CAD
products available on a personal computer able to support both 2D and 3D models (Howell & Batcheler, 2005). ArchiCAD is able to import and export DWG, DXF, and
IFC files among others. Support for additional data formats are available through
free and commercial add-ons or extensions to ArchiCAD. Graphisoft itself has developed some freely available extensions including data support for Google SketchUp and Google Earth (Graphisoft, 2014).
Most relevant to this thesis is ArchiCADs ability to view and edit IFC files. We used ArchiCAD to make visual sanity checks and comparisons for all of our IFC data files. ArchiCAD allowed us to view an IFC building model both in a by-floor,
floor-plan-like fashion as well as in a general 3D perspective. It serves as a tool with which, one can manually update semantic details of various building elements.
Finally, it allowed us to break down a few of the larger IFC data files into smaller, more manageable sizes.
4.3 Sketchup
Sketchup is a 3D modeling program that is useful for various applications including
architectural, interior, film and video game design. Originally an independent piece
of software from 2000 to 2006, Sketchup was owned by Google from 2006 to 2012.
In 2012, the Sketchup team decided to leave Google and join Trimble, where it is still
maintained and developed today (Bacus, 2012). While the file format Sketchup uses
is proprietary, Sketchup supports software extensions written in Ruby. These
extensions and plugins offer workarounds for Sketchup's import and export
limitations. In this project, we took advantage of Sketchup's CityGML-Plugin to
translate our Sketchup data models into CityGML.
4.4 LandXplorer CityGML Viewer
The "LandXplorerCityGML Viewer is an interactive, real-time visualization system,
that allows you to effectively load, explore, and edit large 3D city models based on
CityGML" (Autodesk, 2008). It was created and is maintained by Autodesk, an
American software corporation best known for its AutoCAD line of software. Along
with its Revit line of software for Building Information Modeling, Autodesk's
software has been widely used by architects, engineers, and structural designers to
design and model buildings and other structures.
In this project, we use LandXplorer CityGML Viewer as the main software to
visualize translated CityGML data, and all CityGML figures are screen captures from
developed by KIT and GEORES CityGML SpiderViewer (see Appendix A for a larger
list of available software), but LandXplorer CityGML Viewer was chosen for its
ability to handle larger files as well as the potential of editing and export
functionalities described in its documentation (Autodesk, 2008).
4.5
Esri ArcMap
ArcMap is the main component in Esri's ArcGIS suite of geospatial tools. It is used to
create and modify various geospatial data sets. We use ArcMap in this project to
view and manipulate shapefile and geodatabase data. Among its many toolkits is a
Data Interoperability toolkit that allows the export of specified shapefiles to
CityGML. We used this feature in our workflow to translate MIT exterior data to
5
Interior Data Workflow
For each of the data formats we received from MIT for interior data, we investigated
a corresponding workflow to CityGML. We will begin by discussing initial workflows
from the provided AutoCAD model. However, as mentioned earlier in Section 3.1, it
generally lacked either the geometry or the semantic information required to
generate complete models for BlindAid. Next, we will detail the development efforts
of IFC and GIS Shapefile workflows. The IFC data offered rich semantic information
in addition to accurate 3D geometry, proving very promising towards the
generation of CityGML. Unfortunately, the availability of this data was limited, and
so we turned to GIS Shapefile data as a final potential data format, which also
contained rich semantic information and a workable geometry model.
5.1 AutoCAD Drawing Workflow
The AutoCAD data we received from MIT were building floor plans illustrating the
boundaries of every room and approximate locations of each door for a given floor.
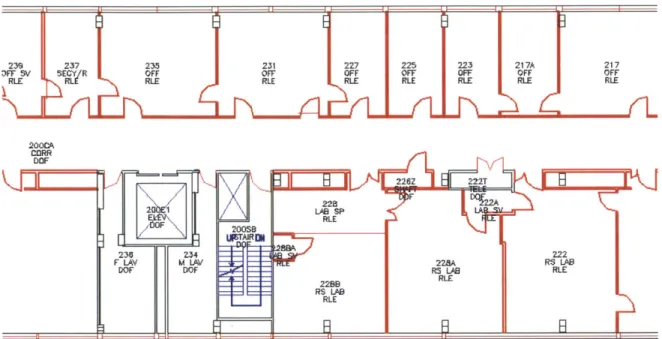
Figure 6 shows a sample AutoCAD drawing, which would serve as a potential data source for a workflow into CityGML. The main issue with the drawings, as
mentioned in Section 3.1, is that the physical building objects (e.g. walls, doors, stairs, etc.) are each grouped together into separate layers, not linked together in any way except by spatial proximity in the drawing itself. This makes associating
doors with their correct rooms more challenging and would require us to estimate
room boundaries.
DFF 5V I OFF OF OFF
RLE RILE RLE RLE
CORR DOF
223 [ 217A
217
OFF OFF OFF
RLE RLE RLE
OF F F DOF RLE 228 RLE RLA13 RLE RL0 RLE
Figure 6. A partial AutoCAD drawing of MIT Building 26, floor 2.
Furthermore, the floor plan drawings are in 2D, which means to achieve the desired
3D model for BlindAid, we would need to take the 2D outlines of each object and
extrude it into a third dimension. This approximation of 3D structure would not be
as accurate as the true 3D models presented by IFC data, but it may give a sufficient
3D representation for BlindAid, as we will explore further in our discussion of GIS
Shapefile data.
While possible to extract some semantic information and approximate 3D geometry
with AutoCAD drawings, the other MIT data formats provided better-defined
semantic and geometric characteristics. Thus, we chose to focus our efforts on their
respective workflows.
E
225 OFF RLEYL11
========:A - 1 20SB5.2
IFC Workflow
The IFC data was the main focus of our efforts in the thesis project toward developing a workflow to CityGML, due to the comprehensiveness of both its semantic and geometric information. Specifically, we used the MIT IFC data for MIT's Building 36 to develop and test the workflow. We were mostly interested in the semantic room information, which included room number, floor level,
department information, and room type (i.e. Laboratory, Elevator, etc.). The main
challenge in working with the MIT IFC data was that in its raw form, the data had geometry information stored in IfcDoor, IfcWall, IfcWindow, IfcStair, IfcSlab, and a few other IFC objects. Semantic information, on the other hand, was recorded in
IfcSpace objects. And unfortunately, there is no direct mapping in the IFC data between IfcSpace objects and any of the geometry objects.
We now present a detailed description of the IFC to CityGML workflow, which consists of three main steps:
1) Merge semantic and geometric information in IFC data.
2) Convert IFC data to CityGML.
3) Extract semantic information from CityGML into correct fields.
Step 1: Merging semantic and geometric information
The first step in this workflow is to tie the semantic information of IfcSpace objects together with the physical geometry information stored in IfcDoor objects. We chose
IfcDoor objects because doors are logical transition points between spaces. For example, if a user wishes to move from a central hallway into a room, they generally will enter through the doorway. By having correct semantic information associated with a door object in a final BlindAid VE, the system can easily tell its user about a new room they have entered or are about to enter.
While there are no direct relationships between individual IfcSpace and IfcDoor objects in the IFC data hierarchy, there exist IfcRelAggregates objects that link all the IfcSpace objects of a particular building floor together as well as an
IfcRelContainedInSpatialStructure objects to similarly link together all physical objects including IfcDoors of the same floor. The challenge then was how to associate the correct doors to the correct spaces on a given floor. For that, we
decided to perform a spatial estimation of which IfcDoors belong to which IfcSpaces.
Each IfcDoor object has its location property defined by an IfcCartesianPoint object, which is a tuple describing a Cartesian coordinate in three dimensions. Similarly, the outline of each IfcSpace object is described by either an IfcPolyline containing a list of IfcCartesianPoints or an IfcRectangleProfileDef object, which identifies a closed polygon with certain dimensions centered at a single lfcCartesianPoint.
After identifying the spatial location of each object, we drew the space geometries and doors together as shown in Figure 7. It is apparent that each door lies near the boundary of two spaces. By extending each space outline outwards by a small margin, we can then determine whether a door coordinate lies fully within the polygon outline of a space using the following technique: project a ray originating at
the door location in the positive x-axis direction (any direction will work). We count the number of times this ray intersects the edge of a shape. If the number of
intersections is odd, that means the door lies inside the shape, outside otherwise.
Figure 7. Image of reconstructed floor plan from IFC data for MIT Building 36, floor 4 using python script (Appendix C.6). Doors are drawn as white circles and rooms are filled with
different colors for visual distinction.
Applying this technique to the MIT Building 36 data, floor 4, we identified 69 total spaces and 67 total doors. Of these doors, we found space matches for 63, or 94%, of them. However, we note that the floor image shown in Figure 8 has a dark area in its lower center section. The dark area actually represents two large conference rooms whose geometries were misinterpreted by our script. Upon further analysis, the coordinate points of the four doors without a space match were all in proximity to the aforementioned dark area. Thus, with improved geometry detection, our technique may yield an even higher door-space match rate.
Using these matches, we augmented each IfcDoor's properties with the room number and room type of the associated spaces. For example, a door that was located on the edge of the IfcSpace object representing an office room, 477B, would have its name changed to include the text "477B: OFF". This first step of our IFC to CityGML workflow was implemented as a python script, parse-ifc.py, which is
presented in Appendix C.6.
Step 2: Convert IFC to Citygml
Step 2 of our workflow involves the actual conversion of the IFC file into a CityGML
file. Our data conversion workflow of choice between IFC and CityGML was to use the open source BIMServer with its GeoBIM plugin that supported CityGML
exporting. Among the IFC to CityGML workflows we had access to - BIMServer, FME Workbench, and Sketchup - the data translation offered by BIMServer both
preserved the most semantic information and took the least amount of time for our MIT building data. BIMServer worked very well in translating the geometry
elements of IFC such as the walls, doors, and stairs. It also translated semantic information, such as name and description, if they were available.
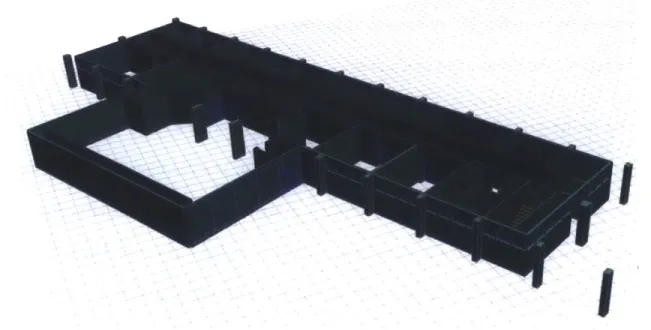
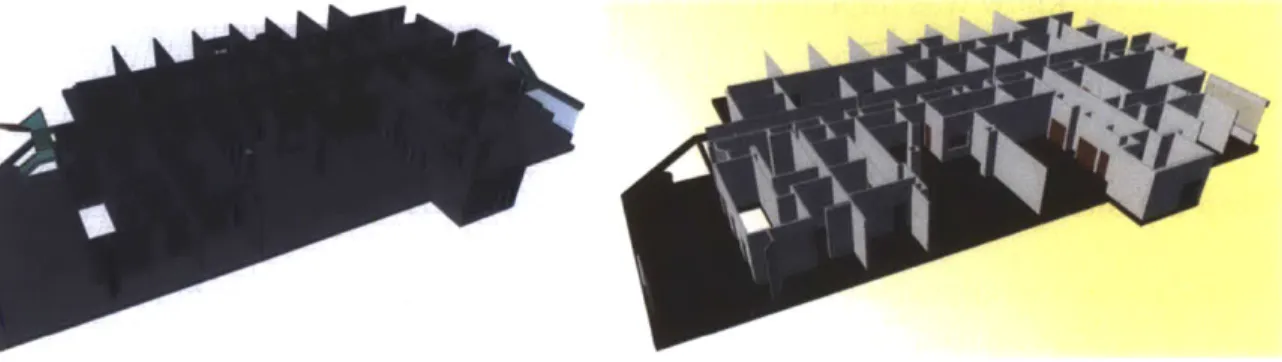
One feature BIMServer did not support was the translation of lfcSpace objects because they were considered abstract objects. Using our BIMServer on an
unmodified IFC file would successfully recreate the geometry modeled by the IFC data, see Figure 8, but most semantic detail of the building interior rooms and hallways would be lost. However, by first applying step 1 of our workflow, we store semantic information in the properties of physical lfcDoor objects. As a result, the
room number and type information is preserved in the IfcDoor name field through the BIMServer translation. Now, we have a CityGML file with full 3D geometry, as
before, plus the relevant semantic room information required for BlindAid, and we move on to step 3 for post-processing.
Figure 8. MIT Building 36, floor 4 model converted from IFC (left) to CityGML (right) using BIMServer.
Step 3: Post-processing of semantic information
At this point in the workflow, we wish to extract the relevant semantic information stored in the IfcDoor name fields and update the CityGML door object's name attribute to reflect the door number and its description attribute to reflect the type of room. To do so, we parse each of the objects' names in the CityGML file and reassign the room number and room type to the correct fields. Appendix C.7 provides pseudocode for the script used to perform this post-processing step.
As a whole, this workflow from IFC to CityGML represents an effective process of converting the given MIT IFC data into CityGML data that is usable by BlindAid. Our workflow offers an approximate solution to combining the initially decoupled semantic and geometry information through pre- and post-processing steps surrounding the direct translation of IFC to CityGML. The 94% door to space
identification rate represents a significant portion of semantic information being
captured. Any missing data can potentially be added into the model by hand using a CityGML editor tool such as the LandXplorer CityGML Viewer.
5.3
Shapefile Workflow
The GIS Shapefile data is similar to the AutoCAD data in that it is presented in a layer-by-layer slice of each floor; however, the semantic information contained in the shapefiles is far more comprehensive. Figure 9 shows an example based on a
building data set comprised of two shapefiles, one containing room and floor plan information and the other describing door properties. Even though the door and
room data are stored in separate files, they individually contain enough semantic information to connect the information in the final BlindAid model representation.
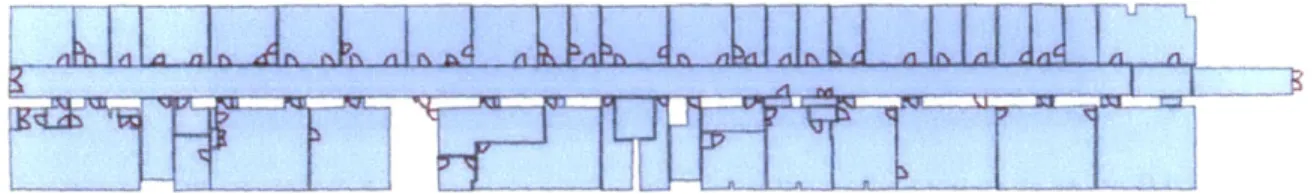
Figure 9. Shapefile data representation of MIT Building 26, floor 2. Though resembling a floor plan, the complete shapefile contains semantic information for each individual floor of
the building.
The workflow from MIT Shapefile data to CityGML revolves around using the
Interoperability Tools feature in the ArcMap application. Using this toolkit, we can
export a selection of GIS Shapefiles directly into other geospatial data formats,
information that will allow BlindAid to inform users where they are and what
objects they contact as they explore a VE. The main drawback in using Shapefiles,
however, is that Shapefile data is inherently in 2D. As a result, the objects inside the
generated CityGML files are also 2D. Our CityGML viewer was unable to render the
converted CityGML, however we show a section of CityGML code in Figure 10
representing the preserved semantic information as a result of this workflow step.
Figure 10. Code showing preserved semantic information (SPACENAME, BLDGFLOOR, and
LEVELID) of CityGML file resulting from ArcMap's GIS Shapefile to CityGML conversion.
From this point, an additional post-processing step is required to give the CityGML
objects a third dimension. Unfortunately, we did not have time to fully implement
the remainder of this workflow. Following is a brief summary of what the
post-processing step would involve
Each object contains a list of 3D coordinates that describe the horizontal boundaries
are translated into 3D CityGML coordinates with the z value (i.e. height) arbitrarily
set to zero. By properly adding another set of points to the object's list of
coordinates - with the same x & y values, but displaced vertically by some nominal height, h - the 2D shape may be extruded vertically into a 3D object. For example, if an object's original horizontal boundary was defined by points (0,0,0), (0,10,0), and
(10,0,0), we would add (0,0,h), (0,10,h), (10,0,h) to the list of coordinates.
Additionally, if a shapefile contains information about multiple floors of a building,
we need to extract each object's floor level, F, and adjust the heights of every point
in the object's list by the correct multiple of h, F*h. This will stack individual floor
layers on top of one another and create an approximate 3D model of the original
shapefile. We foresee BlindAid being able to take the resultant CityGML model and
render its own VEs for the entire 3D model or perhaps just one layer at a time.
With the preservation of semantic information ArcMap provides and with proper
post-processing of object geometry, this approach could prove to be an effective way
to translate MIT building data from GIS Shapefiles into CityGML. A notable benefit of
considering GIS Shapefile data as part of a workflow is its availability. Unlike IFC
data, which is only available for a handful of MIT buildings, GIS data exists and is
maintained for the entire MIT campus. Once the workflow from shapefiles is
finalized, we can be certain that shapefile data will be there for us when we need to
5.4
Results and Discussion
Of the geospatial data sources provided by MIT, IFC and GIS Shapefile data proved to
be the more promising for our interior CityGML workflow. The advantage of using
IFC data as a source is that all the relevant semantic and geometry information are
already in one place. With proper pre- and post-processing, we can leverage an
existing BIMServer tool to convert IFC directly into CityGML. Our workflow from IFC
is sufficient for generating the CityGML models for BlindAid tests in the immediate
future. If IFC building model data becomes more widely available in the future, it
could be one of the best data sources from which to generate BlindAid VEs.
Currently, however, IFC data of MIT buildings is limited, especially when compared
to MIT's collection of GIS data. With this in mind, we identified a very promising
workflow from GIS Shapefiles into CityGML. While not completed yet, a final
implementation of the workflow in future work should prove to be an effective
6 Exterior Data Workflow
The workflows we identified for exterior data received from MIT use similar tools and techniques as the interior data workflows discussed in Chapter 5. The two main sources of exterior MIT data we focused on were in SketchUp and GIS Shapefile formats. Although we did receive AutoCAD drawing files for the outside MIT campus, we chose not to consider them for the same reasons discussed in Section
5.1. Many of the challenges and issues encountered with interior data workflow
development also exist for exterior data. Additionally, we place higher priority on having semantic information for exterior building doors and building identification, as these pieces of information are key to enabling the transition to and from exterior and interior data models.
6.1 SketchUp Workflow
The initial exterior workflow we considered was the exterior SketchUp model of MIT's outside campus. The conversion of a SketchUp model to CityGML is fairly straightforward. SketchUp is currently proprietary software, so we do not have access to its underlying data model. However, there exists a CityGML plugin written in Ruby (see Appendix A) that supports importing and exporting CityGML files from SketchUp models. By running our MIT SketchUp data through this plugin, we are able to generate replica 3D models in CityGML, shown in Figures 11, which shows a side-by-side comparison of our model of the MIT campus, before and after
Figure 11: SketchUp (left) and CityGML (right) models of the outside MIT campus. The CityGML model was generated using SketchUp CityGML Plugin Tool. Note, the data includes
only building shape information and no other outdoor features.
As seen from the figure, the CityGML translation captures the overall geometry of
building exteriors and MIT's outside areas very well. However, upon inspection of
the CityGML files, we realize that the individual CityGML objects are simply
identified by enumeration (e.g. objects with ids _BldglObject_1, _BldglObject_2, _Bldg_2_Object_1, etc.) of the order in which they were evaluated. The files
contained minimal semantic information or readable properties that, in particular,
would allow us to properly identify individual buildings, doors, and most other
outside objects such as sidewalks or roads (though interestingly, certain exterior
MIT SketchUp files did contain trees, which were properly translated as shown in
Figure 12). So while we could model the physical geometry of the MIT campus using
this approach, we needed another way to retrieve semantic information.
Figure 12: Exterior models of MIT Building 26 in original SketchUp format (left) and after conversion to CityGML (right). Notice the presence of and successful translation of trees.
6.2 GIS Data Workflow
The next exterior workflow we explored used shapefiles coupled with an Esri
geodatabase as exterior data. Together, they gave a semantically rich representation
of MIT's outside campus. This set of geospatial data files is broken up by layers, each
describing a particular feature set (bike racks, trees, building exteriors, etc.). However, again, the shapefiles describe objects as 2D shape outlines. But when
coupled with the geodatabase, we can assign an elevation level to each shapefile
object and stack each layer on top of one another to create approximate 3D
representations of the campus.
As in the interior workflow, we converted the exterior shapefiles to CityGML using
the Interoperability Tools feature in the ArcMap application. We were fortunate to be provided with shapefiles containing information about exterior doors, buildings,
pedestrian walkways, and more. By combining and exporting these different
shapefiles to CityGML, we have access to the semantic information most relevant for
a final BlindAid VE. As in our interior GIS data workflow, we would also need to extend the 2D geometry of shapefiles into the third dimension to approximate a 3D model, a step not yet implemented. Nonetheless, the GIS data to CityGML workflow promises to be an effective way for BlindAid to import 3D geospatial data in the future.
6.3 Results and Discussion
Of the two MIT data sources we considered for the exterior workflow to CityGML, GIS Shapefiles may be the more promising approach for the planned experiments
due to the amount of available semantic information. Still, additional work must be
done before we can properly approximate 3D geometry from the provided 2D
shapefiles. One alternative workflow for future consideration is to consider the
hybrid of SketchUp and GIS Shapefile data. Together, these two data formats contain
sufficient geometric and semantic data for BlindAid VEs. The main advantage of the
hybrid approach is that the SketchUp data provides a better geometric
representation of the building exteriors than what might be obtained from layering
the shapefiles. A challenge is the need to transform both data models into a common
reference frame, such that the appropriate semantic and geometric information are
matched up.
One further concern for all data workflows, both exterior and interior, is that the
final model must agree on what unit of measurement (feet, meters, etc.) is used for
all object dimensions. The current BlindAid system depends on having correct
distance measures for its audio features. Measurement units would also have an
effect on choosing the correct nominal height for layers in the GIS Shapefile to
CityGML workflows. Future work should keep these concerns in mind whether they
build upon the initial workflows presented here or create workflows from other
7 Conclusions
In this thesis, we demonstrated the conversion of geospatial data acquired from MIT
to the CityGML format via various workflows. The MIT data for interior spaces and
exterior spaces provided rich semantic and geometric data. The main challenge was
that semantic and geometric information were often completely separated from
each other. Through our interior and exterior data workflows to CityGML from IFC
and GIS Shapefiles, respectively, we demonstrated how key semantic information
could be preserved while accurately converting geometry as well.
While the workflows identified in this thesis do have limitations, significant progress was made developing the tools to translate geospatial data provided by MIT into CityGML files, which may then be used to create the VEs of MIT for the planned experiments. The initial workflows we developed also demonstrate the potential for the BlindAid system to accept various types of geospatial data. There may be many data formats and sources among the many current geospatial data initiatives, but data interoperability work such as in this thesis enables transitioning from one data type to another.
References
Allan, Andy. (2014). "OpenCycleMap". Retrieved April 25, 2014. http://www.opencyclemap.org/docs.
Autodesk, Inc.. (2008). "LandXplorer CityGML Viewer 2009". Retrieved April 25, 2014.
http://download.autodesk.com/us/landxplorer/docs/LDXCityGMLViewer/HTML /index.html.
Bacus, John. (2012). "A new home for SketchUp". SketchUpdate. Retrieved April 25,
2014. http://sketchupdate.blogspot.dk/2012/04/new-home-for-sketchup.html.
BIMserver. (2014). "About". Retrieved April 24, 2014. http://bimserver.org/about.
Cooper, Daniel. (2012). "Craigslist quietly switching to OpenStreetMap data". Engadget. Retrieved April 25, 2014.
http://www.engadget.com/2012/08/28/craigslist-open-street-map.
BIMserver. (2014). "About". Retrieved April 24,2014. http://bimserver.org/about.
Eastman, C., P. Teicholz, et al.. (2011). "BIM Handbook: A Guide to Building Information Modeling for Owners, Managers, Designers, Engineers and Contractors". Hoboken, New Jersey, Wiley.
Esri, 1998. "Esri Shapefile Technical Description". Retrieved April 30, 2014. http://www.esri.com/library/whitepapers/pdfs/shapefile.pdf.
Esri, 2014. "Geodatabase Overview". Retrieved April 30, 2014. http://www.esri.com/software/arcgis/geodatabase.
Geomagic. (2014). "Geomagic Touch X". Retrieved April 30, 2014. http://geomagic.com/en/products/phantom-desktop/overview.
Google Developers. (2014). "KML Tutorial". Keyhole Markup Language. Retrieved 17 April 2014. http://developers.google.com/kml/documentation/kml-tut.
Graphisoft. (2014). "ArchiCAD". Retrieved April 25, 2014. http://www.graphisoft.com/archicad.
Howell, Ian and Batcheler, B.. (2005). "Building Information Modeling Two Years Later - Huge Potential, Some Success and Severe Limitations". Retrieved April 25, 2014. http://www.laiserin.com/features/bim/newformabim.pdf.