HAL Id: hal-02647584
https://hal.inrae.fr/hal-02647584
Submitted on 29 May 2020
HAL is a multi-disciplinary open access
archive for the deposit and dissemination of
sci-entific research documents, whether they are
pub-lished or not. The documents may come from
teaching and research institutions in France or
abroad, or from public or private research centers.
L’archive ouverte pluridisciplinaire HAL, est
destinée au dépôt et à la diffusion de documents
scientifiques de niveau recherche, publiés ou non,
émanant des établissements d’enseignement et de
recherche français ou étrangers, des laboratoires
publics ou privés.
resistant and susceptible Biomphalaria glabrata strains
in response to Schistosoma mansoni
Anne E. Lockyer, Aidan M. Emery, Richard A. Kane, Anthony J. Walker,
Claus D. Mayer, Guillaume Mitta, Christine Coustau, Cohen M. Adema, Ben
Hanelt, David Rollinson, et al.
To cite this version:
Anne E. Lockyer, Aidan M. Emery, Richard A. Kane, Anthony J. Walker, Claus D. Mayer, et al..
Early differential gene expression in haemocytes from resistant and susceptible Biomphalaria glabrata
strains in response to Schistosoma mansoni. PLoS ONE, Public Library of Science, 2012, 7 (12),
�10.1371/journal.pone.0051102�. �hal-02647584�
Resistant and Susceptible
Biomphalaria glabrata
Strains
in Response to
Schistosoma mansoni
Anne E. Lockyer1,7¤, Aidan M. Emery1, Richard A. Kane1, Anthony J. Walker2, Claus D. Mayer3,
Guillaume Mitta4, Christine Coustau5, Coen M. Adema6, Ben Hanelt6, David Rollinson1, Leslie R. Noble7, Catherine S. Jones7*
1 Wolfson Wellcome Biomedical Laboratories, Department of Life Sciences, The Natural History Museum, London, United Kingdom, 2 School of Life Sciences, Kingston University, Kingston-upon-Thames, Surrey, United Kingdom,3 BioSS (Biomathematics & Statistics Scotland) Office, Rowett Institute of Nutrition and Health, Aberdeen University, Aberdeen, United Kingdom,4 Ecologie et Evolution des interactions, CNRS Universite´ de Perpignan, Perpignan, France, 5 Sophia Agrobiotech Institute, INRA-CNRS-UNS, 06903 Sophia Antopolis, France,6 CETI (Center for Evolutionary and Theoretical Immunology), Biology, University of New Mexico, Albuquerque, New Mexico, United States of America,7 School of Biological Sciences, University of Aberdeen, Aberdeen, United Kingdom
Abstract
The outcome of infection in the host snail Biomphalaria glabrata with the digenean parasite Schistosoma mansoni is determined by the initial molecular interplay occurring between them. The mechanisms by which schistosomes evade snail immune recognition to ensure survival are not fully understood, but one possibility is that the snail internal defence system is manipulated by the schistosome enabling the parasite to establish infection. This study provides novel insights into the nature of schistosome resistance and susceptibility in B. glabrata at the transcriptomic level by simultaneously comparing gene expression in haemocytes from parasite-exposed and control groups of both resistant and schistosome-susceptible strains, 2 h post exposure to S. mansoni miracidia, using an novel 5 K cDNA microarray. Differences in gene expression, including those for immune/stress response, signal transduction and matrix/adhesion genes were identified between the two snail strains and tests for asymmetric distributions of gene function also identified immune-related gene expression in resistant snails, but not in susceptible. Gene set enrichment analysis revealed that genes involved in mitochondrial electron transport, ubiquinone biosynthesis and electron carrier activity were consistently up-regulated in resistant snails but down-regulated in susceptible. This supports the hypothesis that schistosome-resistant snails recognize schistosomes and mount an appropriate defence response, while in schistosome-susceptible snails the parasite suppresses this defence response, early in infection.
Citation: Lockyer AE, Emery AM, Kane RA, Walker AJ, Mayer CD, et al. (2012) Early Differential Gene Expression in Haemocytes from Resistant and Susceptible Biomphalaria glabrata Strains in Response to Schistosoma mansoni. PLoS ONE 7(12): e51102. doi:10.1371/journal.pone.0051102
Editor: Geoffrey N. Gobert, Queensland Institute of Medical Research, Australia Received August 8, 2012; Accepted October 31, 2012; Published December 26, 2012
Copyright: ß 2012 Lockyer et al. This is an open-access article distributed under the terms of the Creative Commons Attribution License, which permits unrestricted use, distribution, and reproduction in any medium, provided the original author and source are credited.
Funding: This work was carried out with funding from the Wellcome Trust (068589/Z/02/Z). CMA and BH acknowledge support from the United States National Institutes of Health (NIH), USA R01AI052363 (CMA) and COBRE 1P20RR018754 IdEA, NCRR. The funders had no role in study design, data collection and analysis, decision to publish, or preparation of the manuscript.
Competing Interests: The authors have declared that no competing interests exist. * E-mail: c.s.jones@abdn.ac.uk
¤ Current address: Institute for the Environment, Brunel University, Uxbridge, Middlesex, United Kingdom
Introduction
The tropical freshwater snail Biomphalaria glabrata is an intermediate host for several digenean trematode parasitic worms, including Schistosoma mansoni, the causative agent of human intestinal schistosomiasis. Human schistosomiasis is the most widespread trematode infection affecting around 200 million people, leading to a chronic debilitating disease and up to 200,000 deaths per year, across 75 developing countries [1]. Because of its medical importance, the B. glabrata/S. mansoni system has also emerged as a model for studies into multicellular host-parasite co-evolution, driven by reciprocal evolution of host resistance and parasite infectivity and/or virulence [2,3]. The initial interactions between snail and invading schistosome are considered to define their respective future reproduction and survival; the parasite transforming from a short-lived free-living form in freshwater to a
longer-term asexual parasitic stage in the snail hosts. If the snail cannot suppress and eliminate the invading schistosome quickly it risks parasitic castration (reviewed in [4]) followed by early death [5,6]. The initial molecular interplay between snails and schisto-somes is complex and there exists an urgent need to determine the principal pathways controlling this response, since identifying those factors involved in the intricate balance between the snail internal defence system (IDS) and trematode infectivity mecha-nisms that determine the success or failure of an infection (reviewed in [7–9]) may provide insight into approaches to disrupt the parasitic infection in the snail and break transmission. Furthermore, by understanding the basis of compatibility and the mechanisms underlying snail susceptibility to schistosome infection, the levels of compatibility in field situations can be assessed, leading to enhanced understanding of transmission dynamics which could ultimately inform control strategies.
Susceptibility of B. glabrata to S. mansoni is a heritable trait [10], with both snail and parasite genes influencing the outcome of infection [11]. In incompatible interactions, the schistosome fails to recognize, penetrate or develop within the snail, or may be destroyed by the IDS; such killing is mediated by haemocytes, ‘macrophage-like’ defence cells, encapsulating and eliminating non-compatible parasites [12]. The ‘‘schistosome-resistant’’ phe-notype is defined as individuals or strain refractory to infection by a normally compatible schistosome strain. To establish an infection in a compatible strain, the schistosome larva must prevent the snail from detecting and/or eliminating it. Two hypotheses are that either the parasite remains undetected by the host and therefore no defence response is mounted [13,14], or that the parasite is able to interfere with or suppress the host response to enable it to establish an infection [15–17]. Haemocyte-derived molecules thought to be key regarding snail defence to schisto-somes include a diverse family of secreted lectins called fibrinogen-related proteins (FREPs), co-determinants of resistance as shown by RNAi knockdown [12,18–20] that form complexes with schistosome mucins [21–23]; and lysosomal enzymes, and reactive oxygen/nitrogen intermediates [8,23–25] which facilitate killing of the parasite. A cytosolic copper/zinc superoxide dismutase (SOD1) has also been associated with the schistosome-resistant phenotype [26,27]. Moreover, the snail host oxidant response to schistosome infection has been investigated from the perspective of molecular co-evolution, through evaluation of reciprocal anti-oxidant responses of S. mansoni [28]; parasite anti-anti-oxidant capacities appear to match closely host haemocyte oxidant responses in sympatric B. glabrata/S. mansoni combinations, highlighting the importance of oxidant production by resistant phenotype haemocytes [28]. Migration and recognition/adhesion of haemocytes to transforming miracidia/developing sporocysts are also likely important determinants of the resistance response. Integrin-like cell surface receptors [29] are known to regulate haemocyte adhesion and motility [30–32] and a tandem-repeat galectin has been found to bind haemocytes and the tegument of S. mansoni sporocysts [33] making it a candidate anti-schistosome pattern recognition receptor. Interestingly, S. mansoni excretory-secretory products (ESPs), released by transforming miracidia, have been shown to suppress extracellular signal-regulated kinase (ERK) signalling in haemocytes of susceptible, but not resistant B. glabrata [34] demonstrating that in compatible hosts, schistosomes can interfere with pathways that regulate snail haemocyte defence responses such as nitric oxide production [25]. Finally, knock-down of the recently-characterized B. glabrata cytokine Macro-phage Migration Inhibitory Factor (BgMIF) was shown to reduce encapsulation of S. mansoni sporocysts in vitro and increase mother sporocyst survival in vivo [35]. Hence, the complex nature of the snail haemocyte defence response to schistosomes, outlined above, makes analysis of global gene expression a vital component of research aimed at elucidating the array of underlying mechanisms of snail-schistosome compatibility.
Both a cDNA microarray [36] and a specific stress/immune gene selected oligo array [20,37,38] have been employed previously for gene expression analysis in B. glabrata. This widely used method of global gene expression analysis involves hybrid-izing reverse-transcribed cDNA to the array to indicate relative gene expression for each arrayed gene or EST; this approach does not rely on prior knowledge of candidate genes or mechanisms in advance [39]. We previously developed a 2 K cDNA microarray for B. glabrata [36], using randomly sequenced ORESTES-derived expressed sequence tags (ESTs) of various snail tissues including haemocytes [40], together with sequences derived from earlier differential gene expression analyses associated with schistosome
resistance in snails using differential display (DD) [41–43] and suppression subtractive hybridization (SSH) [44]. We have therefore included many genes on the array which may be involved in snail parasite interactions, without making a priori assumptions of their functions based on homology to genes characterised in other organisms. Previous experiments using this microarray to compare gene expression in vivo in haemocytes from schistosome-exposed B. glabrata strains exhibiting resistant or susceptible phenotypes identified more than 90 strain-specific differentially expressed genes [36]. Unlike techniques such as qPCR, the strength of microarray analysis is that it provides a global view of changes in gene expression through simultaneous comparison of large numbers of genes, indicating cellular pathways and processes involved in response to parasite challenge. The 2 K microarray was significantly expanded for use in this study, with the addition of more than 3 K ESTs.
With the aim of identifying snail strain differences in early haemocyte responses to schistosomes, we furthered past approach-es towards defining genapproach-es and pathways involved in host defence responses by the first use of gene set enrichment analysis (GSEA) [45] and FatiScan [46] in snail-schistosome interaction studies, using the most comprehensive B. glabrata cDNA microarray to date. A key question was to determine if strain specific responses to parasite exposure were at an early stage post exposure and to assess if the parasite was influencing (suppressing) the normal snail defence response in the susceptible strain. During invasion of the snail host, molecules are released from the miracidial penetration glands and within 1 hour the ciliated epidermal plates covering the miracidium are released allowing the parasite to transform into a post-miracidium that lacks a protective surface [47]; other ESPs are also released from the schistosome during such early post-embryonic development and ESPs can modulate kinase signalling [34] and protein expression [48] in B. glabrata haemocytes in vitro within a similar time frame. Thus, 2 hours post-exposure was selected as an appropriate time frame for our investigation to compare haemocyte gene expression changes in both snail strains in the context of schistosome invasion and early schistosome development in the host. The transcriptomic responses of these schistosome-resistant and -susceptible phenotypes to S. mansoni provide novel insights into the nature of early stage interactions that are likely to define trematode resistance and susceptibility.
Methods
Microarray Construction
In addition to the 2053 ORESTES, SSH and DD clones printed on the 2 K B. glabrata cDNA microarray [36], a further 3174 were available from ORESTES libraries [14,40], and a haemocyte cDNA library [49]. Selected clones, supplied spotted onto Whatman FTATMcards, were prepared by eluting the DNA
from small discs punched from the card using Multiscreen PCR filter plates (Millipore, Billerica, USA); the resultant DNA was used for 100ml PCRs containing 16NH4reaction buffer (Bioline,
London, UK), 2.5 mM MgCl2, 0.2 mM dNTP, 0.2mM each M13
forward and reverse primers and 0.025 U/ml PCR Taq polymer-ase (Bioline). Cycling conditions were: 94uC for 2 min, then 35 cycles of 94uC for 30 s, 58uC for 30 s and 72uC for 90 s, then a single cycle of 10 min at 72uC. We specifically included several genes implicated in the defence response of resistant snails, including FREP2 [50]; Cu/Zn superoxide dismutase (SOD) [26,27] and Mn SOD [51]. The array also contained antioxidant genes such as thioredoxin peroxidase, peroxiredoxin 6, perox-inectin, peroxidasin and dual oxidase I and genes for cell signalling proteins including nuclear factor-kappa B (NF-kB), focal adhesion
kinase (FAK) and I-kappa-B kinase complex associated protein (IKAP). PCR products were amplified for 7 specific B. glabrata genes (chosen as the sequences were available on GenBank, but not already represented in the ESTs from SSH, ORESTES or cDNA library), using primers designed from their sequences (Table 1). For all clones, 2mg PCR product was transferred to 384-well plates (Molecular Devices (Genetix), New Milton, Hampshire, UK) using a Microlab Star robotic work-station (Hamilton Robotics, Birmingham, UK). A total of 5234 cDNA clones (50–200 ng/ml) were selected for printing. Controls were also included: yeast tRNA (250 ng/ml); B. glabrata genomic DNA from snail strains (NHM laboratory code) NHM3017 (derived from BS90 [52]), NHM1742, NHM3036 (derived from BB02 [53]) (200 ng/ml) and genomic DNA from Biomphalaria tenogophila, Bi straminea, Bi pfeifferi, Bi alexandrina, Bulinus globosus and Bu truncatus; pGem (purified vector with no insert) (75 ng/ml), two specific genes, (ribosomal 18s and cytochrome oxidase I) amplified from S. mansoni and blanks containing spotting buffer only. 15ml aliquots were transferred to a further 384-well plate and 5ml 46 spotting buffer (600 mM sodium phosphate; 0.04% SDS) added. The clones were printed (in duplicate) in 16 sub-arrays (4 columns64 rows), with 26626 clones in each sub-array on aminopropyl silane coated glass slides (CorningH GAPSTM II), at the Microarray Facility, Department of Pathology, University of Cambridge, UK; this array is the second generation B. glabrata microarray. Microarrays were processed by baking for 2 h at 80uC and UV cross-linking at 600 mJ. (GenePix Array List (GAL) file: NHM-ABDN B.glabrata 5 K v1 ArrayExpress Archive accession: Array A-MEXP-1401). Differential expression of haemocyte genes using this B. glabrata cDNA microarray technology has previously been confirmed by quantitative qPCR [36] and the array was found to deliver robust results in our hands.
Snail Material and Parasite Exposure
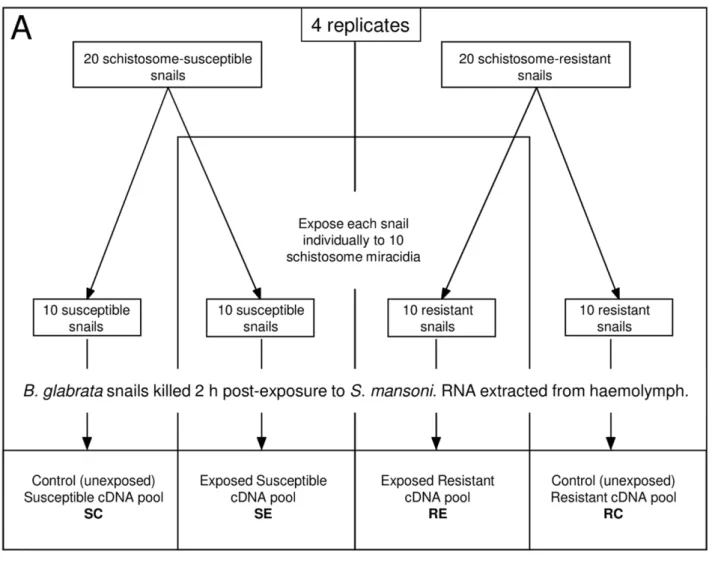
Four replicate experiments were performed (Fig. 1A). For each replicate, 20 adult B. glabrata from the susceptible strain (NHM1742) and 20 from the resistant strain (NHM3017) were maintained overnight in autoclaved snail water containing 100mg/ml ampicillin. 10 snails from each strain were exposed
individually to 10 S. mansoni miracidia (Belo Horizonte strain), while 10 were kept in identical conditions, but not exposed to miracidia. Snails were killed swiftly by decapitation 2 h post-exposure, and the exuded haemolymph collected. Haemolymph was pooled for each sample group (resistant exposed (RE), resistant control (RC), susceptible exposed (SE), susceptible control (SC)) and haemocytes pelleted by centrifuging at 10,0006g for 20 min at 4uC. The lymph was then removed and the haemocyte pellet frozen in liquid nitrogen and stored at –80uC.
Microarray Hybridization
Total RNA was extracted from pooled haemocytes, using the SV RNA extraction kit (Promega UK Ltd, Southampton, UK) according to the manufacturer’s protocol. This kit includes DNAse treatment to eliminate genomic DNA contamination. cDNA was synthesized from 100 ng total RNA using the SMART PCR [54] cDNA synthesis kit (BD Biosciences, Oxford. UK) according to the manufacturer’s instructions and labelled with both Cy3 and Cy5 in 2 separate reactions using the BioPrime DNA labeling system (Invitrogen, Paisley, UK). 16 microarray hybridizations were carried out as described previously [36] using a loop design with dye swaps (Fig. 1B). The loop design [55] allowed direct comparison of results from resistant and susceptible snails and control and exposed snails, by comparing, directly on the arrays: i) control and parasite-exposed snails of both the resistant snail line and of the susceptible snail line (4 replicates, 2 with Cy dyes in one orientation and 2 swapped over) and ii) resistant and susceptible snail lines both for control snails and parasite-exposed snails (again with 4 replicates, 2 labelled in one orientation, 2 in the other).
Microarray Scanning and Analysis
Microarray slides were scanned sequentially for each Cy dye, at 10mm resolution using an Axon GenePix 4100A scanner (Molecular Devices (UK) Ltd, Wokingham, UK). Photo multiplier tube values were adjusted to give an average intensity ratio between channels of approximately 1. Spot finding and intensity analysis was carried out using GenePix Pro 5.0. Data from these microarray experiments have been deposited with ArrayExpress: Experiment E-MEXP-1882. 16 GenePix output files were Table 1. Biomphalaria glabrata gene-specific primers used to amplify specific gene fragments included on the microarray.
Code Acc No Gene Primer sequence
BgB AB210096 Dermatopontin 1 F GGTTATGCCAATGACTTCGGAC R GATTGACTTGCTCGCTCACG BgG AF179902 Integrin interactor protein F CCTTGGGAATGTCATTGCTTG
R GACCATTCCACCCTGATTGC BgI AF302260 Serine protease B F CTAAGATACGGTGCTGGCTCG
R GCGTAGACACCTGGTCTGCC BgK AY026258 Thioredoxin peroxidase F CACTCACCTTGCATGGACTAATG
R CAAGCGCAGTGTCTCATCAAC BgP AY678119 Type 2 cystatin F CAAAATTGTCCACGCCACATC R GATGGTGTTCCCTGTAGTTGGG BgQ DQ087398 guanine nucleotide-binding protein Rho F GGCAGCAATACGTAAGAAGCTTG
R GCTGTGTCCCATAAGGCTAGTTC BgSOD AY505496 Cu/Zn superoxide dismutase F GGTGATGATGGTGTTGCTGA
R GATACCAATGACACCACAAGCTAA F-forward facing primer. R- Reverse facing primer.
Figure 1. Experimental design for the simultaneous comparison of haemocyte gene expression inBiomphalaria glabratastrains upon exposure toSchistosoma mansoni. A. Resistant (R) and susceptible (S) strains of B. glabrata were exposed to S. mansoni (E) or kept unexposed as controls (C) B. Microarray hybridizations: 16 array hybridizations in double loop design with dye swaps were performed.
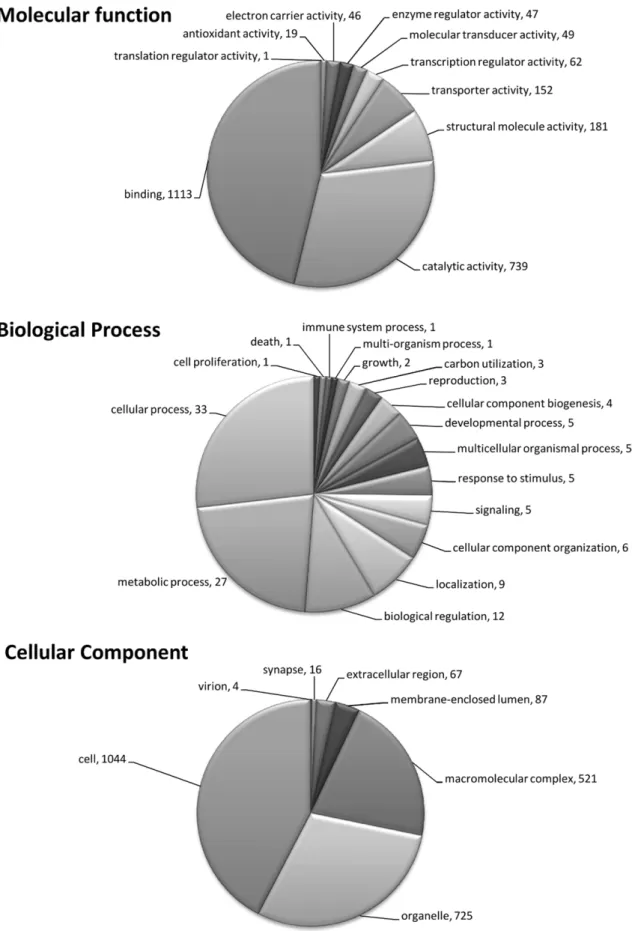
Figure 2. Graphical representation of annotation for version 2 of theB. glabratamicroarray. The pie charts illustrate the number of genes in each GO assignment for molecular function, biological process and cellular component, for those genes with known functions. Genes that were not assigned are not represented here and each individual sequence may have more than one assignment.
analysed using LIMMA (Linear models for microarray data, Bioconductor [56]). Print-tip loess normalization was used for within-array normalization [57] including log-transformation of the gene intensities. Moderated t-statistics were employed to assess change significance and a moderated f-statistic was used to test whether all contrasts were zero simultaneously, that is, whether there was no difference between strains before or after exposure or whether a gene showed an overall effect [58]. Within array
duplicates were averaged and showed a good correlation of 0.84. One array displayed weak hybridization and was thus removed from the analysis. LIMMA was also used to define and test for certain contrasts, e.g. the difference of the fold change susceptible/ resistant strains between the exposed and control groups (p-values were adjusted for multiple testing using the false Benjamini-Hochberg method [59], which controls the false discovery rate (FDR)).
Figure 3. Significant differentially expressedB. glabratahaemocyte genes identified from microarray comparisons. The Venn diagram shows the number of identified significantly differentially expressed genes in each category. Some genes were identified which were differentially expressed in more than one comparison and hence lie in the overlapping regions of the diagram. Key to symbols: R, resistant B. glabrata; S, susceptible B. glabrata; E, S. mansoni exposed snails; C, control snails. . greater than, , less than.
doi:10.1371/journal.pone.0051102.g003
Table 2. Genes identified as differentially expressed upon exposure to S. mansoni in resistant and susceptible B. glabrata strains.
Acc No Name Organism Blast match Acc No E value fc(RE/SE) fc(RC/SC) fc(RE/RC) fc(SE/SC)
EW997021 Unknown 2.67 3.81 25.89 24.12
EW997112 Unknown 2.21 2.78 24.32 23.43
CV548474 Unknown 3.10 3.19 25.58 25.43
EW997519 Unknown 1.74 1.27 21.94 22.66
EW997424 Unknown 3.86 1.41 1.15 22.37
EW997386 myosin II Nasonia vitripennis XP_001607303 5.45E235 3.02 1.16 1.18 22.21
EW997539 Unknown 2.49 21.04 1.13 22.29
EW997462 myosin II Placopecten magellanicus
2EC6-A 3.65E275 2.43 21.01 1.09 22.24 EW997421 alpha 2 actin Dicentrarchus labrax ACN66629 1.74E228 2.22 21.02 1.09 22.07 fc – fold change; fc figures inbold indicate a significant difference. Resistant control (RC); susceptible control (SC); resistant exposed (RE); susceptible exposed (SE). doi:10.1371/journal.pone.0051102.t002
Functional Analysis of Genes
Cluster analysis was performed in SeqTools (http://www. seqtools.dk/) using BlastN score values. Basic Local Alignment Search Tool (BLAST) searches, GO (gene ontology) and KEGG (Kyoto Encyclopaedia of Genes and Genomes) annotation and Interpro scans were performed using Blast2GO [60]. An annotation file was generated for the B. glabrata microarray (File S1).
Gene Set Enrichment Analysis
Gene set analysis for the data was performed using the Bioconductor function geneSetTest, which is available within the LIMMA library. The analysis was restricted to those GO terms that had at least 5 genes corresponding to them on the array (333 sets/terms overall). For each of the 5 comparisons (REvSE, RCvSC, REvRC, SEvSC and RE/SEvRC/SC) we tested whether the calculated p-values were more significant for the Gene Set/ GO-term in question than for a random selection of genes to generate a Gene Set p-value for each combination of GO-Term and each comparison, and an average p-value across all the genes for each comparison. P-values were adjusted for multiple testing using the Bonferroni method of correction.
FatiScan
FatiScan ([46,61], Babelomics: http://babelomics.bioinfo.cipf. es) was employed to identify significant asymmetrical distributions of biological labels (such as GO terms) associated with the ranked genes (based on fold change) for each comparison (REvRC, SEvSC, RCvSC and REvSE), using custom B. glabrata microarray annotations generated by Blast2Go.
Results
Annotation of Array Genes
Genes with significant homology to previously characterized genes have GO terms assigned to them on the basis of that homology (Fig. 2). This produced a reference set of annotations associated with the sequences of the genes spotted on the 5 K B. glabrata microarray (File S1).
Haemocyte Genes Differentially Expressed in Response to Parasite Exposure
mRNA from haemocytes of both control and schistosome-exposed resistant and susceptible snails was compared using the 5 K B. glabrata microarray (these data are available at ArrayEx-press Archive accession: Array A-MEXP-1401). From the analysis we identified genes that were differentially expressed between control and parasite exposed snails in both strains and between resistant and susceptible strains both for control and parasite exposed snails. The numbers of identified, and the classes in which they demonstrated differential expression, are summarized in the Venn diagram (Fig. 3). Firstly, genes expressed in haemocytes sampled 2 h post exposure to S. mansoni miracidia, were compared to unexposed controls to investigate the initial response of each snail strain to the parasite. Analysis of differential gene expression from the microarray identified 9 genes demonstrating a significant difference (p,0.01) in intensity between the compared samples in each category, with some genes located in more than one category (Fig. 3; see also Table 2). One gene (CV548474: unknown) was identified as having significantly higher expression in resistant snails before and after parasite exposure (R.S), and this same gene was also found to be down-regulated in both strains after exposure (E,C). Two genes (EW997021 and EW997112, both
unknown, Table 2) were identified which showed significantly higher expression in the resistant control snails (RC.SC) and were down-regulated in the resistant snails after exposure (RE,RC). Additionally, 6 genes were shown to be significantly down-regulated in susceptible snails after infection (SE,SC), which were expressed less in susceptible exposed compared with resistant exposed snails (RE.SE); these included 3 unknown genes, 2 myosin II heavy chain genes and 1 alpha actin gene (Table 2).
Differences between Schistosome-resistant and Schistosome-susceptible Strains
Secondly, comparison of haemocytes from schistosome-resistant and schistosome-susceptible snails (Fig. 3) revealed large numbers of genes to be differentially expressed between strains, before (196, comprising 96 resistant-specific, and 100 susceptible-specific transcripts) and after exposure (417, comprising 146 in susceptible and 271 in resistant snails). Additionally, 341 genes were differentially expressed regardless of schistosome infection (Fig. 3); without exception, all 187 susceptible-specific genes remained such either before or after exposure, as did all 154 resistant-specific genes (data not shown).
Genes found differently expressed between schistosome-resistant and schistosome-susceptible snails might be highly relevant for the interaction of those snails with S. mansoni. Differential levels of constitutive gene expression in haemocytes of the different strains before exposure may be responsible for the speedy response and elimination of S. mansoni in the resistant strain upon infection. In addition, differences between strains after exposure might give insight into the mechanism(s) of parasite elimination in resistant snails, since these are mounting a defence response; conversely, dissimilarities might indicate parasite interference with gene expression in susceptible snails. Therefore strain-specific differ-ences should not be dismissed, although it is important to remember that other resistant and susceptible snail strains may show different responses. Gene homologues were identified for these differentially expressed transcripts and all were assigned GO annotations based on these homologies. The genes with identified GO categories were then classified into functional groups accordingly (File S2). The main functional groups represented cluster genes for known immune/stress response proteins, extracellular matrix/adhesion components, cytoskeletal proteins, mitochondrial respiratory chain proteins, signalling proteins, transcription and translation proteins and proteins that facilitate protein folding and degradation (Fig. 4). Immune/stress response genes with greater expression in resistant snail haemocytes included peptidoglycan recognition protein 1, FREPs 1 and 2, gram-negative binding protein, allograft inflammatory factor 1, heat shock protein (HSP) 40, ferritin, and glutathione-s-transfer-ases (GSTs), all of which were differentially expressed irrespective of exposure, while FREPs 3 and 12, HSPs 70 and 90 showed greater expression post infection (File S2). Interestingly, HSP 60 was expressed to a greater extent in haemocytes of unexposed susceptible snails, with genes for the antimicrobial peptides hydramacin and neuromacin differentially expressed both before and after infection. Extracellular matrix/adhesion genes such as matrilin, dermatopontin 2, VWA domain-containing proteins and fibrillin were differentially expressed in resistant snail haemocytes with EGF-like domain containing protein, agrin, and a tandem repeat galectin showing lower expression after schistosome exposure. Unlike susceptible snails, a large number (45) of genes involved in mitochondrial respiration showed greater expression in haemocytes of resistant snails, with 24 of these showing greater expression post infection (Fig. 4). These genes included
cyto-chrome b, cytocyto-chrome C oxidase subunits I-III, NADH dehydro-genase subunits 1, 3, 4 and 5, and ATPase subunits (File S2). In terms of signal transduction, differences were more balanced between the two strains with 16 genes showing greater expression in resistant snail haemocytes across all exposure regimes, as opposed to 23 genes in the susceptible (Fig. 4). Notable genes in the resistant phenotype included the protein tyrosine kinase src and protein kinase D, with 14-3-3 protein, G-protein coupled receptor kinase 2, twitchin, titin and nuclear factor kB (NFkB) inhibitor differentially expressed only following infection (File S2). In susceptible snail haemocytes, genes for rho GTPase activating protein, IKAP, and phosphoglycerate kinase were differentially expressed, with a dual specificity kinase and transforming growth factor b (TGFb) receptor 1 involved only after infection (File S2). In terms of genes for cytoskeletal proteins, there was a preponderance of molecules involved in actin-related processes
in haemocytes of the resistant strain compared to tubulin-related molecules in the susceptible strain (File S2); this situation persisted post-infection. Finally, encompassing all GO categories, genes that displayed the largest differences in expression (3.5-fold or greater) between snails included FREP2, Gram-negative bacteria binding protein, GSTs, cytochrome b, NADH dehrogenase subunits 1 and 4, elastase 2, cystatin b, and endo 1,4 b glucanase in resistant snail haemoctyes, and polyprotein, endonuclease G, endonuclease mitochondrial precursor, and ATP-synthase-like protein, in susceptible snail haemocytes. HSP 90, and type 2 cystatin and fibropellin differed to such a degree only after infection for resistant and susceptible snail haemocytes, respectively (File S2).
Gene Set Enrichment Analysis
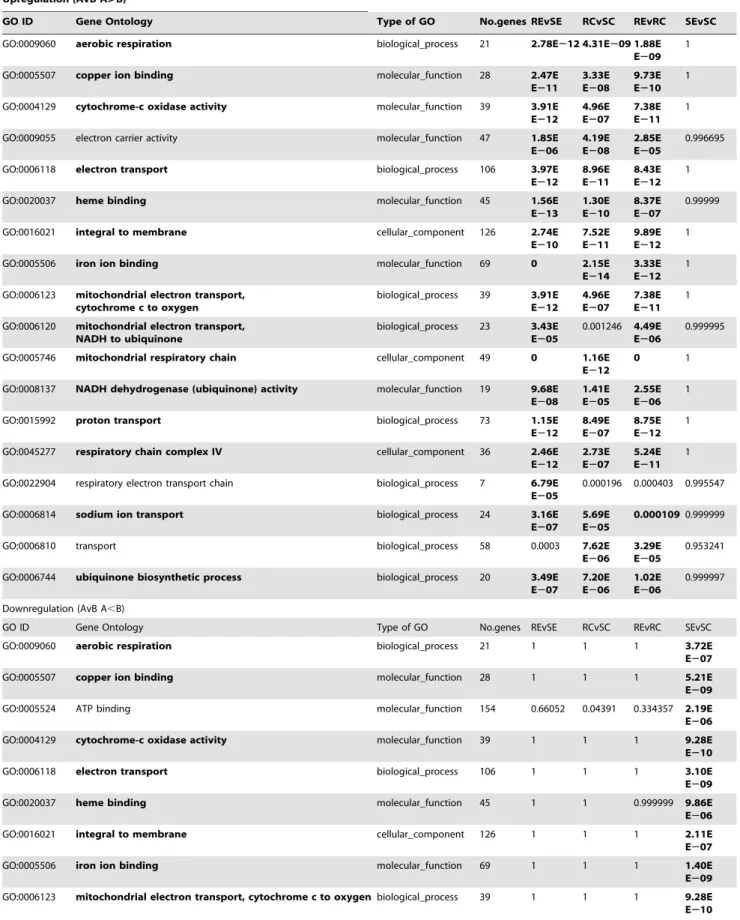
Gene set enrichment analysis (GSEA) [45], that identifies significant changes in expression of gene groups based on their function, rather than single genes, was employed for REvSE, RCvSC, RCvRE, SCvSC. We identified groups of GO terms (represented in bold in Table 3), all of which had higher expression levels in exposed resistant snails compared to unexposed (up-regulated on exposure), higher in resistant control snails compared to susceptible (strain-specific), higher in resistant exposed than susceptible exposed, and less in exposed susceptible snails than controls, (down-regulated in susceptible on exposure). Not every gene in each GO category followed the same trend, but the GSEA tests whether a significant number (more than would be expected by chance) are differently expressed in a particular category. For example, Fig. 5 illustrates 6 examples of GO categories in which the associated genes in general show positive fold changes (.+1) for REvSE, RCvSC and REvRC, and negative fold changes (.221) for SEvSC. This indicates that even between control and unexposed snails, expression in R was greater than S, and that a significant number of the associated genes are up-regulated post-exposure in the schistosome-resistant snails, but down-regulated in the schistosome-susceptible snails; there is also, therefore, an even larger difference in expression of these genes when comparing RE with SE, with resistant being greater than susceptible. The gene groups identified as following these trends are primarily involved in mitochondrial respiratory process and ubiquinone biosynthetic processes, both indicative of increased metabolic activity consistent with mounting a defence response.
FatiScan Analysis to Identify Trends in Gene Expression
FatiScan analysis [46] was used to detect asymmetrical distribution of GO categories from the fold change ranked list for each of the 4 haemocyte comparisons (RCvSC, REvSE, REvRC, and SEvSC). Distinct differences were identified between the snail strains both before and after infection, and the types of genes found to differ between haemocytes confirm the GSEA results (Fig. 6 A–B). Most striking, however, were the differences in response to the schistosome shown by the snail strains. Haemocytes of resistant snails exposed to S. mansoni showed an over-representation of haemocyte genes involved in mitochondrial respiratory processes and ubiquinone biosynthetic processes (Fig. 6C), demonstrating these are up-regulated in response to the parasite (as well as being already elevated in control resistant snails compared to susceptible), while in haemocytes of the susceptible snails these same genes were under-represented (Fig. 6D) indicating that their expression was suppressed by the parasite. This is also consistent with the findings of the GSEA analysis. FatiScan analysis of level 3 GO annotations also identified that the resistant exposed snails switched on immune response genes upon exposure to S. mansoni (Fig. 6E), again showing an active response to infection.
Figure 4.B. glabratagenes in different GO categories found to be differentially expressed. The number of differentially expressed genes in haemocytes from resistant (R) and susceptible (S) strains, before (C, control), both before and after (R/ S), and after S. mansoni exposure (E, exposed).
Figure 5. Gene set enrichment analysis (GSEA). The collated fold changes for each comparison (RE/SE, RC/SC, RE/RC, SE/SC) is shown for the genes in six selected GO categories. The order of the genes along the x-axis is arbitrary.
Table 3. Gene Set Enrichment Analysis (GSEA).
Upregulation (AvB A.B)
GO ID Gene Ontology Type of GO No.genes REvSE RCvSC REvRC SEvSC GO:0009060 aerobic respiration biological_process 21 2.78E212 4.31E209 1.88E
E209 1 GO:0005507 copper ion binding molecular_function 28 2.47E
E211 3.33E E208 9.73E E210 1 GO:0004129 cytochrome-c oxidase activity molecular_function 39 3.91E
E212 4.96E E207 7.38E E211 1 GO:0009055 electron carrier activity molecular_function 47 1.85E
E206 4.19E E208 2.85E E205 0.996695 GO:0006118 electron transport biological_process 106 3.97E
E212 8.96E E211 8.43E E212 1 GO:0020037 heme binding molecular_function 45 1.56E
E213 1.30E E210 8.37E E207 0.99999 GO:0016021 integral to membrane cellular_component 126 2.74E
E210 7.52E E211 9.89E E212 1 GO:0005506 iron ion binding molecular_function 69 0 2.15E
E214
3.33E E212
1 GO:0006123 mitochondrial electron transport,
cytochrome c to oxygen biological_process 39 3.91E E212 4.96E E207 7.38E E211 1 GO:0006120 mitochondrial electron transport,
NADH to ubiquinone biological_process 23 3.43E E205 0.001246 4.49E E206 0.999995 GO:0005746 mitochondrial respiratory chain cellular_component 49 0 1.16E
E212
0 1
GO:0008137 NADH dehydrogenase (ubiquinone) activity molecular_function 19 9.68E E208 1.41E E205 2.55E E206 1 GO:0015992 proton transport biological_process 73 1.15E
E212 8.49E E207 8.75E E212 1 GO:0045277 respiratory chain complex IV cellular_component 36 2.46E
E212 2.73E E207 5.24E E211 1 GO:0022904 respiratory electron transport chain biological_process 7 6.79E
E205
0.000196 0.000403 0.995547 GO:0006814 sodium ion transport biological_process 24 3.16E
E207
5.69E E205
0.000109 0.999999 GO:0006810 transport biological_process 58 0.0003 7.62E
E206
3.29E E205
0.953241 GO:0006744 ubiquinone biosynthetic process biological_process 20 3.49E
E207 7.20E E206 1.02E E206 0.999997 Downregulation (AvB A,B)
GO ID Gene Ontology Type of GO No.genes REvSE RCvSC REvRC SEvSC GO:0009060 aerobic respiration biological_process 21 1 1 1 3.72E E207 GO:0005507 copper ion binding molecular_function 28 1 1 1 5.21E E209 GO:0005524 ATP binding molecular_function 154 0.66052 0.04391 0.334357 2.19E E206 GO:0004129 cytochrome-c oxidase activity molecular_function 39 1 1 1 9.28E E210 GO:0006118 electron transport biological_process 106 1 1 1 3.10E E209 GO:0020037 heme binding molecular_function 45 1 1 0.999999 9.86E E206 GO:0016021 integral to membrane cellular_component 126 1 1 1 2.11E E207 GO:0005506 iron ion binding molecular_function 69 1 1 1 1.40E E209 GO:0006123 mitochondrial electron transport, cytochrome c to oxygen biological_process 39 1 1 1 9.28E E210
Table 3. Cont.
Upregulation (AvB A.B)
GO ID Gene Ontology Type of GO No.genes REvSE RCvSC REvRC SEvSC GO:0006120 mitochondrial electron transport, NADH to ubiquinone biological_process 23 0.99997 0.998755 0.999996 4.82E
E206 GO:0005746 mitochondrial respiratory chain cellular_component 49 1 1 1 0 GO:0005739 mitochondrion cellular_component 48 0.93988 0.800927 0.817296 8.18E
E206 GO:0008137 NADH dehydrogenase (ubiquinone) activity molecular_function 19 1 0.999986 0.999997 2.42E E207 GO:0015992 proton transport biological_process 73 1 0.999999 1 5.85E E214 GO:0045277 respiratory chain complex IV cellular_component 36 1 1 1 9.42E E211 GO:0006814 sodium ion transport biological_process 24 1 0.999943 0.999891 8.06E E207 GO:0006744 ubiquinone biosynthetic process biological_process 20 1 0.999993 0.999999 2.96E E206 GO:0005840 ribosome cellular_component 85 0.03859 1.20E
E205
0.723301 0.000821 GO:0006457 protein folding biological_process 21 0.00041 3.17E
E206
0.55687 0.00087 GO:0006094 gluconeogenesis biological_process 22 0.01078 3.09E
E205
0.163101 0.002104 GO:0005634 nucleus cellular_component 93 0.00057 7.58E
E208
0.533302 0.00296 GO:0006096 glycolysis biological_process 20 0.00633 2.13E
E205
0.220296 0.003285 GO:0003735 structural constituent of ribosome molecular_function 105 0.05398 6.79E
E206
0.970198 0.021822 GO:0006412 translation biological_process 98 0.04483 6.10E
E205
0.88094 0.028665 GO:0042254 ribosome biogenesis biological_process 108 0.04124 2.39E
E206
0.989179 0.03393 GO:0005615 extracellular space cellular_component 26 0.00024 0.000126 0.019181 0.044914 GO:0005515 protein binding molecular_function 240 0.00035 3.62E
E206
0.836396 0.33465 GO:0003743 translation initiation factor activity molecular_function 9 5.79E
E205
8.26E E206
0.278141 0.050926 GO:0006446 regulation of translational initiation biological_process 8 9.10E
E205
1.99E E205
0.249216 0.074297 GO:0051082 unfolded protein binding molecular_function 27 0.00013 2.34E
E205
0.878669 0.135328 GO:0003924 GTPase activity molecular_function 67 9.99E
E205
9.11E E205
0.262811 0.315466 GO:0007018 microtubule-based movement biological_process 47 9.39E
E206
3.30E E205
0.422782 0.744616 GO:0005874 microtubule cellular_component 59 6.63E
E206
1.04E E205
0.440339 0.745536 GO:0003723 RNA binding molecular_function 55 1.00E
E205
1.02E E205
0.730866 0.809142 GO:0051258 protein polymerization biological_process 32 3.37E
E206
0.000186 0.848843 0.988085
The gene ontologies (GO) listed were significantly different (adjusted p ,0.01) in at least one of the 4 comparisons. Significant p values (Bonferri adjusted) are shown in bold. GOs that were found to be up-regulated in resistant snails and down-regulated in susceptible are also shown in bold.
Discussion
The genes differentially expressed between haemocytes of the schistosome-susceptible and schistosome-resistant B. glabrata strains offer great insight into the complex molecular processes that are involved in the defence response to the parasite. Fifty-nine of the 98 genes that we identified in our initial investigation of strain differences using the considerably smaller (2 K versus 5 K) previous array platform [36] have been confirmed, and added to, by the current experiment. Again, we observed differential expression (elevated in resistant snails) of genes involved in energy metabolism, and transcription and translation indicating a general increase in cellular activity, consistent with generating the necessary components for mounting a defence response. Perhaps of greater interest is the finding of a considerably different response in susceptible and resistant snail strains as early as 2 hr post exposure to S. mansoni.
Stress response genes were identified in the set of genes that were present in the resistant snails both before and after exposure, as well as in the exposed resistant snails. FREPs, a unique family of molluscan calcium-dependent lectins, are known to be up-regulated following parasite infection and to bind to parasite surfaces [9], likely through interaction with parasite mucins [21,22]. Knockdown of FREP3 in B. glabrata resistant to E. paraensei by RNA interference (RNAi) resulted in a phenotype switch, whereby 31% of RNAi-treated snails became susceptible to the parasite [11]. Suppression of FREP3 in B. glabrata resistant to S. mansoni has also been shown to increase susceptibility to this schistosome with 20% of snails becoming infected [20]. Thus FREP3 seems to play some role in defence against S. mansoni concordant with the view that the primary function of fibrinogen-domain containing proteins in invertebrates is in protection against infection, rather than coagulation [62]. Here, we have demonstrated that FREP3 and FREP12 expression was greater in haemocytes of resistant snails compared to susceptible snails post miracidial exposure, whereas FREPS 1 and 2 were differentially expressed irrespective of exposure. Thus it seems possible that in the B. glabrata/S. mansoni infection model, FREP3 might represent a molecule vital to the maintenance of the resistance phenotype and that high levels of FREP expression in general might facilitate early parasite recognition.
Expression of a HSP 70 gene was also greater in resistant snail haemocytes after schistosome infection confirming of our previous findings [36,42], but this contrasts with the findings of Ittiprasert et al (2009), who demonstrated up-regulation of HSP70 in susceptible juvenile snails but not resistant [63]. Temperature stresses have also recently been suggested to affect susceptibility of snails to schistosome infection in conjunction with changes to expression levels of HSP transcripts [64]. Interestingly Zahoor et al (2010) demonstrated that S. mansoni ESPs, derived from larvae trans-forming from miracidia to mother sporocysts, reduced the quantity of HSP 70 protein in haemocytes of both snail strains 1 h after exposure to ESPs and that HSP 70 protein levels were also lower 35 days after infection [48]. Given that this molecule has important intracellular chaperone and extracellular immunomod-ulatory capacities [65], it would be valuable to elucidate the
temporal dynamics of schistosome infection on HSP 70 gene and protein expression in detail together with that for the three other differentially expressed HSP genes, in order to fully understand the role they may play in snail responses to schistosome infection.
Differential expression between haemocytes of resistant and susceptible control snails, of matrillin, dermatopontin and other transcripts involved in cell adhesion may also have a significant bearing on host-parasite interactions. Bouchut et al (2006) investigated gene expression of several cell adhesion genes in B. glabrata strains resistant or susceptible to E. caproni and found dermatopontin 2 and matrillin to be differentially expressed [66]; however, in their snail strains matrillin was over expressed in snails susceptible to a different parasite, E. caproni, and they hypothesized that susceptible snails may possess a more potent haemolymph coagulation system preventing or slowing haemocyte migration [66]. Here we identified six of the genes investigated by these authors as being significantly present in resistant control snails and three (two the same) that were different between haemocytes of resistant snails and susceptible snails both before and after exposure. Although different expression patterns were found in this study, it may emphasize the importance of these genes in snail-parasite interactions, although their roles are not currently clear. That fewer differentially expressed genes were found after exposure may suggest that the susceptible snails up-regulated these genes, whereas the resistant snails already expressed these genes, even in control snails. A gene for tandem repeat galectin showed greater expression in susceptible snail haemocytes after S. mansoni infection. This finding is curious given that these molecules are expressed on the surface of ,60% of B. glabrata haemocytes, that they bind the S. mansoni sporocyst tegument via interaction with surface-exposed LacNAc sugars, and that susceptible snail haemocytes do not encapsulate S. mansoni miracidia/sporocysts [33]. However, if developing larvae release sufficient LacNAc into the haemolymph during transformation, binding to the haemocyte receptors could serve to dampen recognition of and/or responses to the parasite either directly, or through interference of haemocyte signalling mechanisms as demonstrated for other sugar molecules [67,68]. Cell surface receptors such as integrins bind to extracellular matrix components and facilitate cell migration through tissues towards invading pathogens. These events are communicated intracellularly and cell movements, including encapsulation and phagocytosis, are then facilitated by actin and a variety of actin binding proteins. In this context it is notable that resistant snail haemocytes displayed a preponderance of genes involved in actin-related processes either in the presence or absence of schistosome infection. This implies that these haemo-cytes might display enhanced phagocytic and migratory capacity when compared to their susceptible snail counterparts benefiting the anti-parasite response.
The GSEA and FatiScan analyses also highlight that genes involved in mitochondrial respiration and ubiquinone degradation were already active in haemocytes of the resistant snails prior to schistosome exposure and that in these snails they were further activated, while in the susceptible snails they were suppressed, demonstrating a significant difference in the response of resistant and susceptible snails to schistosome exposure. Genes required for
Figure 6. FatiScan analysis illustrating gene expression fold change ranked lists fromB. glabratamicroarray comparisons using custom array annotation. A. Resistant control (RC) compared to susceptible control (SC). B. Resistant exposed (RE) compared to susceptible exposed (SE). C. Resistant exposed (RE) to resistant control (RC). D. Susceptible exposed (SE) compared to susceptible control (SC). E. RE compared to RC using level 3 GO annotations. Significantly differentially represented GO categories are listed for each comparison. Bar leading from the left, with GO category label on the left indicates over representation in the upper category (shown above each diagram), label on the right means under represented. Bar leading from the right and label on the right indicates over-representation in the lower category and label on the left under-represented.
copper, iron and heme-binding were also differentially expressed, although they may function in energy production too; for example, haemoglobins that possess a high oxygen affinity are present as blood respiratory proteins in B. glabrata [69]. Hanelt et al (2008) also found indications of up-regulation of heme and metal ion-binding in response to bacterial and S. mansoni challenge (12 hr post-exposure) [14]. Ferritin, also identified in resistant snails in earlier gene expression studies [44] and recently identified in an RNA-seq based approach to identify immune responses following bacterial or yeast challenges in B. glabrata [70] stores iron in a non-toxic form, enabling deposition of iron in a safe form and transport to areas where iron is required. Ferrous iron (Fe2+) is toxic to cells
as it acts as a catalyst in the formation of the hydroxyl free radical (OHN) from hydrogen peroxide (H2O2). Given the importance of
these reactive oxygen species to killing of S. mansoni sporocysts [8,28,71], greater ferritin expression could be relevant in terms of its capacity to affect the cellular balance of H2O2 and OHN
possibly influencing the outcome of infection. In the current study, resistant snail haemocytes were found to also differentially express GSTs that would serve as antioxidants to prevent cellular damage to the haemocytes. In the context of energy production, genes involved in respiratory chain and ATP production have been shown to differ between two oyster species that vary in their response to the parasite Perkinsus marinus [72]. The above suggests that the resistant snails were already expressing many of the genes required for defence responses prior to exposure.
This study provides the first evidence from global gene expression analyses that not only is there is a fundamental difference in the defence physiology between the snail strains used here before infection, but that the resistant snails actively respond to the schistosome, while the susceptible snails react in an opposing fashion by suppressing expression of the types of genes which are activated in a responding (resistant) snail, consistent with the notion that the schistosome is producing molecules that interfere with the snail’s defence response [68]. Hanington et al (2010) found that an initial (0.5–2 day post infection) up-regulation of immune/ stress response genes in susceptible B. glabrata was followed by a stronger down-regulation later during infection with S. mansoni, that was in contrast to E. paraensei exposed snails which showed down-regulation from 0.5 day post-infection [38]. They concluded that both parasites were able to interfere with host defense responses, but that E. paraensei was able to do this more rapidly and robustly than S. mansoni. Our results also suggest interference by the parasite, but in contrast to Hanington et al (2010) [38], we show that this phenomenon is occurring only 2 hours after exposure. Such early inactivation is coincident with early post-embryonic development of the parasitic sporocyst larval stage, a crucial phase when the schistosome lays down a new tegument and is perhaps more exposed to the host immune system while the snail is exposed to ESPs and ciliated plates released from schistosomes during their development [73].
In conclusion, this microarray experiment, by determining the expression of a large number of genes simultaneously, many more than can be investigated by qPCR, has enabled the construction of a framework of processes involved in haemocyte responses during the first phase of schistosome infection. The resistant snails, even before infection, express many different genes compared with
susceptible snails and in many respects seem to be primed and ready to respond to schistosome attack. The resistant snails also demonstrated activation of defence processes, while the susceptible snails displayed inactivation. Pinpointing individual genes signif-icantly affected by parasite exposure may have been made more difficult by biological variation both in schistosome penetration time (after addition of miracidia to snail water) and in individual snail responses since to obtain sufficient material it was necessary to pool haemocytes. Alternatively, the actual gene expression changes at this early stage after schistosome exposure, may be subtle and therefore difficult to detect resulting in a skewed outcome whereby strain-specific differences in gene expression outweighed parasite-induced changes. Nevertheless, by integrating GSEA and FatiScan analysis, the outcomes detailed in this paper have enabled a holistic view of changes in gene expression as a consequence of phenotype and exposure regime. Statistical analysis of clustered gene expression within any particular category has provided enhanced confidence in the relative importance of changes that might result in altered cellular physiology. In this way, this study provides a new way of assessing the complex biology of snail-schistosome interactions giving insight that will help future studies to identify mechanisms of compati-bility in this fascinating host-parasite system.
Supporting Information
File S1 Annotation file for the genes represented on the 5 KB. glabrata microarray.
(TXT)
File S2 Genes identified as significantly differentially expressed between resistant and susceptibleB. glabrata snails, before exposure (C-control), after exposure toS. mansoni (E-exposed) and both before and after (not affected by exposure). Genes with no known homologues are not shown. fc- fold change, figure in grey = no significant difference. *Genes previously identified as being significantly different between schistosome-resistant and -susceptible strains of B. glabrata [36]
(DOC)
Acknowledgments
We would like to thank Jayne King and Mike Anderson, NHM, for snail and parasite culture, and Julia Hughes and Steve Llewellyn-Hughes for using the Microlab Star robotic work station (Hamilton) to pick the clones. Microarrays were printed at the Department of Pathology, Cambridge University, by Anthony Brown.
Author Contributions
Conceived and designed the experiments: CSJ LRN DR AEL. Performed the experiments: AEL CSJ RAK. Analyzed the data: AEL AME CDM CSJ. Contributed reagents/materials/analysis tools: CSJ LRN DR GM CC CMA BH . Wrote the paper: AEL CSJ LRN DR AJW. Supplied clones for the fabrication of the microarray: GM CC CMA BH. Edited near complete manuscript for important intellectual content, and final approval of manuscript: GM CC CMA AEL AME RAK AJW CDM GM CC CMA BH DR LRN CSJ.
References
1. Chitsulo L, Loverde R, Engels D, Barakat R, Colley D, et al. (2004) Schistosomiasis. Nature Reviews Microbiology 2: 12–13.
2. Webster JP, Davies CM (2001) Coevolution and compatibility in the snail-schistosome system. Parasitology 123: S41–S56.
3. El-Ansary A, Al-Daihan S (2006) Important aspects of Biomphalaria snail-schistosome interactions as targets for antisnail-schistosome drug. Medical Science Monitor 12: RA282–RA292.
4. Lafferty KD, Kuris AM (2009) Parasitic castration: the evolution and ecology of body snatchers. Trends in Parasitology 25: 564–572. doi:10.1016/ j.pt.2009.09.003.
5. Webster JP, Woolhouse MEJ (1999) Cost of resistance: relationship between reduced fertility and increased resistance in a snail-schistosome host-parasite system. Proc R Soc Lond Ser B-Biol Sci 266: 391–396.
6. Lewis FA, Stirewalt M, Souza C, Gazzinelli G (1986) Large scale laboratory maintenance of Schistosoma mansoni with observations on 3 schistosome snail host combinations. J Parasitol 72: 813–829. doi:10.2307/3281829.
7. Lockyer AE, Jones CS, Noble LR, Rollinson D (2004) Trematodes and snails: an intimate association. Canadian Journal of Zoology 82: 251–269.
8. Bayne CJ (2009) Successful parasitism of vector snail Biomphalaria glabrata by the human blood fluke (trematode) Schistosoma mansoni: A 2009 assessment. Molecular and Biochemical Parasitology 165: 8–18.
9. Loker ES (2011) Gastropod immunobiology. Adv Exp Med Biol 708: 17–43. doi:10.1007/978-1-4419-8059-5_2.
10. Newton WL (1953) The inheritance of susceptibility to infection with Schistosoma mansoni in Australorbis glabratus. Experimental Parasitology 2: 242–257. 11. Theron A, Coustau C (2005) Are Biomphalaria snails resistant to Schistosoma
mansoni? Journal of Helminthology 79: 187–191.
12. Adema CM, Loker ES (1997) Specificity and immunobiology of larval digenean snail associations. Advances in Trematode Biology: 230 – 253.
13. Yoshino TP, Bayne CJ (1983) Mimicry of snail host antigens by miracidia and primary sporocysts of Schistosoma mansoni. Parasite Immunol 5: 317–328. 14. Hanelt B, Lun CM, Adema CM (2008) Comparative ORESTES-sampling of
transcriptomes of immune-challenged Biomphalaria glabrata snails. Journal of Invertebrate Pathology 99: 192–203.
15. Boswell CA, Bayne CJ (1985) Schistosoma mansoni - lectin-dependent cyto-toxicity of hemocytes from susceptible host snails, Biomphalaria glabrata. Exp Parasitol 60: 133–138.
16. Lie K, Heyneman D, Jeong K (1976) Studies on resistance in snails. 7. Evidence of interference with defense reaction in Biomphalaria glabrata by trematode larvae. J Parasitol 62: 608–615. doi:10.2307/3279428.
17. Loker ES, Cimino DF, Hertel LA (1992) Excretory-secretory products of Echinostoma paraensei sporocysts mediate interference with Biomphalaria glabrata hemocyte functions. J Parasitol 78: 104–115.
18. Zhang SM, Adema CM, Kepler TB, Loker ES (2004) Diversification of Ig superfamily genes in an invertebrate. Science 305: 251–254.
19. Hanington PC, Forys MA, Dragoo JW, Zhang S-M, Adema CM, et al. (2010) Role for a somatically diversified lectin in resistance of an invertebrate to parasite infection. Proceedings of the National Academy of Sciences of the United States of America 107: 21087–21092.
20. Hanington PC, Forys MA, Loker ES (2012) A somatically diversified defense factor, FREP3, is a determinant of snail resistance to schistosome infection. Plos Neglect Trop Dis 6. doi:10.1371/journal.pntd.0001591.
21. Mone Y, Gourbal B, Duval D, Du Pasquier L, Kieffer-Jaquinod S, et al. (2010) //000282271300016.
22. Mitta G, Adema CM, Gourbal B, Loker ES, Theron A (2012) Compatibility polymorphism in snail/schistosome interactions: From field to theory to molecular mechanisms. Dev Comp Immunol 37: 1–8. doi:10.1016/ j.dci.2011.09.002.
23. Bayne CJ, Hahn UK, Bender RC (2001) Mechanisms of molluscan host resistance and of parasite strategies for survival. Parasitology 123: S159–167. 24. Humphries JE, Yoshino TP (2008) Regulation of hydrogen peroxide release in
circulating hemocytes of the planorbid snail Biomphalaria glabrata. Developmental and Comparative Immunology 32: 554–562.
25. Zahoor Z, Davies A, Kirk R, Rollinson D, Walker A (2009) Nitric oxide production by Biomphalaria glabrata haemocytes: effects of Schistosoma mansoni; ESPs and regulation through the extracellular signal-regulated kinase pathway. Parasites & Vectors 2: 1–10. doi:10.1186/1756-3305-2-18.
26. Goodall CP, Bender RC, Brooks JK, Bayne CJ (2006) Biomphalaria glabrata cytosolic copper/zinc superoxide dismutase (SOD1) gene: Association of SOD1 alleles with resistance/susceptibility to Schistosoma mansoni. Molecular and Biochemical Parasitology 147: 207–210.
27. Bender RC, Goodall CP, Blouin MS, Bayne CJ (2007) Variation in expression of Biomphalaria glabrata SOD1: A potential controlling factor in susceptibility/ resistance to Schistosoma mansoni. Developmental & Comparative Immunology 31: 874–878.
28. Mone Y, Ribou A-C, Cosseau C, Duval D, Theron A, et al. (2011) An example of molecular co-evolution: Reactive oxygen species (ROS) and ROS scavenger levels in Schistosoma mansoni/Biomphalaria glabrata interactions. International Journal for Parasitology 41: 721–730.
29. Davids BJ, Wu XJ, Yoshino TP (1999) Cloning of a beta integrin subunit cDNA from an embryonic cell line derived from the freshwater mollusc, Biomphalaria glabrata. Gene 228: 213–223.
30. Davids BJ, Yoshino TP (1998) Integrin-like RGD-dependent binding mecha-nism involved in the spreading response of circulating molluscan phagocytes. Dev Comp Immunol 22: 39–53.
31. Plows LD, Cook RT, Davies AJ, Walker AJ (2006) Integrin engagement modulates the phosphorylation of focal adhesion kinase, phagocytosis, and cell spreading in molluscan defence cells. Biochimica Et Biophysica Acta-Molecular Cell Research 1763: 779–786.
32. Walker AJ, Lacchini AH, Sealey KL, Mackintosh D, Davies AJ (2010) Spreading by snail (Lymnaea stagnalis) defence cells is regulated through integrated PKC, FAK and Src signalling. Cell and Tissue Research 341: 131–145.
33. Yoshino TP, Dinguirard N, Kunert J, Hokke CH (2008) Molecular and functional characterization of a tandem-repeat galectin from the freshwater snail
Biomphalaria glabrata, intermediate host of the human blood fluke Schistosoma mansoni. Gene 411: 46–58.
34. Zahoor Z, Davies AJ, Kirk RS, Rollinson D, Walker AJ (2008) Disruption of ERK signalling in Biomphalaria glabrata defence cells by Schistosoma mansoni: Implications for parasite survival in the snail host. Developmental and Comparative Immunology 32: 1561–1571.
35. Baeza Garcia A, Pierce RJ, Gourbal B, Werkmeister E, Colinet D, et al. (2010) //20886098.
36. Lockyer AE, Spinks J, Kane RA, Hoffmann KF, Fitzpatrick JM, et al. (2008) Biomphalaria glabrata transcriptome: cDNA microarray profiling identifies resistant- and susceptible-specific gene expression in haemocytes from snail strains exposed to Schistosoma mansoni. BMC Genomics 9: 634. doi:10.1186/ 1471-2164-9-634.
37. Adema CM, Hanington PC, Lun C-M, Rosenberg GH, Aragon AD, et al. (2010) Differential transcriptomic responses of Biomphalaria glabrata (Gastropoda, Mollusca) to bacteria and metazoan parasites, Schistosoma mansoni and Echinostoma paraensei (Digenea, Platyhelminthes). Mol Immunol 47: 849–860. doi:10.1016/ j.molimm.2009.10.019.
38. Hanington PC, Lun C-M, Adema CM, Loker ES (2010) Time series analysis of the transcriptional responses of Biomphalaria glabrata throughout the course of intramolluscan development of Schistosoma mansoni and Echinostoma paraensei. International Journal for Parasitology 40: 819–831.
39. Lockhart DJ, Winzeler EA (2000) Genomics, gene expression and DNA arrays. Nature 405: 827–836.
40. Lockyer AE, Spinks JN, Walker AJ, Kane RA, Noble LR, et al. (2007) Biomphalaria glabrata transcriptome: identification of cell-signalling, transcription-al control and immune-related genes from open reading frame expressed sequence tags (ORESTES). Dev Comp Immunol 31: 763–782. doi:10.1016/ j.dci.2006.11.004.
41. Lockyer AE, Jones CS, Noble LR, Rollinson D (2000) Use of differential display to detect changes in gene expression in the intermediate snail host Biomphalaria glabrata upon infection with Schistosoma mansoni. Parasitology 120: 399–407. 42. Lockyer AE, Noble LR, Rollinson D, Jones CS (2004) Schistosoma mansoni:
resistant specific infection-induced gene expression in Biomphalaria glabrata identified by fluorescent-based differential display. Exp Parasitol 107: 97–104. doi:10.1016/j.exppara.2004.04.004.
43. Jones CS, Lockyer AE, Rollinson D, Noble LR (2001) Molecular approaches in the study of Biomphalaria glabrata-Schistosoma mansoni interactions: linkage analysis and gene expression profiling. Parasitology 123 Suppl: S181–196.
44. Lockyer AE, Spinks J, Noble LR, Rollinson D, Jones CS (2007) Identification of genes involved in interactions between Biomphalaria glabrata and Schistosoma mansoni by suppression subtractive hybridization. Mol Biochem Parasitol 151: 18–27. doi:10.1016/j.molbiopara.2006.09.009.
45. Subramanian A, Tamayo P, Mootha VK, Mukherjee S, Ebert BL, et al. (2005) Gene set enrichment analysis: A knowledge-based approach for interpreting genome-wide expression profiles. Proceedings of the National Academy of Sciences 102: 15545–15550.
46. Al-Shahrour F, Arbiza L, Dopazo H, Huerta-Cepas J, Minguez P, et al. (2007) //000245804600001.
47. Pan SCT (1996) Schistosoma mansoni: The ultrastructure of larval morphogenesis in Biomphalaria glabrata and of associated host-parasite interactions. Jpn J Med Sci Biol 49: 129–149.
48. Zahoor Z, Davies AJ, Kirk RS, Rollinson D, Walker AJ (2010) Larval excretory-secretory products from the parasite Schistosoma mansoni modulate HSP70 protein expression in defence cells of its snail host, Biomphalaria glabrata. Cell Stress & Chaperones 15: 639–650.
49. Mitta G, Galinier R, Tisseyre P, Allienne JF, Girerd-Chambaz Y, et al. (2005) Gene discovery and expression analysis of immune-relevant genes from Biomphalaria glabrata hemocytes. Developmental and Comparative Immunology 29: 393–407.
50. Hertel LA, Adema CM, Loker ES (2005) Differential expression of FREP genes in two strains of Biomphalaria glabrata following exposure to the digenetic trematodes Schistosoma mansoni and Echinostoma paraensei. Developmental and Comparative Immunology 29: 295–303.
51. Jung Y, Nowak TS, Zhang SM, Hertel LA, Loker ES, et al. (2005) Manganese superoxide dismutase from Biomphalaria glabrata. Journal of Invertebrate Pathology 90: 59–63.
52. Paraense WL, Correa LR (1963) Variation in susceptibility of populations of Austrolorbis glabratus to a strain of Schistosoma mansoni. Revista do Instituto Medicina Tropica Sao Paulo 5: 15–22.
53. Adema CM, Luo MZ, Hanelt B, Hertel LA, Marshall JJ, et al. (2006) A bacterial artificial chromosome library for Biomphalaria glabrata, intermediate snail host of Schistosoma mansoni. Mem Inst Oswaldo Cruz 101: 167 – 177.
54. Petalidis L, Bhattacharyya S, Morris GA, Collins VP, Freeman TC, et al. (2003) Global amplification of mRNA by template-switching PCR: linearity and application to microarray analysis. Nucl Acids Res 31: e142–e142. doi:10.1093/ nar/gng142.
55. Kerr MK, Churchill GA (2001) Experimental design for gene expression microarrays. Biostat 2: 183–201.
56. Smyth GK (2005) Limma: linear models for microarray data. In: Gentleman R, Carey V, Dudoit S, Irizarry R, Huber W, editors. Bioinformatics and Computational Biology Solutions using R and Bioconductor. New York: Springer. 397–420.
57. Smyth GK, Speed T (2003) Normalization of cDNA microarray data. Methods 31: 265–273.
58. Smyth GK (2004) Linear models and empirical Bayes methods for assessing differential expression in microarray experiments. Statistical Applications in Genetics and Molecular Biology 3: Article 3.
59. Benjamini Y, Hochberg Y (1995) Controlling the false discovery rate - a practical and powerful approach to multiple testing. Journal of the Royal Statistical Society Series B (Methodological) 57: 289–300.
60. Conesa A, Gotz S, Garcia-Gomez JM, Terol J, Talon M, et al. (2005) Blast2GO: a universal tool for annotation, visualization and analysis in functional genomics research. Bioinformatics 21: 3674–3676.
61. Medina I, Carbonell J, Pulido L, Madeira SC, Goetz S, et al. (2010) Babelomics: an integrative platform for the analysis of transcriptomics, proteomics and genomic data with advanced functional profiling. Nucleic Acids Research 38: W210–W213.
62. Hanington PC, Zhang S-M (2011) The primary role of fibrinogen-related proteins in invertebrates is defense, not coagulation. J Innate Immun 3: 17–27. doi:10.1159/000321882.
63. Ittiprasert W, Nene R, Miller A, Raghavan N, Lewis F, et al. (2009) Schistosoma mansoni infection of juvenile Biomphalaria glabrata induces a differential stress response between resistant and susceptible snails. Exp Parasitol 123: 203–211. doi:10.1016/j.exppara.2009.07.015.
64. Ittiprasert W, Knight M (2012) Reversing the resistance phenotype of the Biomphalaria glabrata snail host Schistosoma mansoni infection by temperature modulation. PLoS Pathog 8. doi:10.1371/journal.ppat.1002677.
65. Van Eden W, Wick G, Albani S, Cohen I (2007) //000251158200020.
66. Bouchut A, Roger E, Coustau C, Gourbal B, Mitta G (2006) Compatibility in the Biomphalaria glabrata/Echinostoma caproni model: Potential involvement of adhesion genes. International Journal for Parasitology 36: 175–184. 67. Plows LD, Cook RT, Davies AJ, Walker AJ (2005) Carbohydrates that mimic
schistosome surface coat components affect ERK and PKC signalling in Lymnaea stagnalis haemocytes. International Journal for Parasitology 35: 293–302. 68. Walker AJ (2006) Do trematode parasites disrupt defence-cell signalling in their
snail hosts? Trends in Parasitology 22: 154–159.
69. Lieb B, Dimitrova K, Kang HS, Braun S, Gebauer W, et al. (2006) Red blood with blue-blood ancestry: Intriguing structure of a snail hemoglobin. Proceedings of the National Academy of Sciences of the United States of America 103: 12011–12016.
70. Deleury E, Dubreuil G, Elangovan N, Wajnberg E, Reichhart J-M, et al. (2012) Specific versus non-specific immune responses in an invertebrate species evidenced by a comparative de novo sequencing study. PLoS One 7. doi:10.1371/journal.pone.0032512.
71. Mourao M, Dinguirard N, Franco GR, Yoshino TP (2009) Role of the endogenous antioxidant system in the protection of Schistosoma mansoni primary sporocysts against exogenous oxidative stress. PLoS neglected tropical diseases 3: e550.
72. Tanguy A, Guo XM, Ford SE (2004) Discovery of genes expressed in response to Perkinsus marinus challenge in Eastern (Crassostrea virginica) and Pacific (C. gigas) oysters. Gene 338: 121–131.
73. Walker A (2011) Insights into the functional biology of schistosomes. Parasites & Vectors 4: 1–6. doi:10.1186/1756-3305-4-203.