Development of Bio-Inspired Distributed Pressure
Sensor Arrays for Hydrodynamic Sensing
Applications
by
Jeff Ernest Dusek
B.S., Florida Atlantic University (2009)
S.M., Massachusetts Institute of Technology (2011)
ASSAHUSETSLNSTITUTEOF TECHNOLOGY
MAR 0
2
2016
LIBRARIES
ARCH1ES
Submitted to the Department of Mechanical Engineering
in partial fulfillment of the requirements for the degree of
Doctor of Philosophy in Mechanical and Ocean Engineering
at the
MASSACHUSETTS INSTITUTE OF TECHNOLOGY
February 2016
@
Massachusetts Institute of Technology 2016. All rights reserved.
Signature redacted
A uthor ...
...
Department of Mechanical Engineering
.4 A %l A
October 30, 2015
Signature redacted
Certified by... V...
Michael Triantafyllou
William I. Koch Professor of Marine Technology
Thesis Supervisor
Accepted by ...
Signature redacted
Rohan Abeyaratne, Quentin Berg Professor of Mechanics
Chairman, Department Committee on Graduate Theses
Development of Bio-Inspired Distributed Pressure Sensor
Arrays for Hydrodynamic Sensing Applications
by
Jeff Ernest Dusek
Submitted to the Department of Mechanical Engineering on October 30, 2015, in partial fulfillment of the
requirements for the degree of
Doctor of Philosophy in Mechanical and Ocean Engineering
Abstract
The performance of marine vehicles is largely influenced by interactions with the flow around their hull, both self-generated and environmentally driven. To improve perfor-mance through flow control, a detailed, real-time measurement of the near-field flow is necessary, yet such sensing capability is presently unavailable. Looking to nature for inspiration, fish employ the distributed pressure and velocity sensing capability of their lateral line sensory organ to mediate navigation and control behaviors that, if replicated, could benefit engineered systems. Through a series of towing tank and field experiments, it was found that while distributed pressure measurements on ma-rine vehicles enabled the detection of near-body flow phenomena, the size, cost, and mounting requirements of commercial sensors lead to sparse arrays and substantial gaps in the characterization of the flow field.
To address the challenges associated with obtaining spatially-dense pressure mea-surements on curved surfaces in marine environments, a new waterproof and confor-mal pressure sensor array was developed based on a closed-cell piezoresistive foam composed of carbon black-doped-silicone composite (CBPDMS foam). The response of the CBPDMS foam sensor arrays was characterized using periodic hydrodynamic pressure stimuli from vertical plunging and water waves, and a piecewise polyno-mial calibration was developed to describe the sensor response. The sensitivity and frequency response of the sensor arrays was also documented through a series of biologically-inspired hydrodynamic stimuli, including the flow from a dipole source, and the Karmin vortical wake flow behind a circular cylinder. The CBPDMS foam sensor arrays have significant advantages over existing commercial sensors for dis-tributed flow reconstruction and control. They are found to have sensitivity on the order of 5 Pascal, frequency range of 0.5-35 Hertz, are contained in a waterproof and completely flexible package, and have material cost less than $10 per sensor.
Thesis Supervisor: Michael Triantafyllou
Acknowledgments
First, I would like to thank my advisor Professor Michael Triantafyllou for his advice, mentorship, and unwavering support throughout my studies at MIT. I am grateful for his encouragement to pursue my interests, both academically and recreationally, and consider myself fortunate to have gained even a portion of his vast knowledge of hydrodynamics and ocean engineering. Special thanks must be extended to Professor Jeffrey Lang for his support in the development of sensor arrays, and for answering a never-ending series of questions about electronics, research directions, and career paths. I would also like to acknowledge Professor Franz Hover and Professor Dave Barrett for lending their expertise to my thesis committee and keeping me on track with their constructive feedback.
Over the course of my time at MIT I have had the extreme pleasure to collabo-rate with outstanding individuals at MIT and CENSAM in Singapore. I would like to thank Frank Yaul, Mandy Woo, Jessica Herring, and Matthew D'Asaro for sharing their knowledge of CBPDMS sensor fabrication and helping in the design and fabri-cation of my devices. In Singapore, Ajay Kottapalli, Mohsen Asadnia, and Vignesh Subramaniam not only helped with experiments, but made me feel genuinely welcome in their country.
I can say with certainty that I would not have been able to complete my degree
without the support and friendship of the members and friends of the Towing Tank group: Audrey Maertens, Haining Zheng, Vicente Fernandez, Dilip Thekkoodan, Heather Beem, James Schulmeister, Stephanie Steele, Amy Gao, Jacob Izraelevitz, Dixia Fan, Fangfang Xie, Jason Dahl, Gabriel Bousquet, Audren Cloitre, and Leah Mendelson. Not only did they provide assistance with research questions, but they became like family through multiple trips to Southeast Asia, daily group lunches, and adventures in skiing and running. I am truly grateful for their friendship.
Outside the lab, I am grateful for the staff of the MIT Sailing Pavilion and the members of the MIT Triathlon club for helping me maintain some balance in my life.
Reed, Arman Rezaee, and Alexei Bylinskii, who have helped make Boston feel like home.
Finally, and most importantly, I would like to thank my family. My parents for their love, support, and encouragement in everything I have pursued. No words can express my gratitude. My brother Brad for being a role model and everyday demonstrating hard work and perseverance. To my wife Lianne, who has supported me every step of the way, thank you for always encouraging me to pursue lofty goals-without you I wouldn't be where I am today.
I would also like to acknowledge the support of NOAA's MIT SeaGrant program,
The Singapore-MIT Alliance for Research and Technology (SMART), and the William
I. Koch chair for making this work possible.
Contents
1 Introduction 21
1.1 A Challenging Environment . . . . 21
1.1.1 Marine Vehicle Sensory Deficit . . . . 23
1.2 The Role of Marine Vehicles . . . . 23
1.3 A Biological Solution: The Lateral Line . . . . 25
1.3.1 Lateral Line Physiology . . . . 26
1.3.2 Behaviors Mediated by the Lateral Line . . . . 29
1.3.3 What are the lessons of the fish lateral line? . . . . 33
1.4 Bringing Lateral Line Inspired Capabilities to Marine Vehicles . . . . 34
1.5 Chapter Summary . . . . 35
1.6 Chapter Previews . . . . 36
2 Near-Body Hydrodynamics 39 2.1 Prior Work in Near-Body Flow Sensing . . . . 40
2.2 Detection of Leading Edge Vortex Shedding . . . . 43
2.3 Near-Body Hydrodynamics of an Unmanned Kayak . . . . 45
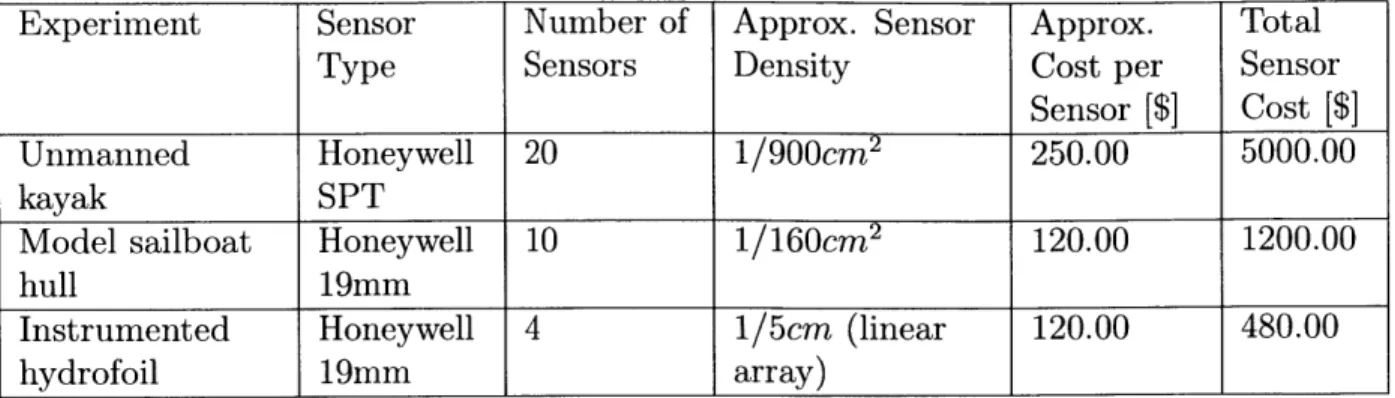
2.3.1 Introduction to Pressure Sensing on an Unmanned kayak . . . 45
2.3.2 Experimental Pressure Sensor Arrays Used on Unmanned Kayak V ehicle . . . . 48
2.3.3 Unmanned Kayak Vehicle . . . . 58
2.3.4 Commercial Pressure Sensors . . . . 59
2.3.5 Field Experiment Results . . . . 60
2.3.7 Lessons from Kayak Experiments for Next Generation Sensor
A rrays . . . . 72
2.4 Characteristic Examples of Near-Body Hydrodynamic Sensing . . . . 72
2.5 Chapter Summary . . . . 73
3 Distributed Pressure Sensor Arrays 75 3.1 Guidelines for Hydrodynamic Pressure Sensor A rrays . . . . 75
3.2 Review of Commercial Pressure Sensors . . . . 76
3.3 Prior Work in Lateral Line Inspired Sensors . . . . 80
3.3.1 Sensor Arrays Mimicking Lateral Line Physiology . . . . 80
3.3.2 Distributed Pressure Sensitive 'Smart-Skins' . . . 83
3.4 Collaborative Development of Doped Polymer 'Smart Skins' . . . . .. 87
3.4.1 Carbon Black-PDMS Composite . . . . 88
3.4.2 Material Development for Improved Sensitivity . . . . 90
3.4.3 Porous (Open-Cell) CBPDMS Foam . . . . 90
3.4.4 CBPDMS Sensor Results . . . . 93
3.4.5 Sensor Encapsulation . . . . 94
3.4.6 Two Dimensional CBPDMS Sensor Array . . . . 98
3.4.7 Conclusions from First Generation CBPDMS Open-Cell Foam 99 3.5 Lessons from Doped Polymer Smart-Skins . . . . 100
3.6 Chapter Summary . . . . 101
4 Closed-Cell CBPDMS Foam Sensor Development 103 4.1 Goals for Next Generation CBPDMS Foam Sensor . . . . 103
4.2 Closed-Cell CBDPMS Foam Sensor Arrays . . . . 104
4.3 CBPDMS Foam Array Sensing Principle . . . . 105
4.4 Models of Carbon Black Doped Silicone Piezoresistivity . . . . 107
4.4.1 DC Response of CBPDMS Composite . . . . 108
4.5 Sensor Fabrication . . . . 109
4.5.1 CBPDMS Foam Array Fabrication Steps . . . . 109
4.5.2 Electrode Layout and Material Selection . . . . 4.5.3 Electrode Fabrication . . . . 4.5.4 CBPDMS Foam Fabrication . . . . 4.6 CBPDMS Foam Material Properties . . . . 4.6.1 CBPDMS Foam Mechanical Properties . . . . 4.6.2 CBPDMS Foam Electrical Properties . . . . 4.7 Chapter Summary . . . .
5 CBPDMS Foam Sensor Array Characterization
5.1 Introduction . . . . 5.1.1 Characteristics of a Successful Sensor . . . .
5.2 Sensor Power and Amplification Electronics . . . . 5.2.1 Constant Voltage Source . . . .
5.2.2 Constant Current Source . . . .
5.2.3 Signal Amplification and Filtering . . . .
5.3 Vertical Plunging Experiments . . . .
5.3.1 Plunging Experimental Setup . . . .
5.3.2 Experiment Description and Parameters . . . .
5.3.3 CBPDMS Foam Array Response Characteristics . . .
5.3.4 Experimental Error in Plunging Results . . . .
5.3.5 Calibration of 7.8 mm (Thick) CBPDMS Foam Array
5.3.6 Calibration of 6.2 mm (Thin) CBPDMS Foam Sensor
5.3.7 Conclusions from Plunging Experiments . . . . 5.4 Water Wave Stimulus . . . . 5.4.1 Introduction . . . . 5.4.2 Water Wave Experimental Setup . . . . 5.4.3 Water Wave Pressure Field . . . .
5.4.4 Data Analysis . . . . 5.4.5 Calibrated Water Wave Results . . . .
5.5 Chapter Summary . . . . . . . . . 110 . . . . . 114 . . . . . 114 . . . . . 115 . . . . . 117 . . . . . 117 . . . . . 120 123 . . . . . 123 . . . . . 124 . . . . . 125 . . . . . 125 . . . . . 127 . . . . . 128 . . . . . 130 . . . . . 130 . . . . . 133 . . . . . 135 . . . . . 141 . . . . . 144 Array . 158 . . . . . 158 . . . . . 161 . . . . . 161 . . . . . 161 . . . . . 164 . . . . . 165 . . . . . 168 . . . . . 173
6 Dipole Experiments 177
6.1 Introduction and Literature . . . . 177
6.1.1 Dipole use in Biological Studies . . . . 177
6.1.2 Dipole use in Sensor Characterization . . . . 178
6.2 Experimental Setup . . . . 178
6.3 Dipole Flow Field . . . . 182
6.3.1 Flow Field Near a Wall . . . . 184
6.4 Dipole Experiment Results . . . . 187
6.4.1 Frequency Domain Results . . . . 188
6.4.2 Time Domain Results . . . . 198
6.5 Conclusions from Dipole Experiments . . . . 201
6.5.1 CBPDMS Foam Array Frequency Range . . . . 201
6.5.2 CBPDMS Foam Array Sensing Threshold . . . . 201
6.5.3 CBPDMS Foam Array Saturation . . . . 201
6.6 Chapter Summary . . . . 202
7 Karmain Vortex Street Identification 205 7.1 The Karman Vortex Street . . . 205
7.2 Biological Influence . . . . 206
7.3 Experimental Setup . . . . 207
7.4 Kairmain Vortex Street Three-Dimensionality . . . . 212
7.5 Effect of Sensor Protrusion on Flow Field . . . . 212
7.5.1 Experimental Measurements with Cylinder Absent . . . . 214
7.5.2 Numerical Simulations . . . . 216
7.6 Experimental Results with Cylinder . . . . 220
7.6.1 Data Analysis . . . . 220
7.6.2 Frequency Domain Results for U=0.1 m/s . . . . 223
7.6.3 Frequency Domain Results for U=0.15 m/s . . . . 225
7.6.4 Frequency Domain Results for U=0.2 m/s . . . . 226
7.6.5 Frequency Domain Results for U=0.3 m/s . . . . 227
7.7 Time Series Pressure Results. . . . 230
7.8 Chapter Summary . . . 232
8 Conclusion 237 8.1 O verview . . . . 237
8.2 Principal Contributions of the Thesis . . . . 239
8.2.1 Distributed Pressure Sensing for use in Near-Body Flow Mea-surem ent . . . . 239
8.2.2 Development of a Closed-Cell CBPDMS Foam Sensor Array 242 8.2.3 Experimental Validation of CBPDMS Foam Sensor Arrays as a New Tool for Hydrodynamic Sensing . . . . 244
8.3 Recommendations for Future Work . . . . 249
8.3.1 Reduction in Sensor Thickness . . . . 249
8.3.2 Improved Control of Dopant and Pore Distribution . . . . 249
8.3.3 Modified Electrode Dopant for Cost Reduction . . . . 250
8.3.4 Two-dimensional Sensor Arrays . . . . 250
8.3.5 CBPDMS foam array validation outside of laboratory . . . . . 251
A Thick CBPDMS Array (7.8 mm) Plunging Data 253
B Thin CBPDMS Array (6.2 mm) Plunging Data 261
C Thin CBPDMS Array (6.2 mm) Calibration Plots 269
List of Figures
1-1 Singaporean coastal waters . . . .
1-2 The lateral line distribution is shown for the Lake Michigan sculpin . . . . . . . 1-3 Hair cells within neuromasts . . . . 1-4 Superficial and canal neuromasts . . . .
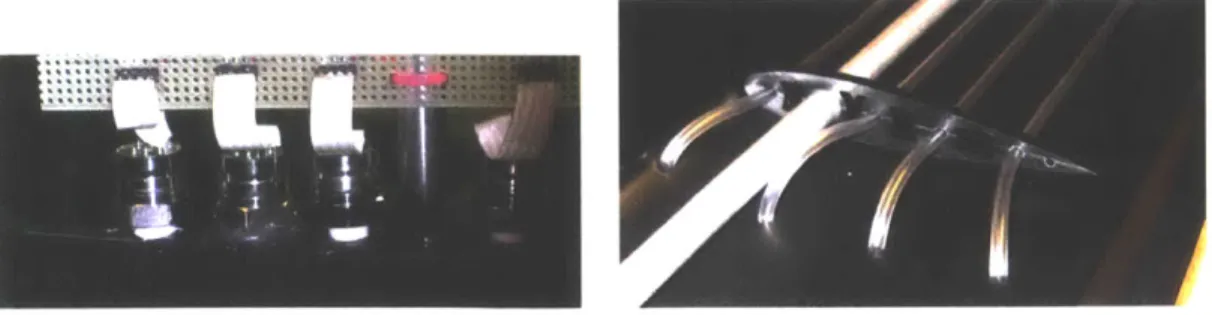
2-1 Lateral line inspired thermistor sensors . . . . 2-2 Instrumented model sailboat experiments . . . .
2-3 Instrumented hydrofoil for LEV shedding experiments . 2-4 PIV and pressure measurements of LEV shedding . . . 2-5 Helical vortex shed from model sailboat hull . . . .
2-6 LCP Sensor for unmanned kayak . . . . 2-7 PCB Sensor for unmanned kayak . . . . 2-8 LCP/PDMS packaging scheme calibration . . . .
2-9 PCB/PDMS packaging scheme calibration . . . .
2-10 Conductive polymer sensor for unmanned kayak . . . .
2-11 Conductive polymer sensor dimensions . . . . 2-12 Polymer sensor results . . . .
2-13 Unmanned kayak vehicle . . . .
2-14 Pool roll test of unmanned kayak . . . .
2-15 Pool roll test IMU data . . . . 2-16 Un-powered kayak experiments at Pandan reservoir . . 2-17 Unmanned kayak thruster noise . . . .
22 mottled . . . . 25 . . . . 27 . . . . 28 . . . . 40 . . . . 42 . . . . 43 . . . . 44 . . . . 47 . . . . 51 . . . . 52 . . . . 53 . . . . 54 . . . . 57 . . . . 57 . . . . 58 . . . . 59 . . . . 62 . . . . 63 . . . . 64 . . . . 65
2-18 2-19 2-20 2-21 3-1 3-2 3-3
Vehicle IMU data during port turn . . . .
Pressure data during port turn . . . . Comparison of commercial pressure sensor output and yaw acceleration Port circle frequencies . . . .
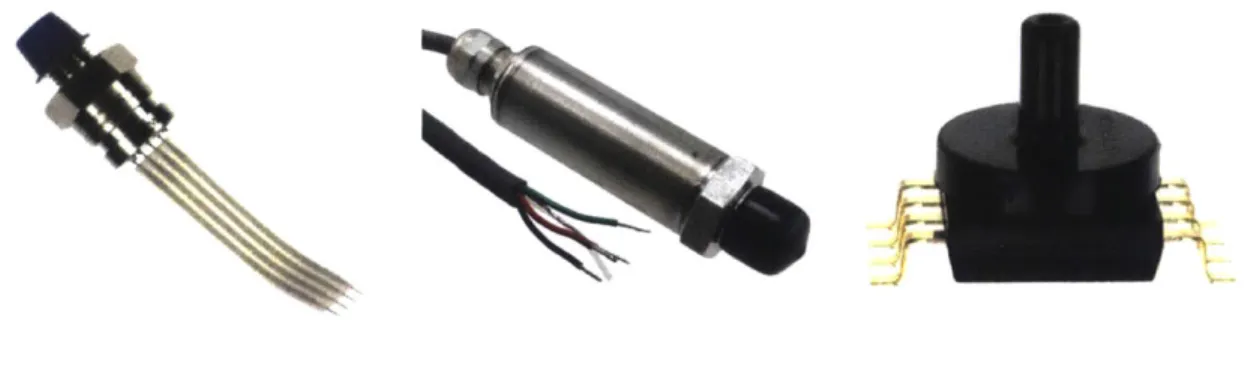
Commercial pressure sensors used in the MIT Towing Tank . . . . Challenges mounting commercial pressure sensors . . . . Commercial sensors deemed inappropriate for hydrodynamic sensing
applications
3-4 Comparison of commercial pressure sensors . . . . .
3-5 Sensors mimicking lateral line physiology . . . .
3-6 Artificial lateral line canals . . . .
3-7 LCP pressure sensor with helical gold strain gauges 3-8 Microstructured PDMS thin films . . . .
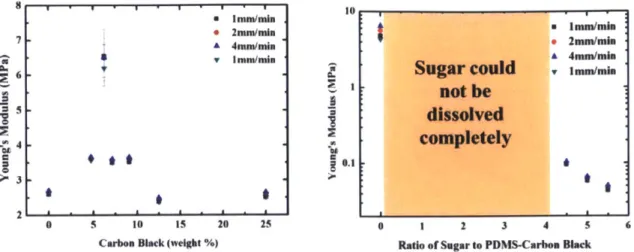
3-9 Version-one CBPDMS 'smart-skin' . . . . 3-10 Porous CBPDMS composite . . . . 3-11 Electrical properties of CBPDMS . . . . 0-12 IMAeclanical pUJ roperties 01' CBDIS . . . .
3-13 Open cell foam fabrication . . . .
3-14 Encapsulation of open-cell CBPDMS foam . . . . .
3-15 CBDPMS open cell foam wave tests . . . . 3-16 Two-dimensional CBPDMS array . . . . 4-1 4-2 4-3 4-4 4-5 4-6 4-7 4-8
Closed-cell CBPDMS foam sensor arrays . . . . Models of CBPDMS piezoresistivity . . . .
Ag-CBPDMS electrode fabrication steps . . . .
CBPDMS foam array four point measurement . . . Ag-CBPDMS electrodes . . . .
Closed-cell silicone foam fabrication . . . . Bench top tests of prototype closed-cell foam array
Closed-cell CBPMDS foam cellular structure . . . .
14 67 68 69 70 77 78 . . . . 7 9 . . . . 81 . . . . 82 . . . . 83 . . . . 84 . . . . 85 . . . . 89 . . . . 90 . . . . 91 . . . . 92 . . . . 95 . . . . 95 . . . . 96 . . . . 99 106 108 111 112 113 116 117 118
4-9 4-10 4-11 4-12 5-1 5-2 5-3 5-4 5-5 5-6 5-7 5-8 5-9 5-10 5-11 5-12 5-13 5-14 5-15 5-16 5-17 5-18 5-19 5-20 5-21 5-22 5-23 5-24 5-25
Material property testing of CBPDMS foam . . . . Stress-strain curve for 240 kg/m3 Soma Foama . . . . Electrical response of CBPDMS foam sample . . . . Comparison of CBPDMS array with commercial sensors . . . .
Sensor power and amplification electronics . . . . Norton and Thevenin equivalent circuits . . . . CBPDMS foam array raw voltage offsets . . . . Constant current source . . . . Amplification and filtration circuit . . . .
Plunging test setup . . . . Plunging experiment block diagram . . . . Plunging experiment premove . . . .
Plunging experiment pressure components . . . . Zager stage position and corresponding pressure . . . . Inverse relationship between resistance and pressure . . . . Pressure vs. voltage plots for 7.8 mm thick foam array in plunging . Plunging data for 7.8 mm thick array channel 2 with error . . . . . Cross-validation of polynomial order . . . . Polynomial curve fits with outliers . . . . Identification of outliers . . . .
Refined polynomial fits . . . . Polynomial calibration applied to plunging data . . . .
Piecewise polynomial calibration curves for thick array . . . . Piecewise polynomial calibration curves for thin array . . . . W ater wave test setup . . . .
CBPDMS foam array on a NACA 0020 foil . . . .
Experimental phase speed . . . . Sensor array response to water waves compared to plunging . . . . Water wave frequency response . . . .
119 119 120 121 126 127 129 130 131 132 133 134 136 137 140 142 145 147 149 151 152 154 157 159 163 164 167 169 170
5-26 Calibrated water wave time series results . . . . 171
5-27 Detail of calibrated water wave time series results . . . . 172
6-1 Dipole experimental setup . . . . 179
6-2 Dipole sphere velocity . . . . 180
6-3 Photo of perpendicular dipole setup . . . . 180
6-4 Diagram of dipole perpendicular orientation . . . . 181
6-5 Coordinate system for perpendicular dipole potential flow . . . . 183
6-6 Image sphere in perpendicular model . . . . 185
6-7 Potential flow results perpendicular with 18 mm separation . . . . 186
6-8 Potential flow results perpendicular with 18 mm separation and lateral sh ift . . . . 187
6-9 Potential flow results perpendicular with 5 mm separation . . . . 188
6-10 Dipole orientation for 18 mm separation and 0 mm lateral offset . . . 190
6-11 Dipole frequency domain plots for 18 mm separation and 0 mm lateral offset . . . . 192
6-12 Dipole orientation for 18 mm separation and +20 mm lateral offset 193 6-13 Dipole frequency domain results for 18 mm separation and +20 mm lateral offset . . . . 195
6-14 Dipole orientation for 5 mm separation and 0 mm lateral offset . . . 196
6-15 Dipole frequency domain results for 5 mm separation and 0 mm lateral offset . . . . 198
6-16 Reproduction of calibration for thin channel 4 . . . . 199
6-17 Dipole time domain results . . . . 200
7-1 The Karmain vortex street . . . . 206
7-2 Strouhal number dependence on Reynolds number . . . . 207
7-3 The Kairman Gait . . . . 208
7-4 Karmain vortex street experimental setup . . . . 210
7-5 MPXV series pressure sensors and calibration . . . . 211
7-6 Position of sensor arrays on NACA 0020 foil . . . . 212
7-7 7-8 7-9 7-10 7-11 7-12 7-13 7-14 7-15 7-16 7-17 7-18 7-19 7-20 A-1 A-2 A-3 A-4 A-5 A-6 B-1 B-2 B-3 B-4 B-5 B-6
Plunging data for 7.8 mm thick array channel 2 part 1 Plunging data for 7.8 mm thick array channel 2 part 2 Plunging data for 7.8 mm thick array channel 3 part 1 Plunging data for 7.8 mm thick array channel 3 part 2 Plunging data for 7.8 mm thick array channel 4 part 1 Plunging data for 7.8 mm thick array channel 4 part 2 Plunging data for 6.2 mm thick array channel 2 part 1 Plunging data for 6.2 mm thick array channel 2 part 2 Plunging data for 6.2 mm thick array channel 3 part 1 Plunging data for 6.2 mm thick array channel 3 part 2 Plunging data for 6.2 mm thick array channel 4 part 1 Plunging data for 6.2 mm thick array channel 4 part 2 Kairmain vortex street experiment images . . . . CBPMDS foam sensor mounted on NACA 0020 foil . . .
ATI Gamma force transducer . . . .
Three-dimensionality of Kairmain vortex shedding . . . .
Frequency spectra with no cylinder . . . . Lilypad simulation of foil behind cylinder . . . . Variation of standard deviation of Cp . . . . Data subset selection and filtering . . . . Frequency spectrum for un-filtered lift force . . . . Ka'rmain street results at U=0.1 m/s . . . . Kairmain street results at U=0.15 m/s . . . . Ka'rmain street results at U=0.2 m/s . . . . Kairmain street results at U=0.3 m/s . . . . Time series pressure measurements from vortex shedding
. . . . 254 . . . . 255 . . . . 256 . . . . 257 . . . . 258 . . . . 259 . . . . 262 . . . . 263 . . . . 264 . . . . 265 . . . . 266 . . . . 267
C-1 Polynomial curve fits with outliers for 6.2 mm thick array . 270 C-2 Identification of outliers for 6.2 mm thick array . . . . 271 213 214 214 215 216 218 219 222 224 226 228 229 231 235
C-3 Refined polynomial fits for 6.2 mm thick array . . . 272
C-4 Piecewise polynomial calibration curves for 6.2 mm thick array . . . . 273 C-5 Polynomial calibration applied to plunging data for 6.2 mm thick array 274
List of Tables
1.1 Unsteady flow examples at fish lateral line scale . . . . 38
2.1 Unsteady flow examples at unmanned marine vehicle scale . . . . 74
3.1 Commercial pressure sensor use in distributed pressure sensing exper-im ents . . . . 80
4.1 Physical dimensions of the CBPDMS foam sensor arrays. . . . 105
5.1 Current variation with constant voltage source . . . . 128
5.2 Parameter space for oscillatory plunging experiments. . . . . 135
5.3 Thick channel 2 calibration . . . . 148
5.4 Thick channel 3 calibration . . . . 148
5.5 Thick channel 4 calibration . . . . 150
5.6 Refined 3rd order calibration for thick array . . . . 153
5.7 Calibrated Plunging Results using Refined 3rd Order Calibration . . 153
5.8 Piecewise polynomial calibration for thick array . . . . 156
5.9 Calibrated plunging results using refined piecewise polynomial calibra-tion for thick array . . . . 156
5.10 Piecewise polynomial calibration for thin array . . . . 158
5.11 Calibrated plunging results using refined piecewise polynomial calibra-tion for thin array . . . . 160
5.12 Water wave voltage shift . . . . 167
5.13 Water wave DC voltage offset . . . . 168
5.15 Calibrated water wave results . . . 173
6.1 Dipole experiment parameters . . . 182
6.2 Dipole frequency domain results for 18 mm separation and 0 mm lateral offset . . . . 191
6.3 Dipole frequency domain results for 18 mm separation and +20 mm lateral offset . . . . 194
6.4 Dipole frequency domain results for 5 mm separation and 0 mm lateral offset . . . . 197
7.1 Parameter space for Kairmin vortex street identification experiments 209 7.2 Expected vortex shedding frequencies . . . 225
7.3 Frequency domain results for U=0.1 m/s . . . 225
7.4 Frequency domain results for U=0.15 m/s . . . 227
7.5 Frequency domain results for U=0.2 m/s . . . 227
7.6 Frequency domain results for U=0.3 m/s . . . 230
7.7 Time series pressure results . . . . 232
Jj. Jamma orce trandur kalbrati . . . . . . . . . . . . . . . . . . .2
D.2 MPXV pressure sensor calibration . . . . 276
Chapter 1
Introduction
1.1
A Challenging Environment
Operating in the ocean environment presents a unique set of challenges to engineering systems. Marine vehicles and structures are subject to highly dynamic fluid forces, corrosive surroundings, and potentially large hydrostatic pressures amongst a multi-tude of physical design considerations. Along with the physical effects operating in an often times harsh environment has on vehicle design and construction, the sensory and communication capabilities of marine vehicles are defined by the surroundings. Unlike terrestrial and aerial vehicles which utilize visual feedback for local naviga-tion and task execunaviga-tion, as well as radio frequency (RF) communicanaviga-tion for receiving operating commands, and data from the global positioning system (GPS), marine vehicles often operate at a sensory deficit, especially underwater.
Unlike in air, RF signals quickly attenuate underwater, leaving underwater vehicles without a means of untethered communication with operators on the surface, or reliant on technologies like acoustic modems that often times lack the performance of radio-based communications and are subject to environmental interference. Similarly, visual feedback is severely limited in many marine applications. When operating deep underwater, vehicles are faced with a lack of natural light, forcing the use of high powered illumination, which represent a substantial drain on energy resources. Similarly, in coastal areas turbidity often impairs the use of visual systems by severely
Figure 1-1: Environmental hazards such as turbid water, strong currents, and sudden squalls, combined with large numbers of anchored vessels and heavy maritime traffic make the waters off of the East Coast of Singapore particularly challenging for inarine vehicle operation.
reducing operational range. On the surface, quickly changing atmnospheric conditions and the potential for large waves and spray challenge traditional communication and navigation systems.
Of particular interest for this study are the Singaporean coastal waters and the Straits of Malacca. The Straits represent the primary shipping channel between the Indian and Pacific Oceans, connecting major world econolies such as Japan, China, and South Korea with India and the Middle East. Located at the tip of the Malaysian Peninsula, the strategic position of the Port of Singapore has led it to be the second busiest container port in the world according to Forbes [75]. The large volume of ships traversing the Straits and anchored off of Singapore's east coast, as seen in Figure 1-1, comibined with shallow, turbid water and strong currents make these coastal waters particularly hazardous to marine vehicle operations. Additionally, the tropical climate of Singapore is conducive to the formation of strong and rapidly forming storms which bring heavy rain and greatly reduced visibility. Because of the unique environmental challenges facing marine vehicles, a nieed exists for additional sensory systems that, allow for a better characterization of the highly dynamic surroundings, and help ensure safe and efficient operation.
1.1.1
Marine Vehicle Sensory Deficit
Overall, a significant challenge in the operation of marine vehicles off the coast of Singapore is that of a sensory deficit summed up below:
" Can't see:
Turbid water and tropical squalls greatly reduce visibility.
" Can't hear:
Shallow water and noise from biological and man-made sources negatively impact acoustic communication and navigation methods.
" Difficult to communicate:
Seawater greatly attenuates RF signals, impairing communication with un-derwater vehicles.
1.2
The Role of Marine Vehicles
Despite the difficulty of operating in the marine environment, marine vehicles play a crucial role across a variety of industries and applications. In the offshore indus-try unmanned underwater vehicles are relied on for a variety of tasks including the identification and mapping of hydrocarbon deposits, drilling wells, construction of wellheads and blowout preventer valves, and periodic inspection of underwater struc-tures throughout the operational life of the well
[90].
Marine researchers rely on underwater vehicles, both manned and unmanned, for the collection of biological and oceanographic data crucial to gaining a better understanding of the planet's ecosys-tems and climate. Autonomous underwater vehicles such as the Slocum Glider are increasingly relied upon for the collection of data over geographic and temporal scales exceeding the capabilities of traditional manned research cruises [46]. Autonomous underwater vehicles equipped with forward-looking sonar systems have also been uti-lized for ship hull inspection, eliminating the need to put divers in harm's way and enabling hull inspection during periods of poor visibility which would restrict thecapabilities of vision-based methods [83]. While the applications of marine vehicles are diverse and wide-ranging, in the context of the Singaporean harbors and littoral zones, several specific tasks stand out.
1. Detection and sampling of harmful algal blooms
Singapore has a strong seafood industry [43] that is dependent on the health of the coastal fisheries as well as near-shore aquaculture. Harmful algal blooms often lead to seafood kills that represent a risk to public health and the nation's economy [43, 78, 2].
2. Marine structure surveying and mapping
There is great interest in the autonomous surveying and mapping of surface and subsurface marine structures including piers, oil platforms, and harbor structures.
3. Port security and surveillance
As one of the busiest ports in the world, ensuring the safety and security of the Port of Singapore is a demanding task. The use of manned and uinmanned marine vehicles and novel sensors to enhance and streamline port security is of great interest.
4. Data collection for environmental model development and verification
A significant role of the Center for Environmental Sensing and Modeling (CENSAM) is the advancement of oceanographic and climate models for
trop-ical Southeast Asia. The dynamic nature of the troptrop-ical climate creates a sub-stantial challenge for modeling, and environmental data is needed to verify the model's performance. In general, the marine environment is highly under-sampled, and utilizing unmanned marine vehicles to carry out sample collection over large spatial and temporal scales will lead to better models through im-proved training and verification data.
Figure 1-2: The lateral line distribution is shown for the Lake Michigan mottled sculpin. Superficial neuromasts are shown as black dots, while the extent of the canal subsystem is shown in red (adopted from
[15]).
1.3
A Biological Solution: The Lateral Line
Solutions to complex engineering problems can often be found by looking to nature for inspiration. The application of biological principles to engineering systems, or bionimetics, is especially powerful when considering the marine environment which is inhospitable to humans, but contains an incredible degree of bio-diversity. The ability of fish to navigate the undersea world at high speeds and in close proximity to obstacles and other individuals is particularly attractive to ocean engineers seeking to enhance the perforinance of marine vehicles.
A fantastic example of a biological system overcoming a profound sensory deficit
is the ability of the blind Mexican Cave Fish (Astyanax fasciatus) to survive in subterranean caverns devoid of light. So complete is the visual deficit in the cave environment, the fish's eyes have atrophied away, leaving the species blind. In place of sight as a primary means for detecting and avoiding obstacles, the cave fish rely on their lateral line for navigation, feeding, and other essential behaviors [82, 69, 85]. The lateral line system found in all species of fish and some amphibians is a hair-cell based mechanosensory organ comprised of two primary subsystems: superficial neuromasts and canal neuromasts, as seen in Figure 1-2. While the two subsystems share physiological elements, they provide different information to the fish about the surrounding fluid flow, allowing for a wide variety of behaviors. For an in depth review of the lateral line, the work of Coombs et al. in [16] is highly recommended.
1.3.1
Lateral Line Physiology
Descriptions of the lateral line system in fish first appeared as early as the 17th century by Stenosis, who proposed mucus production as the primary function of the organ, a view that remained largely unchanged for nearly 200 years. In the mid 19th century, the sensory nature of the lateral line was identified by German anatomist Franz Leydig based on his discovery of large and easily identifiable sense organs in the head canal of the ruffe [57] (as discussed in [16]). Around the same time, a second type of sensory organ was identified on the skin surface of fish and aquatic amphibians by Schulze [77]. These two types of sense organs are now recognized as the two distinct subsystems of the lateral line: canal neuromasts (CN) and superficial neuromasts (SN).
The main building block of the distributed lateral line system are neuromasts, small epithelial organs which are composed of both mechanosensory hair cells and non-sensory cells. Each hair cell has a bundle of cilia extending from its surface composed of a single kinocilium and several shorter stereovili that are graded in length, providing a polarity to each individual hair cell, as seen in Figure 1-3(a).
Whn th4k11z kinoU11,1s11im t 10 dLecd away f1roim U1sterL iia, an exciuauory resp"1J1O 1s
generated and transmitted to the brain by nerves connecting to the neuromast. When the kinocililum is deflected towards the stereocilia, an inhibitory response is produced, creating a much different signal to the brain. Within a neuromast, individual hair cells are present in opposing orientations and are spatially distributed 1-3(c); defining an axis of greatest sensitivity for the neuromast, and providing directional sensing as discussed in [16].
A single elongated cupula covers the ciliary bundles of the hair cells and
pro-vides an interface between the neuromast and the surrounding environment. The size, shape, and length of cupulas vary considerably between superficial and canal neuromasts and between species of fish, as discussed in the chapter on lateral line morphology by Coombs in [16].
Kinocilium
I
Stereocilia/ Hair
Cell
(a) Each hair cell has a
bun-dIle of cilia extending from the
surface composed of a single kinocilium and several shorter stereovili that are graded in
length. Each hair cell is
di-rectional depending on the
ori-entation of the kinociliin and
the graded stereovili to the flow.
(b) Scanning electron inicrograph of the indi-vidual hair bundles that make up the sensory surface of the lateral line neuromast in a
inot-tied sculpin. The single kinocilium and graded
stereovili are visible, as well as the directional polarity of adjacent hair cells (from [15]).
Cupula Hair Bundles flair Cells
it
/<
(c) Each neuroinast is coIposed of many spatialy
distributed hair bundles of varying orientations
con-tained within a single elongated cupula (orange).
Figure 1-3: Superficial and canal neuroniasts are composed of niany hair cells and make up the building blocks of the lateral line sensory system.
Superficial Neuromasts
Superficial neuromasts are located on the surface of the skin and are directly exposed
to flow, as seen in Figure 1-4. Because the height of the superficial neuromast's cupula is generally around 50 jpm tall, the sul)erficial neuromasts reside in the boundary layer of the fish body as discussed iii the chapter by McHenry and Liao in [16] and by
Windsor in [85]. Superficial neuromast are generally considered as velocity sensors [7, 16], where the viscous drag of the fluid on the cupula causes deflections that stimulate the neuromast [85].
a Superficial Canal pore Flow
neuromast v Ccale ana neuromrast b Cupula C Cupula Hair bundle
It/
Hair ce! Hair10 pm 5O Pm
Hair cell
Figure 1-4: a) The lateral line system is composed of superficial neuromasts preseint on the skin of the fish and exposed to the flow field, an(d canal neuromasts which are present within canals beneath the skin and between l)ores. b) Superficial neuromasts are smaller than canal neuromasts and have a higher aspect ratio between base width and height. c) Canal neuromasts are generally the larger of the two types and slide
like a rigid body alonig the eI)ilthelium in the canal (from [16])
Canal Neuromasts
While the su)erficial neuromasts are located on the skii of the animal and are exposed to the mean flow, the canal subsystem com)rises a series of canals beneath the skin, comiected to the surface through an array of )ores. Whei ex)osed to a pressure gradient between adjacent pores, a local flow is induced in the canal, stimulating canal neuromasts located within the canal and between the pores [85, 74]. Because
28
of the shape of the canals, canal neuromasts are generally hemisphere shaped and quite large, as seen in Figure 1-4. When stimulated by a local induced flow, the canal neuromasts slide like a rigid body along the epilthelium of the canal, with the motion resisted by the spring-like dynamics of the cilia bundles in the hair cells [85]. The deflection of the canal neuromasts is proportional to the velocity within the canal, which is proportional to the pressure difference between pores [85, 74]. In this way, the trunk canal subsystem acts in a similar fashion to an array of differential pressure
sensors mounted on the animal's body in hydrodynamically sensitive regions [33].
Signal Filtering by the Lateral Line
The lateral line sensory system has been shown to provide a degree of 'filtering' to hydrodynamic stimulus. For the superficial neuromast subsystem, high-frequency components of the flow velocity are preferentially transmitted to the surface of the fish's body by the dynamics of the boundary layer, creating a 'high-pass' filter effect
[85, 74]. Due to their location within the lateral line trunk canals, canal neuromasts
are sensitive to pressure gradients between adjacent pores across a broad range of fre-quencies without interference from the boundary layer
[85].
Because of their response in proportion to flow accelerations, CNs preferentially sense high-frequency compo-nents of the flow and have the ability to filter out direct currents. Additionally, CNs are at least an order of magnitude more sensitive than superficial neuromasts, and exhibit a degree of low-pass filtering with a cutoff frequency that is determined by the shape and size of the canal and cupula, and is generally in the hundreds of Hertz[85].
For a thorough discussion of the frequency response of the lateral line system the chapter The Biophysics of the Fish Lateral Line by van Netten and McHenry in[85] is highly recommended.
1.3.2
Behaviors Mediated by the Lateral Line
Throughout most of the 19th and early 20th centuries, the lateral line was viewed as an accessory to hearing, specialized for low frequency sound [16]. This view
per-sisted, despite experimental work by German ichthyologist Bruno Hofer [42] that demonstrated the ability of blind Northern Pike (Esox lucius) to avoid obstacles and align to water currents (rheotaxis). Hofer's work, summarized in [16], provides some of the earliest experimental evidence that the lateral line responds to flowing water, and established obstacle avoidance and rheotaxis as behaviors mediated by the lateral line system.
Evidence that the lateral line plays an important role in obstacle detection and avoidance was reinforced by Dijkgraaf [23] (described in [16]) who termed the phrase "touch-at-a-distance" to describe the function of the lateral line. This descriptor of the lateral line remains an excellent one, as the distributed nature of the lateral line sensors has more in common with touch than hearing. Following the lead of the early pioneers of lateral line research, many studies have shown the role the lateral line plays in navigation, especially in the blind cave fish [82].
Continued study has shown that the lateral line contributes to a wide range of core behaviors in fish and amphibians, including feeding, predator avoidance, and communication. In each of these cases, the lateral line is detecting the hydrodynamic fields produced by other animals, an interaction that is limited to short-ranges when compared to hearing, as described in the chapter by Bleckmann in [16]. The lateral line has also been shown to sense large-scale water flows generated by wind and gravity
[16], as well as coherent flow structures generated by obstacles in the flow [58, 60].
Finally, the near-body flow sensing capabilities of the lateral line have been shown to play a role in cooperative behaviors such as spawning, parenting, and schooling [16].
Obstacle Detection and Avoidance
The blind Mexican Cave Fish provides an excellent example of the use of self-generated flows for 'hydrodynamic imaging' in low visibility environments [16, 88]. The distor-tion of a gliding fish's self-generated flow can be sensed by the lateral line and utilized
by the animal for obstacle detection and avoidance [82, 88, 69]. Through the
com-bined use of computational fluid dynamics (CFD) models and experimental studies utilizing particle image velocimetry (PIV) of fish swimming towards a wall [86], and
gliding parallel to a wall [87], it was found that fish could detect a wall 0.10 body lengths away, but not 0.25 body lengths away [87]. These results combined with the potential flow simulations by Hassan [39, 40], reinforce the ability of the lateral line to provide feedback for short-range object detection and avoidance.
Flow Synchronization and Alignment
The lateral line has been shown to contribute to the ability of fish to synchronize
with vortex structures in a flow field in order to reduce the energy cost associated with station keeping [59, 58]. Experiments found that when placed behind a flow obstruction generating a vortex wake, trout display unique body kinematics known as the Kirmin gait. Using electromyography along with a variety of visualization techniques, it was found that the trout exhibited less muscle activity when Kairmin gaiting behind a D-shaped cylinder when compared to swimming in a free stream [58]. The role of vision and the lateral line during the Kirmin gait behavior was studied using a pharmacologically blocked lateral line, and by performing experiments in the dark. It was found that the body kinematics of the fish Kairmain gait were altered when the lateral line was impaired and the experiments were performed in the light. However, when experiments were performed in the dark, fish preferred to entrain in the suction zone behind the cylinder for both intact and impaired lateral line cases. It was concluded that vision plays a role in the preference to associate with a vortex street, but the lateral line plays a larger role in affecting body kinematics during the Kairmain gait behavior [59].
The lateral line has also been found to play a role in the ability of fish to align with certain types of flows (rheotaxis). For fish in uniform flows of sufficient current to sweep them downstream, little hydrodynamic flow stimulus to the lateral line is generated, and visual stimulus is the primary source of feedback [16]. In slow moving flows insufficient to displace the fish, the lateral line is able to sense the flow relative to the body surface, enabling the fish to orient to the flow [70] (discussed in [16]). It was found that blocking the entire lateral line significantly increased the velocity threshold for rheotaxis behavior, while blocking only the canal neuromast system
had little to no effect, suggesting rheotaxis is primarily influenced by the superficial neuromast system. Further study has also suggested that the lateral line plays a role in rheotaxis in non-uniform flows [53].
Prey Detection and Predator Avoidance
The ability of surface feeding fish to localize prey trapped on the water surface by sensing concentric propagating surface waves via the lateral line was investigated by Bleckmann [6] using enucleated fish and a vibrating probe stimulus. It was found that determination of the direction of the wave source depends on the interaction of symmetrically located groups of receptors on either side of the top of the head, and that a characteristic change in the frequency spectrum of surface wave trains is the most dominant physical parameter of the stimulus relevant to localizing surface prey. Using Lake Michigan mottled sculpin, Cottus bairdi, Coombs found that canal neuromasts mediate the ability of fish to orient towards live pray or a vibrating sphere
[17].
The impact of the difference in lateral line physiology between the ruffe, a noctur-nal fish that live in turbid water, and the perch, a diurnoctur-nal shallow water fish, while responding to prey was investigated by Janssen, and it was found the ruffe detected prey at a greater distance than the perch, possibly due to membranes over the lateral line canal openings inhibiting self-generated flow noise from reaching the neuromasts
[45].
Just as the fish lateral line can detect the hydrodynamic signal created by prey, it can help in the detection and avoidance of predators as well. Experimental work using zebrafish larvae has shown that the accelerating flow created by a predator's strike is detected by the larvae's lateral line, allowing for an escape response that provides predator evasion during the vulnerable growing stage [68]. For a comprehensive review of prey localization on the surface and in midwater; as well as predator avoidance, the chapter by Bleckmann in [16] is recommended.
Cooperative Behaviors and Schooling
The short length scales of lateral line sensing make it an ideal candidate for enabling
cooperative short range interactions between neighboring animals. The role of the lateral line in spawning synchronization, young protection, and aggression is sum-marized in [16]. Of particular interest for application to engineering applications is fish schooling, and the ability to navigate rapidly in close proximity to neighbors. Comparing the ability of groups of fish to shoal before and after the entire lateral line system has been suppressed with an antibiotic treatment showed the fish with impaired lateral lines were unable to maintain a shoal (note: shoaling applies to fish swimming together in an unstructured manner, whereas schooling implies synchro-nized and polarized swimming, although a clear dichotomy does not exist) [30].
Schooling behavior in fish is often times a response to predator threat, and the lateral line is likely involved in the transmission of threat information throughout the school. Schooling has also been shown to have hydrodynamic benefits depending on the position of an individual in the school, as investigated computationally by Maertens in [64].
1.3.3
What are the lessons of the fish lateral line?
The fish lateral line provides an excellent example of a sensory system that has evolved to overcome the challenges of survival in a marine environment. The lateral line mediates behaviors in fish that enhance performance, reduce energy expenditure, and allow for survival in harsh conditions. When considering the current state of ocean engineering systems, achieving a mere fraction of the capabilities observed in fish is highly desirable. With the goal of reducing the sensory deficit faced by marine vehicles in mind, the fish lateral provides two primary lessons that can be applied to engineering systems.
1. Fish utilize the pressure stimulus generated by near-body hydrodynamic
2. The lateral-line is an example of a distributed pressure and velocity sensory system.
1.4
Bringing Lateral Line Inspired Capabilities to
Marine Vehicles
In order to achieve the lateral line mediated capabilities observed in fish with marine vehicles, advancements are needed in the characterization and utilization of near-body hydrodynamic pressure signals, as well as in the development of bio-inspired distributed sensor arrays. The fish lateral line and the behaviors it mediates provides an excellent motivation for the development of distributed sensor arrays, however the design requirements for arrays intended for marine vehicle use must be scaled appropriately to the hydrodynamic stimulus of interest, as shown in Table 1.1. The primary aim of this study is to answer the following questions:
1. Near-body Hydrodynamics
(a) What are the measurable near-hody flow structures that are ]Isful for
ocean engineering applications?
* To answer this question, a series of towing tank and field experi-ments were performed using distributed arrays of commercially avail-able pressure sensors. The results of these experiments will be pre-sented in Chapter 2, along with a review of previous work on the impact of near-body flow structures on marine vehicle operation. 2. Distributed Pressure Sensing
(a) What requirements should a distributed pressure sensor array fulfill for practical ocean engineering applications ?
* In Chapter 3, design guidelines for distributed pressure sensor arrays intended for marine applications are formulated based on the results of previous experiments utilizing commercially available sensors.
(b) Are current sensor technologies available and sufficient ?
* Commercially available pressure sensors are evaluated for use in hy-drodynamic sensing applications in Chapter 3. In particular, the size, cost, and mounting considerations of the commercial sensors used in the near-body flow sensing experiments in Chapter 2 are discussed. (c) What sensing principle can be developed and demonstrated specifically
for ocean engineering applications ?
o In Chapter 3, previous work in the development of doped-polymer 'smart-skin' pressure sensors is presented. An extension of soft-sensor fabrication techniques to marine applications, along with the develop-ment of a closed-cell foam sensing material, is introduced in Chapter 4. In Chapters 5, 6, and 7, closed-cell doped-polymer foam sensor arrays are evaluated for use on unmanned marine vehicles.
1.5
Chapter Summary
Due to the unique challenges of the maritime environment, marine vehicles face a sen-sory deficit compared to terrestrial and aerial vehicles. Despite limitations on the use of visual and auditory feedback systems and communication challenges underwater, unmanned marine vehicles are in high demand for applications including ship and structure inspection, port security, and scientific data collection. In nature, fish have overcome this sensory deficit by utilizing feedback from the lateral line sensory organ. Composed of two subsystems that act as distributed velocity and pressure sensor ar-rays respectively, the lateral line has been shown to mediate such complex behaviors as obstacle detection and avoidance, organism tracking, vortex wake synchronization, and cooperative schooling. Examples of the size scale and sensing performance of the fish lateral line system for representative applications are given in Table 1.1. With the goal of applying the lessons from nature to engineering systems, the subsequent chapters previewed below will investigate the use of distributed arrays of commercial
pressure sensors on marine vehicle hulls, and describe the development and character-ization of a closed-cell foam composite pressure sensor array for marine applications.
1.6
Chapter Previews
Chapter 2: Near-Body Hydrodynamics Chapter 2 discusses the performance
impacts of near-body flow structures on marine vehicles, and the need to sense and characterize these flow structures. Previous studies of the use of pressure sensing to characterize near body flow structures are discussed, and experi-ments conducted by the author using an instrumented model sailboat hull and instrumented hydrofoil are introduced. An experimental study of near-body flow sensing on an unmanned kayak vehicle using commercially available and experimental MEMS pressure sensor arrays is discussed in detail. Results of the laboratory and field experiments using commercial pressure sensors will provide size, dynamic range, and sensitivity guidelines for the development of distributed hydrodynamic pressure sensor arrays.
JIChapter 3:~i~ istrite Pressure SenDr Arr iays in ch~apter 3, guideinesc~ fur
the design and fabrication of distributed pressure sensor arrays for use in hy-drodynamic sensing applications are outlined. The guidelines are based on ex-perience gained from previous experiments with commercially available sensors, which are reviewed in the context of marine vehicle applications. Prior work in the development of pressure sensor arrays inspired by the fish lateral line is summarized, and the development of doped polymer 'smart-skin' pressure sen-sor arrays is introduced. The author's collaborative involvement in early stage 'soft-skin' sensor development and testing is discussed, and recommendations for next generation 'soft-skin' arrays are made.
Chapter 4: Closed-Cell CBPDMS Foam Development Chapter 4 presents the
extension of the soft-sensor fabrication techniques and materials introduced in Chapter 3 to marine vehicle applications. The expansion of 'smart-skin' pressure
sensor arrays to marine vehicles is provided by the development of an innova-tive waterproof and flexible closed-cell carbon black-silicone foam piezoresisinnova-tive composite. The piezoresistive behavior of the material is discussed, and the fabrication of a 4 x 1 pressure sensor array is outlined.
Chapter 5: CBPDMS Foam Sensor Array Characterization Chapter 5 describes
characterization experiments conducted on the CBPDMS foam sensor arrays using oscillatory pressure stimuli from vertical plunging and water waves. The repeatability of the sensor arrays is discussed, and a piecewise polynomial cali-bration is generated for the sensor array's response to hydrodynamic stimulus.
Chapter 6: Dipole Experiments Chapter 6 introduces the use of an oscillating
sphere as a biologically inspired pressure stimulus for testing the frequency range of the CBPDMS foam sensor array. A potential flow model of the pressure field generated by the oscillating sphere is presented for the sphere vibrating perpendicular to the CBPDMS foam sensor array, and in the vicinity of the sensor array and testing tank bottom. The frequency range of the CBPDMS foam sensor array is discussed, and the minimum RMS pressure for successful frequency identification is explored.
Chapter 7: Kairmin Vortex Street Identification Chapter 7 discusses the
sens-ing of a Kirmin vortex street by the CBPMDS foam sensor array. The biological relevance of vortex sensing and the fish Kirmain gait behavior is introduced, and measurements of vortex shedding frequency and pressure magnitude from the foam sensor array are compared to measurements from an array of commercial pressure sensors and measurements of the foil lift force.
Chapter 8: Conclusions Chapter 8 summarizes the need for distributed pressure
sensing for near-field flow measurement, and reviews the principle contributions of the thesis. Based on the results of the current study, recommendations for future work are made and discussed.
Application Scale Fish lateral line Example unsteady flow Energy extraction from vortices [60] Sensor spacing ~ 1-3 mm (Trout) Dynamic pressure [Pa] 10-30
Fish Prey tracking [15] 2 mni 0-15 30-100
lateral line (Mottled
Sculpin)
Unmanned Free vortex tracking < 6 cm 20-100 0.5-2
marine [33]
vehicles
Unmanned Leading edge vortex < 4 cm 40-200 0.25-3
marine shedding [27]
vehicles
Unmanned Separation from 5 cm 10-100 < 1 Hz
marine model sailboat hull
vehicles (L= 1 in, Fr= 0.16,
u= 0.5
i/s)
[31]Proposed Separation during 1.5 in 400 - 4000 < 1 Hz
ship-scale surface vehicle
marine maneuvering
application (L= 30 m, Fr= 0.16
in, u= 3 m/s)
Table I.1: The size and performance requirements for lateral line inspired hydrody-niamic sensor arrays are dependent on the scale of the vehicle or unsteady flow of interest. In nature, the fish lateral line canal subsystem (highlighted in red) has pore spacing on the order of imillimeters, and the dynainic pressure stimuli discussed in Section 1.3.2 are typically on the order of tens of pascals. In Chapter 2, examples of unsteady flows characteristic of unmanned marine vehicles on the scale of -1-3 in (ill grey) will be discussed in detail, and will serve as the foundation of design guidelines for hydrodynamic pressure sensor arrays that will be presented in Section 3.1. Pro-posed sensor array characteristics for a ship-scale application based on Froude scaling are also given for comparison (highlighted in green).
38
Frequency range [Hz]
Chapter 2
Near-Body Hydrodynamics
The interaction of marine vehicles with near-body flow structures has consequences for navigation in currents and cluttered environments, and for performance during maneuvers or while operating in dynamic flow conditions. Near-body flow structures can be self-generated as in the case of a helical vortex being shed from a vessel's keel line
[311,
or environmentally driven, as in the case of a vortex street shed behind an obstruction, or the vortex wake generated by a swimming fish. Examples of both types of interactions are present in nature and are exploited by fish, as described in Section 1.3.2. In particular, the ability of fish to identify obstacles and navigate in a cluttered environment is an excellent example of utilizing the impact on self-generated flow noise by nearby obstacles. Similarly, the ability of fish to exploit vortex wakes to reduce the energy cost of station keeping demonstrates the utility of measuring andutilizing coherent structures already present in the flow field.
In this chapter, previous work in near-body flow sensing will be reviewed, including previous studies by members of the towing tank group at MIT. Additionally, two experimental programs conducted by the author will be discussed. A brief summary of the experimental study of leading edge vortex shedding conducted in [27] will be offered, as well as a more comprehensive discussion of the experimental investigation of near-body flow sensing on an unmanned kayak conducted in Singapore and published in [26].