ecoinvent: Introduction
The ecoinvent Database: Overview and Methodological Framework
Rolf Frischknecht1*, Niels Jungbluth1, Hans-Jörg Althaus2, Gabor Doka3, Roberto Dones4, Thomas Heck4, Stefanie Hellweg5, Roland Hischier6, Thomas Nemecek7, Gerald Rebitzer8 and Michael Spielmann91ESU-services, environmental consultancy for business and authorities, Kanzleistr. 4, CH-8610 Uster
2EMPA, Swiss Federal Laboratories for Materials Testing and Research, LCA unit, Ueberlandstrasse 129, CH-8600 Duebendorf 3Doka Life Cycle Assessments, Stationsstrasse 32, CH-8003 Zürich
4Paul Scherrer Institute (PSI), Systems/Safety Analysis, CH-5232 Villigen PSI
5Swiss Federal Institute of Technology Zurich (ETHZ), Institute for Chemical and Bioengineering, HCI G129, CH-8093 Zürich 6EMPA, Swiss Federal Laboratories for Materials Testing and Research, LCA unit, Lerchenfeldstrasse 5,
CH-9014 St. Gallen
7Agroscope FAL Reckenholz, Life Cycle Assessment, Reckenholzstrasse 191, CH-8046 Zurich 8Swiss Federal Institute of Technology Lausanne (EPFL), ENAC-GECOS, CH-1015 Lausanne
9Swiss Federal Institute of Technology Zurich (ETHZ), Natural and Social Science Interface, HAD F4, CH-8092 Zurich
* Corresponding author ([email protected])
quired and consent identification. One main characteristic of the database is its transparency in reporting to enable individual assessment of data appropriateness and to support the plurality in methodological approaches.
Outlook. Further work on the ecoinvent database may com-prise work on the database content (new or more detailed data-sets covering existing or new economic sectors), LCI (model-ling) methodology, the structure and features of the database system (e.g. extension of Monte Carlo simulation to the impact assessment phase) or improvements in ecoinvent data supply and data query. Furthermore, the deepening and building up of international co-operations in LCI data collection and supply is in the focus of future activities.
Keywords: Database; ecoinvent; life cycle inventory data; Swit-zerland; uncertainty assessment
DOI: http://dx.doi.org/10.1065/lca2004.10.181.1 Abstract
Introduction. This paper provides an overview on the content of the ecoinvent database and of selected metholodogical is-sues applied on the life cycle inventories implemented in the ecoinvent database.
Goal, Scope and Background. In the year 2000, several Swiss Federal Offices and research institutes of the ETH domain agreed to a joint effort to harmonise and update life cycle inventory (LCI) data for its use in life cycle assessment (LCA). With the ecoinvent database and its actual data v1.1, a consistent set of more than 2'500 product and service LCIs is now available. Method. Nearly all process datasets are transparently documented on the level of unit process inputs and outputs. Methodological approaches have been applied consistently throughout the entire database content and thus guarantee for a coherent set of LCI data. This is particularly true for market and trade modelling (see, for example, electricity modelling), for the treatment of multi-output and of recycling processes, but also for the recording and reporting of elementary flows. The differentiation of diameter size for particulate matter emissions, for instance, allows for a more comprehensive impact assessment of human health effects. Data quality is quantitatively reported in terms of standard de-viations of the amounts of input and output flows. In many cases qualitative indicators are reported additionally on the level of each individual input and output. The information sources used vary from extensive statistical works to individual (point) measure-ments or assumptions derived from process descriptions. How-ever, all datasets passed the same quality control procedure and all information relevant and necessary to judge the suitability of a dataset in a certain context are provided in the database. Data documentation and exchange is based on the EcoSpold data for-mat, which complies with the technical specification ISO/TS 14048. Free access to process information via the Internet helps the user to judge the appropriateness of a dataset.
Concluding Remarks. The existence of the ecoinvent database proves that it is possible and feasible to build up a large interlinked system of LCI unit processes. The project work proved to be demanding in terms of co-ordination efforts
re-1 Introduction and Goal of the Paper
In late 2000, the project ecoinvent 2000 was officially launched. Several Swiss Federal Offices and research insti-tutes of the ETH domain agreed to a joint effort to harmo-nise and update life cycle inventory (LCI) data for its use in life cycle assessment (LCA). The work built on the experi-ence gained in the past with several previous LCI database projects of the involved institutions (Frischknecht et al. 1996, Frischknecht et al. 1994, Gaillard et al. 1997, Habersatter et al. 1996, 1998, Künniger, Richter 1995). In late 2003, and mid 2004, the first versions of the ecoinvent data sets (ecoinvent Data v1.01, and v1.1, respectively) have been published and made available in a central database accessible via the Internet. The ecoinvent database comprises LCI data covering differ-ent economic sectors and several up to date and widespread LCIA methods such as the Danish EDIP 1998, the Dutch Eco-indicator 99 and the CML characterisation scheme 2001, the Swedish EPS 2000 or the Swiss ecological scarcity 1997 and Impact 2002+. The assumptions required for their implemen-tation in ecoinvent and the matching with LCI results are docu-mented in Frischknecht et al. (2004b).
The present paper describes the goals and scope of the ecoinvent projects that led to the ecoinvent Data v1.1 (ecoinvent Centre 2004). With this respect, it is rather an overview than a scientific paper. Selected aspects regarding data modelling, uncertainty assessment, elementary flow representation and data format are described. The informa-tion given here are excerpts of the final reports on method-ology (Frischknecht et al. 2004a) and the code of practice (Frischknecht et al. 2004c). The following papers in this special issue focus on the main areas for which LCI data have been collected, namely non-renewable and renewable energy systems (Dones et al. 2004, Jungbluth et al. 2004), building materials (Althaus et al. 2004), metals (Althaus, Classen 2004), packaging materials (Hischier et al. 2004a), chemicals (Hischier et al. 2004b), agriculture (Nemecek, Erzinger 2004), transport services (Spielmann, Scholz 2004), and waste treatment and disposal (Doka, Hischier 2004).
2 Goal, Scope and Background of the ecoinvent Project 2.1 Goals of the ecoinvent Project
The Swiss Centre for Life Cycle Inventories has created the framework for combining and extending different LCI data-bases. The goal has been to generate a set of generic uni-form and consistent LCI data of high quality for the afore-mentioned areas (see Section 1), which is valid for Swiss and other European conditions.
Consistent, coherent and transparent LCA datasets for ba-sic processes make it easier to perform life cycle assessment studies, and increase the credibility and acceptance of the life cycle assessment results. The assured quality of the life cycle data and the user-friendly access to the database are prerequisites to establishing LCA as a reliable tool for envi-ronmental assessment, as the necessary backbone for an ac-tual realisation of life cycle approaches in practice, as for example, Integrated Product Policy (IPP, see Hischier, Gilgen 2004), and company internal applications.
Since a few years, a distinction between attributional (descrip-tive) and consequential (change-oriented or decision-oriented) life cycle inventory analysis is made (Ekvall 1999, Ekvall et al. 2004, Ekvall, Weidema 2004, Frischknecht 1997, 1998, Guinée et al. 2001). The ecoinvent database with its modular struc-ture supplying unit process information and their raw data as well as cumulative results is suited to support both de-scriptive as well as decision-oriented life cycle assessments.
2.2 Temporal, geographical and technical scope
The selection of goods and services to be analysed mainly relies on the market (and consumption) situation in Switzer-land (CH) for the year 2000. Because SwitzerSwitzer-land's economy is closely linked to the surrounding countries, a lot of proc-esses are also valid for the situation in Europe (RER), and some also for the situation in non-European countries. The latter is mainly the case for the extraction of mineral and energy resources that take place outside Europe. The refer-ence year 2000 was applied wherever possible.
Following the LCA approach, the geographical system boundary principally comprises the entire world. No region
has been excluded a priori. For some regions, however, data availability is rather poor. In such cases, processes could not be modelled with actual, country-specific data and assump-tions were needed.
The processes included in the ecoinvent database represent in most cases the average of technology in operation today (e.g. average of European oil refineries in operation in year 2000). In a few cases the average of technologies offered on the market today (e.g. gas boilers offered on the Swiss mar-ket in year 2000), the best available technology (e.g. gas combined cycle power plant), or even near future best avail-able technology (e.g. photovoltaic cells, low-sulphur fuels) are modelled additionally.
Emissions from the past1 (infrastructure construction), the present (e.g. heating) and the future (e.g. disposal options) are all included in the inventory analysis without temporal boundaries. Emissions that occur over large time horizons of substantially more than 100 years are assigned to specific subcategories. For emissions from landfill, uranium mining and milling sites, a timeframe of 60'000 and 80'000 years, respectively, is chosen. These processes release pollutants to 'air, low population density', to 'water, river' and to 'water, ground' over very long time scales. How these emissions are treated in currently available impact assessment methods is described in Doka, Hischier (2004).
3 Modelling Principles
The ecoinvent database contains LCI data that are represented to a large extent on the level of direct inputs and outputs of unit processes. Several methodological choices were necessary in order to make the international standards on LCA (Inter-national Organization for Standardization (ISO) 1997–2000) operational. The most important approaches are described in more detail in the following sections.
The analyses of technical processes required to manufacture goods and deliver services are based on pure environmental process chain analysis. According to ISO 14041 (International Organization for Standardization (ISO) 1997–2000) several criteria are used to decide which inputs are to be studied, in-cluding a) mass, b) energy, and c) environmental relevance. No strict quantitative cut-off rule is prescribed within the ecoinvent project. Environmental knowledge of the experts involved in compiling the LCI data is used to judge whether or not to include the production of a certain input or whether or not to include the release of a certain pollutant.
Goods and services are described on the level of economic regions within which such a distinction is meaningful. For cement, for instance, a national distinction is useful and meaningful because cement is hardly traded across national borders and trade movements are rather easy to identify. For globally traded products such as aluminium, a distinc-tion on the level of continental economies (Europe, Asia, Northern America) is sufficient because these commodities can hardly be traced back on a national or regional level.
1The terms 'past', 'present' and 'future' are used in relation to the time of
The situation in the year 2000 is used to determine the sup-ply and production mixes. Hereby the consumption of Swit-zerland and Europe defines the supply mixes of energy car-riers (such as crude oil, oil products, hard coal and lignite, natural gas, nuclear fuel), metals, chemicals, etc.
The production and trade situation of the year 2000 is also used for electricity mixes, although meteorological variance may influence the share of hydroelectric power production here. For oil and gas supply, the situation of the year 2000 is used, although large changes in the import situation of coun-tries may occur here as well. The choice of one single year increases the transparency and facilitates future updates. Elextricity mix datasets cover both the (national) produc-tion and supply situaproduc-tion, the latter including electricity im-ports. Additional to the busbar level, three voltage levels (high, medium, and low) are distinguished, which include transmission and network losses and SF6 emissions from switching stations.
Inputs and outputs required for the production means (ma-chinery, etc.) and the infrastructure of a production process are recorded separately. As far as possible, mass and energy flows of such equipment are shown on a per unit basis (e.g. one refinery with a capacity of 5 Mio. tons output per year, etc.). This approach allows for an easy change in the LCI data if the lifetime production of a particular infrastructure in- or decreases (e.g. 100'000 operating hours instead of 50'000). The separation between infrastructure processes and produc-tion processes has been introduced in earlier LCA works. However, the separation is not always clear. Thus, one might assume for instance the construction of a borehole as an infra-structure process because it is somehow similar to the con-struction of buildings or streets. On the other hand, drilling is a continuous action on oil and gas fields. Therefore, it would also be reasonable to see this as a part of the production proc-ess. With this respect, the ecoinvent classification of dataset to infrastructure and to operation is somewhat arbitrary. Transports happen almost between any two process steps of a product system. Generic transport datasets are available for air, rail, road and water transportation. In order to facilitate an easy application, all data are referred to the reference unit of one tonne kilometre employing average load factors. In the absence of detailed real market information, standard distances are applied on the ecoinvent LCIs. For most materials, 100 km with lorry plus 200 to 600 km with railway are assumed. Waste treatment is part of the technical system and is there-fore modelled as all other technical processes. It is part of the respective product systems. The processes deliver the service of waste treatment. If information on the treatment of specific wastes is not known, generic treatment processes are applied according to the list shown in Table 1.
Multi-output unit processes are entered into the database be-fore allocation. Additionally, the allocation factors applied are defined on the multioutput process level. The database creates single output processes with the help of multioutput process data and their allocation factors. Allocation factors are sepa-rately attributed to each individual input and output of a unit process. For recycling, the cut-off approach has been applied.
System expansion is avoided wherever possible. This is not due to the fact that the ecoinvent database is rather descrip-tive in nature, but rather due to principle reservations to-wards this approach (see Frischknecht 2000, Frischknecht, Jungbluth 2003, Jungbluth et al. 2004 for the substantia-tion of this statement). In most cases, allocasubstantia-tion according to 'other relationships' (according to the three-step proce-dure in ISO 14041, International Organization for Stand-ardization (ISO) 1998) is used. Where possible, processes have been split up in order to avoid allocation. For oil refin-eries, for instance, allocation factors have been determined on the basis of detailed mass and energy flows of the indi-vidual subprocesses such as atmospheric distillation, etc. Jungbluth et al. (2004) show the treatment of multi-output datasets in ecoinvent using an example of the photovoltaic product system.
4 Uncertainty Considerations
Variability and parameter uncertainty of unit process' in-puts and outin-puts, e.g. measurement uncertainties, process specific variations, temporal variations, etc., are expressed in quantitative terms on the level of individual inputs and outputs of unit processes. This type of uncertainty has been treated consistently and in a quantified way within the ecoinvent project. Lognormal distribution has been assumed for all unit processes of ecoinvent data v1.1.2
Quite often the uncertainty related to the amount of a spe-cific input or output cannot be derived from the available information, since there is only one source of information providing only a single value, without any further infor-mation. A simplified standard procedure has been developed to quantify the uncertainty for these (quite numerous) cases. The simplified approach includes a qualitative assessment of data quality indicators based on a pedigree matrix, that takes pattern from already published work (Pedersen Wei-dema, Wesnaes 1996).
Material Standard disposal route
plastics waste incineration
wood and particle board cardboard and paper
waste incineration
concrete and other mineral building materials (incl. gypsum)
datasets 'disposal, building, ..., to final disposal', include the dismantling/ demolition of the building, waste goes to inert material landfill, without recycling or sorting
glass inert material landfill
oils hazardous waste incineration
metals, if separable recycling
coating on metals recycling, disposal of the coating considered in the recycling process Table 1: Material specific waste treatment processes in the case of
miss-ing particular information
2According to Hofstetter 1998, p. 424, several reports in the field of risk
assessment and impact pathway analysis have shown that the lognormal distribution seems to be a more realistic approximation for the variability in fate and effect factors than the normal distribution. Because emission measurements do not show negative values, lognormal distribution was also applied on life cycle inventory data.
The square of the geometric standard deviation (95% inter-val – SDg95) is then calculated with the following formula:
with:
U1: uncertainty factor of reliability U2: uncertainty factor of completeness U3: uncertainty factor of temporal correlation U4: uncertainty factor of geographic correlation
U5: uncertainty factor of other technological correlation U6: uncertainty factor of sample size
Ub: basic uncertainy factor
The uncertainty estimations are given on a unit process level. The 95% confidence interval of cumulative LCI results is calculated with the help of Monte Carlo simulation (Hede-mann, König 2003). The 2.5% and the 97.5% values calcu-lated with Monte Carlo simulation are shown for each indi-vidual elementary flow.
The probabilistic mean values (i.e. the cumulative results de-termined with Monte Carlo simulation) differ slightly from the deterministic mean values (i.e. the cumulative results de-rived from the mean values of the unit process raw data with-out use of the uncertainty factors). It was decided to show the deterministic mean values in the ecoinvent database. This has the advantage that the mean values of the LCI results are re-producible. Furthermore, the reliability of the mean values of the unit process raw data is judged to be much higher as com-pared to the roughly estimated geometric standard deviation. For the time being, no minimum and maximum values are shown in the impact assessment results. Current impact assessment methods (except i.e. Goedkoop, Spriensma 2000, Huijbregts 2001, Steen 1999) do not often provide uncertainty informa-tion. The contribution of the uncertainty in the damage factors to the overall impact assessment results is judged to be at least as important, if not even more important, as compared to the uncertainty in the LCI results. Showing minimum and maxi-mum values on the level of LCIA results without considering the LCIA uncertainties would be strongly misleading.
5 Documentation of Elementary Flows
In the ecoinvent project, no predefined list of elementary flows3 is applied. Theoretically, all kinds of elementary flows can be registered. However, elementary flows contributing to the Basic uncertainty factors are used for the kind of input and
output considered. For instance, it is assumed that CO2 emissions generally show a much lower uncertainty as com-pared to CO emissions. While the former is usually calcu-lated from fuel input, the latter depends on numerous pa-rameters such as boiler characteristics, engine maintenance, load factors, etc. These basic uncertainty factors shown in
Table 2 are based on expert judgements.
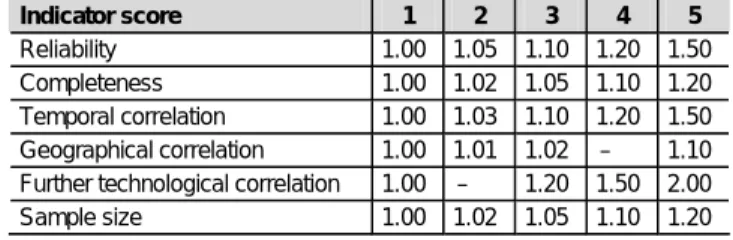
Data sources are then assessed according to the six charac-teristics of 'reliability', 'completeness', 'temporal correlation', 'geographic correlation', 'further technological correlation' and 'sample size'. Each characteristic is divided into five quality levels with a score between 1 and 5. Accordingly, a set of six indicator scores is attributed to each individual input and output flow (except the reference product) reported in a data source. An uncertainty factor (expressed as a con-tribution to the square of the geometric standard deviation) is attributed to each of the score of the six characteristics. These uncertainty factors are also based on expert judge-ments and are shown in Table 3.
Input / output group c p a
Demand of:
Thermal energy, electricity, semi-finished products, working material, waste treatment services
1.05 1.05 1.05
Transport services (tkm) 2.00 2.00 2.00
Infrastructure 3.00 3.00 3.00
Resources:
Primary energy carriers, metals, salts 1.05 1.05 1.05
Land use, occupation 1.50 1.50 1.50
Land use, transformation 2.00 2.00 2.00
Pollutants emitted to air:
CO2 1.05 1.05 SO2 1.05 NMVOC total 1.50 NOX, N2O 1.50 1.40 CH4, NH3 1.50 1.20 Individual hydrocarbons 1.50 2.00 Pm>10 1.50 1.50 Pm10 2.00 2.00 Pm2.5 3.00 3.00
Polycyclic aromatic hydrocarbons (PAH) 3.00
CO, heavy metals 5.00
Inorganic emissions, others 1.50
Radionuclides (e.g. Radon-222) 3.00
Pollutants emitted to water:
BOD, COD, DOC, TOC, inorganic compounds
(NH4, PO4, NO3, Cl, Na, etc.) 1.50
Individual hydrocarbons, PAH 3.00
Heavy metals 5.00 1.80
Pesticides 1.50
NO3, PO4 1.50
Pollutants emitted to soil:
Oil, hydrocarbon total 1.50
Heavy metals 1.50 1.50
Pesticides 1.20
Table 2: Examples of basic uncertainty factors (dimensionless) applied
for technosphere inputs and outputs and for elementary flows; c: combus-tion emissions; p: process emissions; a: agricultural emissions
Indicator score 1 2 3 4 5
Reliability 1.00 1.05 1.10 1.20 1.50
Completeness 1.00 1.02 1.05 1.10 1.20
Temporal correlation 1.00 1.03 1.10 1.20 1.50 Geographical correlation 1.00 1.01 1.02 – 1.10 Further technological correlation 1.00 – 1.20 1.50 2.00
Sample size 1.00 1.02 1.05 1.10 1.20
Table 3: Default uncertainty factors (contributing to the square of the
geo-metric standard deviation) applied in conjunction with the pedigree matrix
3Elementary flows are flows of pollutants and resources between
impact categories of noise, desiccation, depletion of biotic re-sources (except wood and biomass energy) and casualties, as well as of social indicators, are disregarded. This is mainly due to still unresolved methodological problems (and substan-tial data collection work is needed as, for instance, for noise impacts) or due to reduced relevance within the scope of the ecoinvent project (e.g. depletion of biotic resources). This section focuses on five issues, namely the specification of receiving compartments, the way particulate and VOC emissions to air and sum parameters for carbon compounds emitted to water have been recorded, and how fossil and biogenic carbon has been differentiated. The documenta-tion of elementary flows is mainly based on the work of the SETAC working group on data quality and data availability (de Beaufort-Langeveld et al. 2003, Hischier et al. 2001). The elementary flows are characterised with the help of com-partments and subcomcom-partments. Pollutants are emitted to the compartments of air, water, and soil. Furthermore, it is specified (with subcompartments) whether an air pollutant, for instance, is emitted to highly populated area, to a low populated area or to lower stratosphere / upper troposphere or to an unknown environment (unspecified). For water pollutants the subcompartments of river, lake, ground wa-ter and ocean are distinguished. For some subcategories (emissions to air, low population density, and emissions to groundwater) a temporal differentiation has been introduced. Emissions from landfills take place over a long time period after the waste placement. Emissions which take place 100 and more years after waste placement are named 'long-term'. Resources such as minerals, and primary energy resources, gases (e.g. CO2, nitrogen), and land transformation and oc-cupation are attributed to the category 'resource'.
Particulate emissions are consequently separated according to the diameter class. Three categories are distinguished, namely less than 2.5 micron, between 2.5 and 10 micron, and more than 10 micron. Therefore, there is no double count-ing of particulate emissions. It has to be noted that these classes do not coincide with the standard measurements which dis-tinguish between less than 2.5 micron (PM2.5), less than 10 micron (PM10) and total particulate matter (TPM). Further-more, the distinction between the three classes is often based on reference works and not based on actual measurements performed on exactly the processes analysed.
Because of its particular importance with respect to global warming, methane and non-methane volatile organic com-pound (NMVOC) emissions are at least accounted for sepa-rately. Further specifications within the NMVOCs are applied as far as possible. Among the large number of polycyclic aro-matic hydrocarbons, at least benzo(a)pyrene is recorded sepa-rately. Dioxins and furans are recorded as TCDD-equivalents. For CO2, CO, and CH4, a distinction is made between fossil and biogenic sources. For renewable (energy) sources, the amounts of emitted biogenic CO2 and CH4 are recorded sepa-rately. Process-specific CO emissions lead to reduced CO2 emissions. If relevant, this reduction is considered when cal-culating the CO2-emissions. Carbon fixing during biomass growth is recorded as a CO2 resource consumption.
In the ecoinvent inventories, all four sum parameters, BOD5, COD, DOC and TOC, are recorded in parallel (i.e. without any reductions due to separately reported individual sub-stances).4 If necessary (no sum parameter measurements avai-lable) they are calculated from the information given for individual water pollutants. For that purpose, the stoichio-metric oxygen demand for the oxidation is calculated as an assessment for COD and BOD5, respectively. The amount of TOC and DOC is determined from the carbon content of the individual substance and based on the recommendations of de Beaufort-Langeveld et al. (2003).
Missing data are added according to the (worst case) relation-ship of DOC=TOC and BOD5=COD. Additionally, all indivi-dual substances are recorded in the inventory. For the assess-ment of aquatic eutrophication or other impacts, it is sufficient to select one of the above-mentioned sum parameters. No double counting occurs as long as only one parameter and no individual substances are considered for this assessment.
6 ecoinvent Data Format and Access to the Database
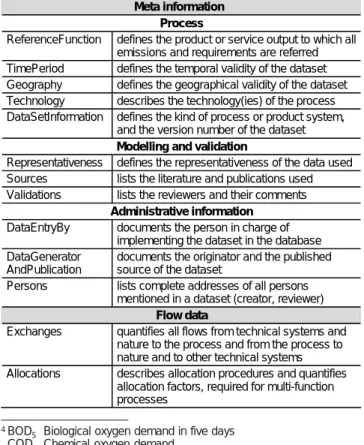
A process, its products, and its life cycle inventory data, but also impact assessment methods, are documented using the ecoinvent data format (EcoSpold), which complies to a large extent with the technical specification ISO/TS 14048. The basic structure is shown in Table 4. The EcoSpold data for-mat sections 'Process' and 'Flow data' correspond to the sections 'process description' and 'Inputs and outputs' of ISO/TS 14048, and both formats comprise the sections 'Mod-elling and validation' and 'Administrative information'.
Meta information Process
ReferenceFunction defines the product or service output to which all emissions and requirements are referred TimePeriod defines the temporal validity of the dataset Geography defines the geographical validity of the dataset Technology describes the technology(ies) of the process DataSetInformation defines the kind of process or product system,
and the version number of the dataset Modelling and validation
Representativeness defines the representativeness of the data used Sources lists the literature and publications used Validations lists the reviewers and their comments
Administrative information DataEntryBy documents the person in charge of
implementing the dataset in the database DataGenerator
AndPublication
documents the originator and the published source of the dataset
Persons lists complete addresses of all persons mentioned in a dataset (creator, reviewer)
Flow data
Exchanges quantifies all flows from technical systems and nature to the process and from the process to nature and to other technical systems Allocations describes allocation procedures and quantifies
allocation factors, required for multi-function processes
Table 4: Structure of the EcoSpold data format
4BOD
5 Biological oxygen demand in five days
COD Chemical oxygen demand DOC Dissolved organic carbon TOC Total organic carbon
The ecoinvent guests have the possibility to view the proc-ess description on-line via the Internet (see Table 4, and www.ecoinvent.ch). Links within the respective html-docu-ments facilitate the navigation. This preview helps to judge whether or not the process is of interest and suited for the intended application, and whether or not it is worthwhile to purchase an ecoinvent licence and become an ecoinvent member. The ecoinvent members have online access to the flow data (and the process information) of all ecoinvent datasets and are able to download them. They also get a CD-ROM with the extensive documentation (final reports) of all datasets available in the database.
Once one or several datasets are chosen for download, they are converted to one XML-file5 and can be saved on the local computer. XML schemes facilitate data exchange between dif-ferent LCA-databases and LCA-softwares. It can easily be extended by LCA-software-specific requirements. Upward and downward compatibilities of extended versions of the format to the current version pose no major problems.
7 Concluding Remarks
The results of the ecoinvent 2000 project show that the devel-opment of large LCI and LCA databases on the basis of com-plete process networks and the supply of LCI data on a unit process level is possible and in demand. The project work proved to be demanding and a high level of co-ordination efforts were required to achieve the quality level we aimed at. Compiling a large number of datasets for a consistent back-ground, LCI database calls for conventions and simplifica-tions. Some of them, in particular the ones on reporting el-ementary flows, have consequences on the implementation of life cycle impact assessment methods. The quantification of uncertainty (based on a lognormal distribution and the deter-mination of a geometric standard deviation) is to a large ex-tent derived from a qualitative assessment of the data quality. The minimum and maximum values of the LCI results are to some extent determined by the underlying assumptions. Some methodological issues of life cycle inventory analysis are still under discussion such as allocation and recycling. The approaches described in this paper and applied on the ecoinvent data v1.1 show one way to create large and con-sistent sets of generic LCA data.
The ecoinvent database features transparent reporting. Trans-parency of the data does not imply high quality and best suit-ability of all datasets in any case. However, it allows for an assessment and personal judgement of the suitability and ap-propriateness of a dataset to a certain context. If the way a dataset has been modelled in ecoinvent does not suit the pur-pose or the opinion of an LCA practitioner, he or she may adapt the unit process data according to his or her needs. In that way, it serves the plurality within the LCA community (including LCA commissioners). Depending on the personal opinion, this can be judged as an advantage (no one is forced to apply data based on one particular school) or as a drawback (LCA and LCI in particular produces not one but several valid results).
8 Outlook
Developments for future versions of the ecoinvent database and its content can be classified in the following eight areas:
− improvement and further specification of existing process datasets
− additional datasets in economic sectors already covered in ecoinvent v1.1
− process datasets covering additional economic sectors
− process datasets on prospective technologies
− extension of energy, materials, transports, waste treatment datasets to other economies
− additional impact assessment methods
− additional elementary flows or compartments for elementary flows
− improvements in the ecoinvent database system
− improvements in data supply and data query
The extension of Monte Carlo simulation to the impact as-sessment is one example of improvements in the ecoinvent database system. As soon as uncertainty information on impact assessment factors becomes generally available, mini-mum and maximini-mum values of impact assessment results can then be calculated.
The ecoinvent Centre did not yet decide on the priorities of future developments. However, it became clear that a com-prehensive update of all process datasets every two years is not practicable nor required. Data updates in view of eco-invent Data 2.0 will be limited to sectors where technological and / or environmental changes appear to be substantial. An extension of the content of the ecoinvent database and the building up of international co-operations in LCI data collec-tion and supply are two fields of activities for the future.
References
Althaus H-J, Classen M (2004): Life Cycle Inventories of Metals and Methodological Aspects of Inventorying Material Resources in ecoinvent. Int J LCA 10 (1) 43–49
Althaus H-J, Kellenberger D, Doka G, Künniger T (2004): Manu-facturing and Disposal of Building Materials and Inventorying Infrastructure in ecoinvent. Int J LCA 10 (1) 35–42
de Beaufort-Langeveld A S H, Bretz R, van Hoof G, Hischier R, Jean P, Tanner T, Huijbregts M (2003): Code of Life-Cycle In-ventory Practice (includes CD-ROM). SETAC, ISBN/ISSN ISBN 1-880611-58-9 <http://www.setac.org>
Doka G, Hischier R (2004): Waste Treatment and Assessment of Long-Term Emissions. Int J LCA 10 (1) 77–84
Dones R, Heck T, Faist Emmenegger MF, Jungbluth N (2004): Life Cycle Inventories for the Nuclear and Natural Gas Energy Systems, and Examples of Uncertainty Analysis. Int J LCA 10 (1) 10–23 ecoinvent Centre (2004): ecoinvent data v1.1, Final reports ecoinvent
2000 No. 1-15. CD-ROM ISBN 3-905594-38-2, Swiss Centre for Life Cycle Inventories, www.ecoinvent.ch, Dübendorf, CH Ekvall T (1999): System Expansion and Allocation in Life Cycle
Assessment. With implications for Wastepaper Management. AFR Report 245, Department of Technical Environmental Plan-ning, Chalmers University of Technology, Göteborg
Ekvall T, Ciroth A, Hofstetter P, Norris G (2004): Evaluation of attributional and consequential life cycle assessment. Working paper Chalmers University of Technology, Göteborg
Ekvall T, Weidema B (2004): System Boundaries and Input Data in Consequential Life Cycle Inventory Analysis. Int J LCA 9 (3) 161–171
Frischknecht R (1997): Goal and scope definition and inventory analysis. In: Helias A. Udo de Haes, Nicoline Wrisberg: Life Cycle Assessment: State-of-the-Art and Research Priorities. Vol. 1, Pages: 59–88, LCA Documents, ecomed publisher, Bayreuth
Frischknecht R (1998): Life Cycle Inventory Analysis for Decision-Making: Scope-Dependent Inventory System Models and Con-text-Specific Joint Product Allocation. Ph.D.-thesis No. 12599, Inst. f. Energietechnik, Eidgenössische Technische Hochschule Zürich, 255 Switzerland
Frischknecht R (2000): Allocation in Life Cycle Inventory Analysis for Joint Production. Int J LCA 5 (2) 85–95
Frischknecht R, Bollens U, Bosshart S, Ciot M, Ciseri L, Doka G, Dones R, Gantner U, Hischier R, Martin A (1996): Ökoinventare von Energiesystemen: Grundlagen für den ökologischen Vergleich von Energiesystemen und den Einbezug von Energiesystemen in Ökobilanzen für die Schweiz. Auflage 3, Gruppe Energie – Stoffe – Umwelt (ESU), Eidgenössische Technische Hochschule Zürich und Sektion Ganzheitliche Systemanalysen, Paul Scherrer Insti-tut, Villigen, www.energieforschung.ch, Bundesamt für Energie (Hrsg.), Bern, CH
Frischknecht R, Hofstetter P, Knoepfel I, Dones R, Zollinger E (1994): Ökoinventare für Energiesysteme. Grundlagen für den ökologischen Vergleich von Energiesystemen und den Einbezug von Energiesystemen in Ökobilanzen für die Schweiz. Auflage 1, Gruppe Energie – Stoffe – Umwelt (ESU), Eidgenössische Tech-nische Hochschule Zürich und Sektion Ganzheitliche Systemana-lysen, Paul Scherrer Institut Villigen, Bundesamt für Energie (Hrsg.), Bern
Frischknecht R, Jungbluth N (2003): Allocation applied on Co-Production Processes in Large LCI Process Network Databases. In: Bauer C: International Workshop on Quality of LCI Data. Pages: 5ff <http://www.lci-network.de/lci-quality>, Forschungs-zentrum Karlsruhe, DE
Frischknecht R, Jungbluth N, Althaus H-J, Doka G, Dones R, Heck T, Hellweg S, Hischier R, Nemecek T, Rebitzer G, Spielmann M (2004a): Overview and Methodology. CD-ROM Final report ecoinvent 2000 No. 1, Swiss Centre for Life Cycle Inventories, www.ecoinvent.ch, Dübendorf, CH
Frischknecht R, Jungbluth N, Althaus H-J, Doka G, Dones R, Hellweg S, Hischier R, Humbert S, Margni M, Nemecek T, Spiel-mann M (2004b): Implementation of Life Cycle Impact Assess-ment Methods. CD-ROM Final report ecoinvent 2000 No. 3, Swiss Centre for Life Cycle Inventories, www.ecoinvent.ch, Dübendorf, CH
Frischknecht R, Jungbluth N, Althaus H-J, Doka G, Dones R, Hischier R, Hellweg S, Nemecek T, Rebitzer G, Spielmann M (2004c): Code of Practice. CD-ROM Final report ecoinvent 2000 No. 2, Swiss Centre for Life Cycle Inventories <http://www.ecoinvent.ch>, Dübendorf, CH
Gaillard G, Crettaz P, Hausheer J (1997): Umweltinventar der land-wirtschaftlichen Inputs im Pflanzenbau. FAT-Schriftenreihe 46, Eidg. Forschungsanstalt für Agrarwirtschaft und Landtechnik (FAT), Tänikon
Goedkoop M, Spriensma R (4.2000): The Eco-indicator 99: A dam-age oriented method for life cycle impact assessment. Method-ology Report, 2nd revised ed. PRé Consultants <http://www. pre.nl/eco-indicator99/>, Amersfoort, The Netherlands Guinée JB, (final editor), Gorrée M, Heijungs R, Huppes G, Kleijn
R, de Koning A, van Oers L, Wegener Sleeswijk A, Suh S, Udo de Haes HA, de Bruijn H, van Duin R, Huijbregts MAJ, Lindeijer E, Roorda AAH, Weidema BP (2001): Life cycle assessment; An operational guide to the ISO standards; Parts 1 and 2. Ministry of Housing, Spatial Planning and Environment (VROM) and Centre of Environmental Science (CML), Den Haag and Leiden, The Netherlands
Habersatter K, Fecker I, Dall'Acqua S, Fawer M, Fallscheer F, Förster R, Maillefer C, Ménard M, Reusser L, Som C (1996): Ökoinventare für Verpackungen. Schriftenreihe Umwelt 250, Bundesamt für Umwelt, Wald und Landschaft, Bern, Schweiz
Habersatter K, Fecker I, Dall'Acqua S, Fawer M, Fallscheer F, Förster R, Maillefer C, Ménard M, Reusser L, Som C (1998): Ökoinventare für Verpackungen. Schriftenreihe Umwelt 250, 2. korrigierte und aktualisierte Auflage, Bundesamt für Umwelt, Wald und Landschaft, Bern, Schweiz
Hedemann J, König U (2003): Technical Documentation of the ecoinvent Database. CD-ROM Final report ecoinvent 2000 No. 4, Swiss Centre for Life Cycle Inventories, Institut für Umwelt-informatik, Hamburg, DE, www.ecoinvent.ch, Dübendorf, CH Hischier R, Althaus H-J, Werner F (2004a): Developments in Wood and Packaging Materials Life Cycle Inventories in ecoinvent. Int J LCA 10 (1) 50–58
Hischier R, Baitz M, Bretz R, Frischknecht R, Jungbluth N, Mar-heineke T, McKeown P, Oele M, Osset P, Renner I, Skone T, Wessman H, de Beaufort ASH (2001): Guidelines for Consist-ent Reporting of Exchanges from/to Nature within Life Cycle Inventories (LCI). Int J LCA 6 (4) 192–198
Hischier R, Gilgen PW (2004): Life Cycle Assessment Databases as Part of Sustainable Development Strategies: the Example of ecoinvent. In: Hilty LM, Seifert EK, Treibert R: Information Systems for Sustainable Development. Idea Group Inc., Her-shey, USA
Hischier R, Hellweg S, Capello C, Primas A (2004b): Establishing Life Cycle Inventories of Chemicals Based on Differing Data Availability. Int J LCA 10 (1) 59–67
Hofstetter P (1998): Perspectives in Life Cycle Impact Assessment: A structured approach to combine models of the technosphere, ecosphere and valuesphere. Kluwer Academic Publishers, ISBN/ ISSN 0-7923-8377-X, Pages: 484, Boston, Dordrecht, London Huijbregts MAJ (2001): Uncertainty and variability in environ-mental life-cycle assessment. Ph.D.-thesis, Interfaculty Depart-ment of EnvironDepart-mental Sciences, University of Amsterdam, Am-sterdam
International Organization for Standardization (ISO) (1997–2000): Environmental Management – Life Cycle Assessment. European standard EN ISO 14040ff, Geneva
International Organization for Standardization (ISO) (1998): En-vironmental management – Life cycle assessment – Goal and scope definition and inventory analysis. European standard EN ISO 14041, Geneva
Jungbluth N, Bauer C, Dones R, Frischknecht R (2004): Life Cycle Assessment for Emerging Technologies: Case Studies for Photo-voltaic and Wind Power. Int J LCA 10 (1) 24–34
Künniger T, Richter K (1995): Ökologischer Vergleich von Freilei-tungsmasten aus imprägniertem Holz, armiertem Beton und kor-rosionsgeschütztem Stahl. EMPA, Dübendorf
Nemecek T, Erzinger S (2004): Modelling Representative Life Cy-cle Inventories for Swiss Arable Crops. Int J LCA 10 (1) 68–76 Pedersen Weidema B, Wesnaes MS (1996): Data quality manage-ment for life cycle inventories – An example of using data qual-ity indicators. Journal of Cleaner Production 4 (3–4) 167–174 Spielmann M, Scholz RW (2004): Life Cycle Inventories of Trans-port Services: Background Data for Freight TransTrans-port. Int J LCA 10 (1) 85–94
Steen B (1999): A systematic approach to environmental priority strategies in product development (EPS): Version 2000 – Gen-eral system characteristics. CPM report 1999: 4, Centre for En-vironmental Assessment of Products and Material Systems (CPM), Chalmers University of Technology <http://www.cpm. chalmers.se/html/publication.html>, Gotheburg, Sweden
Received: September 28th, 2004 Accepted: October 21st, 2004