UNIVERSITÉ DE MONTRÉAL
A NOVEL METHODOLOGY FOR THE ASSESSMENT OF THE DIRECT AND INDIRECT IMPACTS ASSOCIATED WITH THE DEPLETION OF FOSSIL RESOURCES IN LIFE
CYCLE ASSESSMENT
FARSHID FATEMI EMAMGHEIS DÉPARTEMENT DE GÉNIE CHIMIQUE ÉCOLE POLYTECHNIQUE DE MONTRÉAL
MÉMOIRE PRÉSENTÉ EN VUE DE L’OBTENTION DU DIPLÔME DE MAÎTRISE ÈS SCIENCES APPLIQUÉES
(GÉNIE CHIMIQUE) AOÛT 2013
UNIVERSITÉ DE MONTRÉAL
ÉCOLE POLYTECHNIQUE DE MONTRÉAL
Ce mémoire intitulé:
A NOVEL METHODOLOGY FOR THE ASSESSMENT OF THE DIRECT AND INDIRECT IMPACTS ASSOCIATED WITH THE DEPLETION OF FOSSIL RESOURCES IN LIFE
CYCLE ASSESSMENT
présenté par : FATEMI EMAMGHEIS Farshid
en vue de l’obtention du diplôme de : Maîtrise ès sciences appliquées a été dûment accepté par le jury d’examen constitué de :
M. FRAYRET Jean-Marc, Ph.D., président
M. MARGNI Manuele, Ph.D., membre et directeur de recherche Mme BULLE Cécile, Ph.D., membre et codirectrice de recherche M. DEWULF Jo, Ph.D., membre
DEDICATION
I dedicate this thesis to the two pillars of my life that have supported me throughout the process: my family, for their love and support, and especially:
my father - for inspiring me to pursue education and for motivating scientific curiosity; my mother-for teaching me to be content and peaceful even through the toughest times; my brother- for being a great advisor to me in my career,
and my friends- for their love, and for their role in making some of the greatest memories of my lifetime to date; but also for the their presence and support through the difficult times
ACKNOWLEDGEMENTS
I would like to thank Prof. Manuele Margni and Dr. Cécile Bulle for their guidance throughout my studies. This thesis would not have been possible without their support, help and patience. My studies at CIRAIG have been a very valuable experience with your supervision. I would also like to thank all of the kind people around me at CIRAIG, who have created and will continue to create a great atmosphere for research and for personal growth.
RÉSUMÉ
Ce projet de maitrise présente une méthode innovante servant à évaluer les impacts environnementaux du cycle de vie associés à l’épuisement des ressources fossiles. Cette méthode est basée sur une perspective fonctionnelle visant à améliorer l’état de l’art actuel.
L’épuisement des ressources fossiles en ACV représente une part significative des impacts dans la catégorie utilisation des ressources et les méthodes d’impacts actuelles en ACV ne prennent pas en compte l’épuisement des ressources fossiles de façon satisfaisante.
Dans cette recherche, l’ensemble des méthodes d’impacts dans l’analyse du cycle de vie (ACVI) existantes, sont analysées et les problèmes fondamentaux à résoudre seront identifiés.
Un nouveau cadre méthodologique en ACV est alors proposé pour les impacts directs et indirects qui sont associés à l’épuisement des ressources fossiles. Pour les impacts directs, de la catégorie problème, les facteurs de caractérisations proposés représente la quantité de ressources fossiles (en MJ) qui va priver les générations futures de la ressource qui a été dissipée.
Au niveau dommage, les facteurs de caractérisation proposés représentent les couts additionnels totaux (en dollars US), que la population mondiale future serait prête à payer seraient prête à payer suite à la raréfaction de la ressource fossile par MJ de ressources disparues. Les impacts indirects liés à l’épuisement de la ressource fossile sont définis comme étant les impacts du cycle de vie de l’adaptation du marché de l’énergie en raison de l’augmentation marginale du prix de la ressource fossile. Les facteurs de caractérisation obtenus sont ensuite comparés aux précédents facteurs donnés par les précédentes méthodes d’impacts en ACV. Un exemple illustratif est présenté afin de démontrer comment les facteurs de caractérisations sont utilisés dans le but de calculer les impacts effectifs aux utilisateurs d’une certaine quantité de ressource fossile dans un pays donné.
Les résultats de cette étude, contribuent à l’amélioration des connaissances actuelles des impacts d’ACV face à l’épuisement de la ressource fossile. En développant une régionalisation ainsi qu’une différenciation entre les ressources fossiles, cette étude intègre une substituabilité des ressources basée sur une approche fonctionnelle et la comptabilité de l’élasticité entre le prix et la consommation de la ressource. Cette méthodologie sera utilisée dans le développement d’impacts concernant l’épuisement des ressources fossiles au sein de la nouvelle méthode d’évaluation des impacts IMPACT World+.
À la fois aux niveaux problème et dommage, les résultats montrent que la discrimination régionale a un impact significatif sur les résultats, ce qui améliore les méthodes existantes en y ajoutant une précision régionale.
Au niveau dommage, les couts additionnels dus à la raréfaction des ressources, se trouvent être différents selon les diverses ressources fossiles ce qui améliore les méthodes existantes utilisant le même facteur de caractérisation pour toutes les ressources fossiles. La prise en compte l’effet de substitution parmi les ressources fossiles et parmi les sources d’énergies alternatives (nucléaires, renouvelables) en fonction de leur application, ainsi que la considération de l’effet d’élasticité entre l’offre et la demande ont une influence significative sur les résultats au niveau dommage
.
ABSTRACT
This master’s project presents a novel method for assessing the environmental life cycle impacts associated with the depletion of fossil resources based on a functional perspective, aiming to enhance the current state-of-the-art life cycle impact assessment (LCIA) methodology. Fossil resource depletion in life cycle assessment (LCA) accounts for a significant portion of the impacts in the impact category of resource use and current LCIA methods do not address fossil resource depletion satisfactorily.
For this research, existing LCIA methods were analyzed and the key issues to be addressed were identified. A new LCIA framework is subsequently proposed for the direct and indirect impacts associated with the depletion of fossil resources. For direct impacts, at midpoint, the proposed characterization factors represent the amount of fossil resources (in Mega Joules) that is deprived from future users per MJ of a resource that is dissipated. At endpoint, the proposed characterization factors represent the total additional costs (in US Dollars) that the world has to pay as a consequence of the deprivation of a fossil resource from future users per MJ of the resource that is dissipated. The indirect impacts associated with the depletion of fossil resources are defined as the life cycle impacts of the adaptation of the energy market as a consequence of the marginal increase in the price of a fossil resource. The obtained characterization factors are compared with those from previous LCIA methods. An illustrative example is presented to demonstrate how the characterization factors are used to calculate the impacts for the users of a certain fossil resource in a certain country.
At midpoint, and endpoint, results demonstrated that regional discrimination had a significant impact on results, improving existing methods by adding regional accuracy. At endpoint, the additional costs due to depletion were found to be different for different fossil resources, improving existing methods that use the same characterization factor for all fossil resources. Taking into account the effect of substitution among fossil resources and among alternative energy sources (nuclear, renewables) according to their application, and taking into account the effect of elasticity between price and demand had a significant influence on endpoint results.
The outcome of this research contributes to the enhancement of state-of-the-art LCIA for fossil resources depletion by differentiating regionally, differentiating between fossil resources, incorporating resource substitutability based on a functional perspective, and accounting for elasticity between the price and consumption of a resource. This methodology will be used in developing the LCIA methodology for fossil resources depletion in IMPACT World+ impact assessment method.
TABLE OF CONTENTS
DEDICATION ... III ACKNOWLEDGEMENTS ... IV ABSTRACT ... VII TABLE OF CONTENTS ... IX LIST OF TABLES ... XII LIST OF FIGURES ... XIV LIST OF ABBREVIATIONS AND ACRONYMS ... XVII APPENDICES ... XVIII CHAPTER 1 INTRODUCTION ... 1 LITERATURE REVIEW ... 2 1.1 Fossil resources ... 2 1.1.1 Petroleum ... 3 1.1.2 Coal ... 4 1.1.3 Natural Gas ... 4
1.1.4 Conventional versus unconventional fossil resources ... 5
1.2 Fossil resources availability ... 6
1.2.1 Reserve estimates ... 6
1.2.2 Fossil resource reserves references ... 7
1.2.3 Fossil resources geography and global energy markets ... 8
1.3 Fossil resources depletion ... 9
1.3.1 Prediction tools for modeling fossil resource depletion ... 10
1.3.2 Tools and Indicators for the assessment of the environmental impacts of fossil resource extraction and use ... 14
1.4 Life cycle assessment (LCA) ... 15
Attributional versus consequential LCA ... 16
1.5 Life Cycle Impact Assessment (LCIA) ... 17
1.5.1 A review of the existing LCIA methods on the characterization of fossil resource depletion ... 18
1.6 Significance of fossil resource depletion in LCA ... 25
IDENTIFYING THE KEY RESEARCH NEEDS ... 27
RESEARCH HYPOTHESIS ... 28
RESEARCH OBJECTIVES ... 28
CHAPTER 2 METHODOLOGY ... 29
2.1 Task 1: Defining the general Framework ... 29
2.2 Task 2: Developing a midpoint indicator ... 32
2.2.1 Defining the scarcity index ... 32
2.2.2 Developing the characterization factors ... 33
2.3 Task 3: Modeling the direct impacts ... 37
2.3.1 Marginal price increase due to a marginal depletion ... 37
2.3.2 Choosing the energy forecast model ... 39
2.3.3 Modeling marginal price increases in WEPS+ ... 40
2.3.4 Endpoint characterization factors ... 41
2.3.5 Calculating the endpoint characterization factors ... 42
2.4 Task 4: Modeling the indirect impacts ... 44
2.4.1 Modeling in SimaPro ... 45
2.5 Task 5: Results evaluation ... 49
2.5.1 Comparison of obtained characterization factors ... 49
2.6 Task 6: Illustrative examples ... 51
CHAPTER 3 RESULTS AND DISCUSSION ... 54
3.1 Midpoint characterization factors ... 54
3.1.1 Petroleum ... 54
3.1.2 Coal ... 54
3.1.3 Natural Gas ... 56
3.2 Endpoint Characterization factors ... 58
3.3 Indirect impacts ... 62
3.3.1 Petroleum ... 63
3.3.2 Coal ... 66
3.4 Results evaluation ... 69
3.4.1 Comparison of obtained characterization factors ... 69
3.4.2 Sensitivity analysis ... 73 3.5 Illustrative example ... 82 3.5.1 Impact at midpoint ... 82 3.5.2 Impact at endpoint ... 86 3.5.3 Indirect Impacts ... 88 CHAPTER 4 CONCLUSIONS ... 90
RECOMMENDATIONS FOR FUTURE WORK ... 92
CHAPTER 5 BIBLIOGRAPHY ... 93
LIST OF TABLES
Table 1 - Refinery yields for a typical petroleum refinery in the United States (USEIA, 2012). ... 3
Table 2 - World coal use (World Coal Institute, 2009) ... 4
Table 3 - World natural gas use (USEIA, 2012) ... 5
Table 4 - Proven, probable and possible reserves of petroleum ... 8
Table 5-World proven, probable and possible coal reserves (source) ... 8
Table 6 - World Proven, probable and possible natural gas reserves ... 8
Table 7 - WEPS+ Core Models ... 12
Table 8 - LCIA methods for fossil resource depletion mentioned in the ILCD reports ... 20
Table 9-Fossil resources LHVs and HHVs (source: Frischknecht, 2007) ... 34
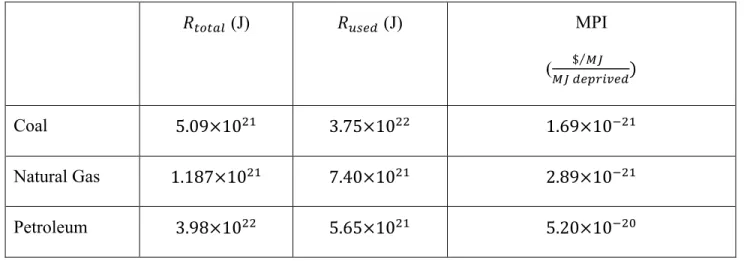
Table 10- Total available resources Rtotal, resources consumed to date Rused, and marginal price increase (MPI) ... 42
Table 11- Renewable energy production in the United States (source: US Department of Energy, 2012) ... 48
Table 12 – Selected countries and supply mixes for coal example ... 51
Table 13 – Selected countries and supply mixes for natural gas example ... 52
Table 14 - Total Additional Costs (TAC) values for petroleum and coal ... 58
Table 15 - Endpoint characterization factors for petroleum and coal (global weighted average) ... 58
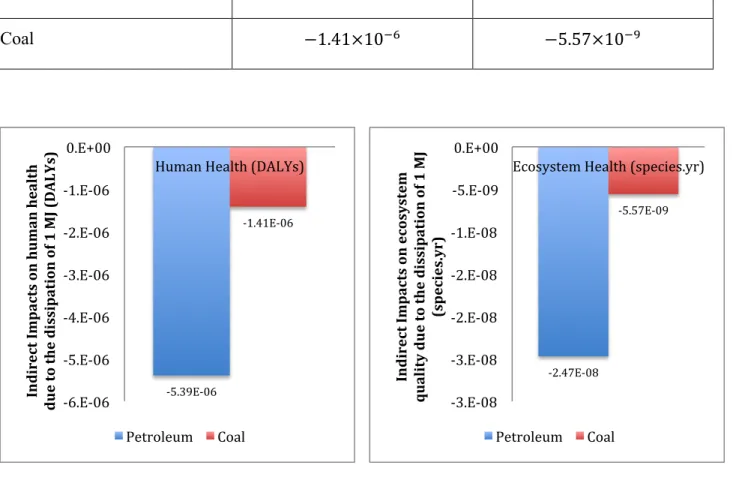
Table 16 - Indirect impacts of the depletion of 1 MJ of petroleum and coal ... 62
Table 17 - Indirect impacts from the depletion of 1 MJ of petroleum segregated by impacts from each energy carrier ... 63
Table 18 - Indirect impacts from the depletion of 1 MJ of coal segregated by impacts from each energy carrier ... 66
Table 19 – Selected countries and supply mixes for coal example ... 82
Table 21 - Impact at midpoint due to the dissipation of 1 MJ of coal calculated using selected LCIA
methods and proposed methodology ... 85
Table 22 - Impact at midpoint due to the dissipation of 1 MJ of natural gas calculated using selected LCIA methods and proposed methodology ... 86
Table 23 - Impact at midpoint due to the dissipation of 1 MJ of petroleum calculated using selected LCIA methods and proposed methodology ... 86
Table 24 - Impact at endpoint due to the dissipation of 1 MJ of coal calculated using proposed methodology ... 87
Table 25 - Impact at endpoint due to the dissipation of 1 MJ of petroleum calculated using the proposed methodology ... 88
Table 26 - Indirect impacts associated with the dissipation of 1 MJ of coal ... 89
Table 27 - Indirect impacts associated with the dissipation of 1 MJ of petroleum ... 89
Table 28 - Petroleum in the transportation sector ... 121
LIST OF FIGURES
Figure 1 - WEPS+ model sequence ... 13
Figure 2 – Phases of LCA (ISO, 2005a, 2005b) ... 15
Figure 3- Framework of impact categories for characterization at midpoint and endpoint (Area of Protection) levels. ... 18
Figure 4 - Impact pathway used by existing LCIA methods for fossil resources depletion ... 19
Figure 5- Impact chain for the direct impacts associated with the depletion of fossil resources ... 30
Figure 6 - Impact chain for the direct impacts associated with the depletion of fossil resources ... 31
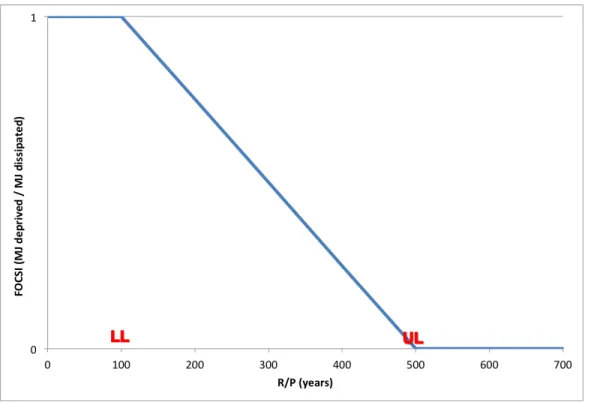
Figure 7- FOCSI plotted as a function of R/P values and the selected time horizons ... 32
Figure 8-Reserves over production ratios (years) for coal for different countries. ... 36
Figure 9-Reserves over production ratios (years) for natural gas across different countries. ... 36
Figure 10 – A sample logistic curve showing an alpha value of 15 and a beta value of -0.15. ... 38
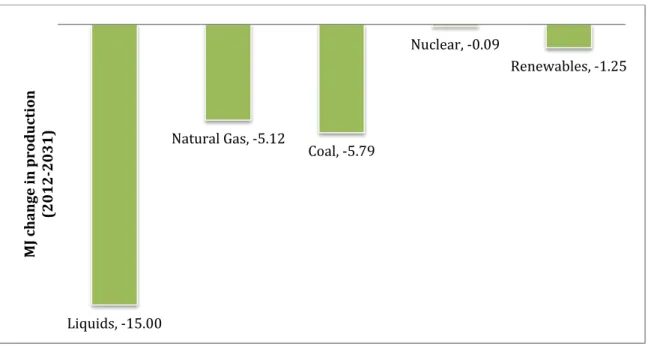
Figure 11- WEPS+ Global consumption results (2012-2031) for the reference scenario ... 43
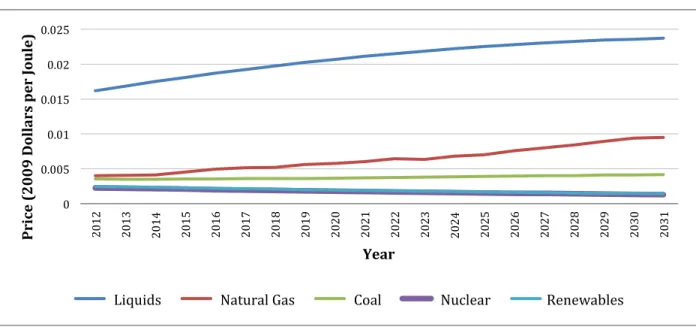
Figure 12- Prices by energy carrier type (2009 dollars per joule) for the reference scenario ... 43
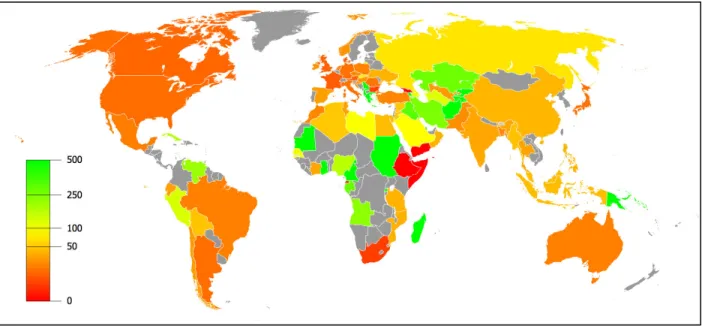
Figure 13 - Coal FOCSI values (MJ deprived/MJ used dissipatively) for different countries. Grey is used for countries that have no reserves. ... 55
Figure 14 Area graph for coal with cumulative annual production (million tonnes /yr) on the x -axis and FOCSI values on the y--axis. ... 56
Figure 15-Natural Gas FOCSIs. Grey is used for countries that have no reserves. ... 57
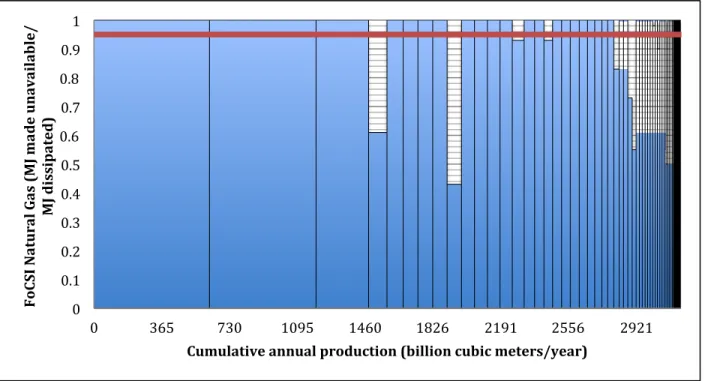
Figure 16 - Area graph for natural gas with cumulative annual production (billion cubic meters /yr) on the x -axis and FOCSI values on the y-axis. ... 57
Figure 17-Changes in global production (MJ) of coal as a consequence of 1 MJ of coal deprived .. 59
Figure 18- Changes in world production (MJ) (2012-2032) as a consequence of 1 MJ of coal deprived ... 60
Figure 19- Changes in world production (2012-2013) (in MJ) in comparison to the reference
scenario as a consequence of 1 MJ of petroleum deprived ... 61
Figure 20- Changes in world production (2012-2032) as a consequence of 1 MJ of petroleum deprived ... 61
Figure 21 – Indirect impacts on human health ... 62
Figure 22 – Indirect impacts on ecosystem quality ... 62
Figure 23 - Indirect impacts on human health in DALYS per MJ of petroleum dissipated ... 64
Figure 24 - Indirect impacts on ecosystem health in species.yrs per MJ of petroleum dissipated .... 64
Figure 25 - Contribution of different fossil resources in the indirect impacts (on Human health and ecosystem quality) and direct impacts of fossil resource depletion for 1MJ of petroleum ... 65
Figure 26 - Indirect impacts on human health in DALYS per MJ of coal dissipated ... 67
Figure 27 - Indirect impacts on ecosystem health in spercies.yr per MJ of coal dissipated ... 67
Figure 28 – Contribution of different fossil resources in the indirect impacts (on Human health and ecosystem quality) and direct impacts of fossil resource depletion for 1MJ of coal ... 68
Figure 29 - Comparison of midpoint characterization factors between recommended LCIA methods (CML 2001, EDIP) and FOCSI values from our proposed method. ... 70
Figure 30 - Comparison of global CFs obtained in this research project versus ReCiPe (revised 2012). ... 71
Figure 31 - Comparison of CFs from selected endpoint methods (ReCiPe, EcoIndicator, and IMPACT 2002+) with global CFs from our proposed method ... 72
Figure 32 - Endpoint characterization factors for coal for selected countries using our proposed method. ... 73
Figure 33 - Maximum sensitivity of Coal FOCSI values for different countries to a +-25% variation in parameters ... 74
Figure 34-Sensitivity of natural gas FOCSI values to a +-25% variation in parameters ... 76
Figure 35 - Sensitivity of Petroleum endpoint characterization factor to a 25 percent shift in parameters ... 78
Figure 36 - Sensitivity of coal endpoint characterization factors to a 25 percent change in parameters ... 79 Figure 37-Total Additional Costs (TAC) as a consequence of an increase in the price of petroleum ... 128 Figure 38-Total Additional Costs (TAC) as a consequence of an increase in the price of coal. ... 129
LIST OF ABBREVIATIONS AND ACRONYMS
ALCA – Attributional Life Cycle Assessment CF – Characterization Factor
CLCA – Consequential Life Cycle Assessment DALY – Disability Adjusted Life Year
FOCSI – Fossil Resource Competition Scarcity Index HHV – Higher Heating Value
ILCD- International Reference Life cycle Data System
LCA – Life cycle assessment, sometimes referred to mistakenly as Life Cycle Analysis LCIA – Life Cycle Impact Assessment
LHV – Lower Heating Value LL – Lower Limit
MFA – Material Flow Accounting and Analysis MPI – Marginal Price Increase
R/P – Reserves over production ratio TAC – Total Added Costs
TACON –Total Additional Consumption UL – Upper Limit
APPENDICES
APPENDIX 1 – Midpoint data and characterization factors by country APPENDIX 2 – Endpoint characterization factors by country
APPENDIX 3 – Intermediate matrices for calculating the endpoint characterization factors WEPS+ output
APPENDIX 4 – Data regarding the indirect impacts APPENDIX 5 – Data regarding SimaPro modelling APPENDIX 6 – Linear Interpolation
CHAPTER 1
INTRODUCTION
This thesis presents a new methodology for the assessment of the life cycle impacts due to fossil resources depletion in life cycle assessment.
Fossil resources are non-renewable resources with limited global reserves. Economic reserves to production ratios, used as a rough estimate for assessing the scarcity of fossil resources, are calculated as 46.2 years for petroleum, 58.6 years for natural gas, and 118 years for coal (BP, 2012). Moreover, it is predicted that between 2008 and 2030, the global consumption of petroleum, coal and natural gas will continue to grow. There are impacts, and life cycle assessment is a strong tool for assessing the impacts associated with a resource becoming less available for future users.
Life Cycle Assessment (LCA) is a tool for assessing the environmental impacts associated with products and services throughout their life cycle. A recent review presented on current life cycle impact assessment (LCIA) methods by the International Reference Life Cycle Data system (ILCD) handbook has concluded that none of the current LCIA methods assess the impacts of fossil resource depletion in a satisfactory manner (ILCD, 2010, 2011). Yet in most LCA studies, the impacts due to the depletion of fossil resources are the dominating impacts in the “Resources” damage category. The objective of this research therefore was to enhance the current state-of-the-art methodologies for assessing fossil resource depletion in life cycle assessment (LCA). Following a critique of existing LCIA methods, the key issues to address were identified as: incorporating regional discrimination, incorporating fossil resource discrimination, incorporating substitutability with a functional perspective (Stewart and Weidema, 2005), and accounting for elasticity between the price and consumption of a resource. Another key issue is the consistency of the model used for fossil resources with the models used to assess the depletion of other resources such as water and mineral resources - in the current project, the consistency with IMPACT World+ models for water and mineral resources (IMPACT World +, 2013).
This thesis is divided into 4 chapters. Chapter 1 serves as the introduction chapter of the thesis by presenting a literature review and identifying key research needs. In the methodology chapter (Chapter 2), the tasks performed to reach the research objectives are detailed. In the results and discussion chapter (Chapter 3), the deliverables of the research are presented and evaluated. In the
conclusions chapter (Chapter 4), the key findings of the research are presented and recommendations are made for future research.
Chapter 1 begins with a literature review of the key elements that need to be understood in order to appreciate the contents of this thesis. The literature review is followed by a section presenting the key research needs identified prior to conducting this research. In the conclusion of this chapter, the research hypothesis and the research objectives are presented.
LITERATURE REVIEW
This literature review presents the background necessary to understand the contents of this thesis. In section 1.1, a review of fossil resources and their classifications is presented. In section 1.2, the current available reserve estimates of fossil resources and current annual production rates are presented. These concepts will be used in the methodology section for defining the midpoint characterization factor.
In section 1.3 we explore the concepts related to fossil resources depletion and the different viewpoints on fossil resource depletion. Three tools used for predicting the future availability of fossil resources are presented: Reserves-to-production models, curve-fitting models, and energy simulation models. These three distinct tools are used throughout our LCIA methodology.
In section 1.4, life cycle assessment (LCA) is presented as a tool for assessing the impacts associated with the depletion of fossil resources. In section 1.5, life cycle impact assessment (LCIA) is explored further in detail, as the scope of the presented research is focused on this step of LCA. Section 1.6 presents the significance of fossil resource depletion in LCA, leading to the research questions presented in the subsequent section.
1.1 Fossil resources
Resources are defined as elements that are extractable for human use and that have a functional value for society (Udo de Haes, 2006). Resources can be classified according to different qualities:
Biotic and Abiotic: Abiotic resources, which are the product of past biological processes or
physical/chemical processes, including resources such as iron ore, crude oil, water, coal, land, and wood; and biotic resources which are living resources, such as trees, plants, and wildlife (Muller-Wenk, 1998; SETAC, 2003).
Funds, flows and stocks: Stocks are defined as resources that are limited, therefore their extraction
leads to the reduction of their availability. Funds may be depleted but also have a renewal rate which is high enough to allow the resource to recover. Flow resources cannot be depleted, however their availability per unit time is limited; and thus their extraction is marked by competition (e.g. wind energy) (SETAC, 2003).
Fossil resources, the subject of this study, are abiotic resources that are classified as stocks. There are three different types of fossil fuels: Petroleum, Coal, and natural gas. The following subsections provide definitions for each fossil resource, examine the products derived from a fossil resource, and explain the worldwide availability of each fossil resource.
1.1.1 Petroleum
Petroleum refers to deposits of oily material found in the upper strata of the earth’s crust (Tester, Drake, Driscoll, Golay, & Peters, 2005). Petroleum has a heterogeneous chemical structure, composed of different hydrocarbon chains. Crude petroleum is taken to oil refineries and the hydrocarbon chemicals are separated by distillation and treated by other chemical processes, to be used for a variety of purposes. Table 1 highlights the most important yields from a typical oil refinery in the United States. The largest share of oil products are energy carriers. In fact, 92% of the global production of petroleum is used for energy use and therefore dissipated (IEA, 2009). Energy-carrying fuels include gasoline, jet fuel, diesel fuel, heating oil, and heavier fuel oils. Refineries also produce other chemicals, some of which are used in chemical processes to produce plastics and other useful materials (Tester et al., 2005).
Table 1 - Refinery yields for a typical petroleum refinery in the United States (USEIA, 2012). Product Gasoline Diesel
and other fuels
Jet fuel Heavy fuel oil
Asphalt Lubricant Other products
Refinery yield
46% 26% 9% 4% 3% 1% 11%
1.1.2 Coal
Coal is a compact stratified mass of metamorphosed plant that has, in part, undergone arrested decay to different extents of completeness (Tester et al., 2005). Table 2 presents a general classification of coal use worldwide. Coal is primarily used as a solid fuel to produce electricity and heat through combustion for industrial and non-industrial applications. Statistics show that worldwide, more than 99 percent of coal is used for energy purposes and therefore dissipated (IEA, 2009).
Table 2 - World coal use (World Coal Institute, 2009) Function Electricity generation Steel manufacturing Cement Plants Other industry
Heating Other uses
Percentage 68% 7% 4% 8% 3% 10%
1.1.3 Natural Gas
Natural gas is found in underground reservoirs of porous rocks, alone or physically mixed with petroleum. It is developed naturally over millions of years from the carbon and hydrogen molecules of ancient organic matter trapped in geological formations. Natural gas consists primarily of methane, but also ethane, propane, butane, pentanes, and heavier hydrocarbons. A general classification of worldwide natural gas uses is presented in Table 3. Natural gas is used domestically as a cooking and heating fuel. In much of the developed world it is supplied to buildings via pipes where it is used for many purposes including natural gas-powered ovens, heating/cooling, and central heating (USEIA, 2011). It is also used for the generation of electricity. Natural gas is used in the manufacture of fabrics, glass, steel, plastics, paint, fertilizers and other products. Natural gas is also used for transportation. Overall, statistics show that globally, more than 94 percent of the natural gas produced is used for energy purposes (IEA, 2009).
Table 3 - World natural gas use (USEIA, 2012) Function Electricity
generation
Industrial Commercial Chemicals Transport
Percentage 45% 33% 16% 5% 1%
1.1.4 Conventional versus unconventional fossil resources
From a production perspective, a distinction is made between conventional and unconventional resources. This distinction is explained the following sections. It should be noted that this classification is different from the classification of the economic reserves estimates that is used in the methodology.
Petroleum conventional and unconventional resources: The distinction between conventional and
unconventional petroleum resources is based on the density and viscosity of the petroleum. In the wide spectrum of fossil resources, petroleum resources run from light oils through a series of increasingly lower grade and difficult-to-extract resources (Farrel and Brandt, 2006). Unconventional resources have two properties that cause them to differ from conventional oil and result in necessarily higher greenhouse gas emissions: 1) they tend to be more difficult to extract than conventional oil, and 2) they tend to be hydrogen deficient compared to the approximately 2:1 H to C ratio present in liquid fuels . Unconventional petroleum sources include tar sands, extra heavy oil, oil shale, coal to liquid (CTL) and gas to liquids (GTL) (Greene, 2003).
Oil sands are mixtures of bitumen,water, sand and clay. The Alberta, Canada natural bitumen deposits comprise at least 85% of the world total world bitumen (Greene, 2003; Pieprzyk, Kortluke, & Hilje, 2009). The extraction of extra heavy oilcurrently relies on the same in situ procedures as those used in oil sand extraction. The extra-heavy crude oil deposit of the Orinoco Oil Belt, a part of the Eastern Venezuela basin, represents nearly 90% of the known extra-heavy oil in place. (Greene, 2003; Pieprzyk et al., 2009). Oil shale is formed in crude petroleum bedrock that has not yet completed the geological development necessary to form petroleum. Although oil shale has been mined and processed for more than 160 years, its economic use to date has only been possible through financial and political support (Greene, 2003; Pieprzyk et al., 2009). Coal to liquids and gas to liquids are not currently commercially produced at an industrial scale (World Coal Institute, 2009).
Natural gas conventional and unconventioal resources: Natural gas also comes from both
conventional and unconventional geological formations. The key difference is the manner, ease and costs associated with extracting the resource. Conventional gas refers to the free gas trapped in porous zones in various naturally occuring rock formations such as carbonates, sandstones and siltstones. While conventional gas has been the sole focus of the industry since it began nearly 100 years ago, there has been a recent development in the exploitation of unconventional resources. The dominant unconventional natural gas is shale gas (CAPP, 2012).
Shale gas refers to natural gas that is trapped within shale formations. Over the past decade, using technologies such as horizontal drilling and hydraulic fracturing, large volumes of natural gas that were previously unavailable have become available (USEIA, 2012). There are potential environmental concerns associated with the production of shale gas, such as the great amounts of water used, potential spills and leakage of hazardous chemicals (if mismanaged) and the large amounts of wastewater generated (USEIA, 2012). Historically, the expensive production of natural gas from shale has kept its development from expanding. However, in recent years, higher prices and advances in technology have made it more profitable. There exists differences in opinion on the financial benefits of unconventional gas extraction (Urbina, 2011).
1.2 Fossil resources availability
1.2.1 Reserve estimates
Resources are of value to humans when they can be extracted and used (Udo de Haes, 2006). Economic reserve estimates serve the purpose of identifying how much resources are available for extraction. These estimates are made based on geologic and engineering data and the interpretation of this data (Society of Petroleum Engineers, 1997). Reserve estimates therefore rely on the integrity, skill and judgment of the evaluator and are affected by geological complexity and availability of data (SPE, 1997). Fossil resources reserve estimates therefore involve uncertainty. The level of uncertainty of reserve estimates is expressed by dividing reserves into two principle classifications- proven (or proved) reserves, and unproven (or unproved) reserves. The most commonly accepted definitions are based on those approved by the Society SPE (1997), presented below.
Proven reserves are those quantities of reserves that are estimated with reasonable certainty to be
commercially recoverable under current economic conditions and operating technologies. There should be at least a 90% probability that these quantities will be recoverable. Proven reserve estimates are also referred to as 1P estimates.
Unproven reserves are based on geologic and/or engineering data similar to that used in estimates of proven reserves, but technical, or economic uncertainties preclude such reserves as being qualified as proven reserves. Unproven reserves are further classified as probable reserves and possible reserves.
Probable reserves are those unproven reserves, which according to analysis geological and
engineering data have more than 50% chance of being recoverable. In this context, there should be at least a 50% probability that the quantities recovered are equal or exceed the sum of estimated proven plus probable reserves (also referred to as 2P estimates).
Possible reserves are those unproved reserves which according to analysis geological and engineering
data are less likely to be recovered than probable reserves. In this context, there should be at least a 10% probability that the quantities actually recovered will equal or exceed the sum of estimated proved plus probable plus possible reserves (also referred to as 3P estimates).
Historically, 1P estimates have been revised upwards over time and 3P estimates have been revised downwards to converge at the estimated 2P estimate (Owen, Inerwildi, & King, 2010). For this reason, 2P estimates represent actual fossil resource reserves more accurately (Mitchell, 2004; Bentley, Mannan, & Wheeler, 2007).
It is important to note that the basis of definition for proven and unproven reserves is economic feasibility and technology availability and therefore once a reserve is deemed economical to exploit it is added to the estimate, regardless of whether it is conventional or unconventional.
1.2.2 Fossil resource reserves references
Proven reserves estimates are available from multiple databases. The data used for proven reserves in this study are those presented by BP Statistical Review (2012). These values are cross-checked with those from the IEA world energy outlook (International Energy Agency, 2012) and the USEIA International Energy Outlook (USEIA, 2012). For unproven reserves, only one database is found in the literature, namely the 2010 World Energy Council’s Survey of Energy Resources (WEC, 2010). This
unique document, prepared triennially, is highly regarded as a credible reference for governments, industry, investors, NGOs and academia (WEC, 2010).
Tables 4, 5 and 6 present the global proven, possible and probable reserves for petroleum. As explained in the previous section, 2P reserves are found to be more representative of fossil resource reserves availability. In Tables 1, 2 and 3 in Appendix 1, 2P reserves estimates are presented for different countries for petroleum, coal and natural gas, respectively.
Table 4 - Proven, probable and possible reserves of petroleum
Proved Reserves (million barrels) Source: BP (2012) Probable reserves (million barrels) Source: WEC (2010) Possible Reserves (million barrels) Source: WEC (2010) World Total 1,526,300 301,324 4,598,129
Table 5-World proven, probable and possible coal reserves (source)
Proven Reserves (million tonnes) Source: BP (2012) Probable reserves (million tonnes) Source: WEC (2010) Possible reserves (million tonnes) Source: WEC (2010) World Total 860,936 188,784 1,087,473
Table 6 - World Proven, probable and possible natural gas reserves
Proven Reserves (billion cubic meters)
Source: BP (2012)
Probable reserves (billion cubic meters)
Source: WEC (2010)
Possible reserves (billion cubic meters)
Source: WEC (2010)
World Total 187,100 5,520 12,508
1.2.3 Fossil resources geography and global energy markets
World oil reserves are distributed unevenly across the globe. Almost 80 percent of the world’s conventional petroleum reserves are situated in eight countries, five of which are located in the Middle
East (IEA, 2012). However, the petroleum market is considered to be globally integrated. The costs of transporting petroleum are low, crude oils of different geographic regions are largely interchangeable, and regardless these different crudes can be blended (Nordhaus, 2009). This means that a shortfall in one region can be made accommodated shipping the same or similar oil from elsewhere in the world. Nordhaus (2009) examined weekly oil prices for 31 crude oils across the world and found that all oil prices fluctuated synchronically (their median correlation over the period was 0.997), indicating a true globally integrated market.
Natural gas reserves are not equally present across the globe. In fact, Russia alone posesses a quarter of the world’s natural gas reserves, followed by Iran (15.7%) and Qatar (13,4%). The remaining half of the world’s natural gas reserves are spread sporadically across the globe (BP, 2011). Natural gas is used mostly locally in the vicinity of the producing country. In 2011, 80% of the natural gas produced had been used in the producing country (BP, 2011), the remaining being exported through pipelines. Because natural gas is exported in pipelines, the travelling distances are much shorter than that for oil or coal. This means that the potential for a global market for natural gas is limited.
In evaluating whether coal should be considered a global or regional resource, the international trade of coal was studied. It was observed that the amount of coal traded in 2011 accounted for only 16% of the total coal consumed, as most is still used in the country in which it is produced (WEC, 2010; BP, 2011). The coal trade routes demonstrate that even the portion that is exported is not available to a global market, as transportation distances limit the economic feasibility of exporting coal (BP, 2011).
1.3 Fossil resources depletion
“Abiotic resource depletion is the decrease of availability of the total reserve of potential functions of resources, due to the use beyond their rate of replacement.” Van Oers et al, 2002
While fossil resources become more and more scarce, the global use of fossil resources continues to increase. Our use of fossil resources has increased 12-fold over the past 100 years, to meet the ever-increasing global demand (UNEP, 2011; USEIA, 2011). It is estimated that between 2013 and 2030, overall world petroleum production will increase by 31 percent, overall world natural gas production will increase by 52 percent, and overall world coal production will increase by 50 percent (USEIA, 2011). Global fossil resources are being depleted as a consequence.
The debate over the depletion of fossil resources is generally framed within two extremes, namely the “pessimist” and “optimist” views (Greene, 2003; Farrel et al., 2006; Brandt, 2010). The pessimists, who place their main focus on geology, foresee an imminent peaking of world oil production, leading to a “not-so-bright” future (Deffeyes, 2009). The “optimists” on the other hand focus on the economy and expect innovation and market forces to make the question of fossil resources depletion irrelevant for the world.
In between these two extreme viewpoints, there exists a more moderate view - which we call the “realist” view. The realists believe that the most promising avenue for understanding oil depletion lies in integrating the economic (i.e. resource substitution, changes in prices, changes in demand) and physical (e.g. resource depletion) factors of fossil resources production (Greene, Hopson, & Li, 2006; Brandt, 2010). According to this perspective, as conventional fossil resources diminish, there is a gradual shift to unconventional sources, and shifts to alternatives, and changes in production and prices, leading to environmental and economical impacts on the society.
Given the pertinence of the depletion of fossil resources, a series of tools and indicators have been developed to model and quantify the state of fossil resources depletion. Using this information, governments can identify the strategies required to manage resources use. These tools are explained below.
1.3.1 Prediction tools for modeling fossil resource depletion
Quantitative understanding of fossil resources depletion has increased significantly over the last century (Brandt, 2010). The first calculations of the exhaustion time of oil reserves were performed in the early 1900s. In the 1950s and 1960s, curve-fitting techniques were used to predict future production and prices. Following the 1970s oil crisis, economists became interested in the prediction tools used to forecast future prices and production. Today, hybrid simulation models are available which incorporate geological or other non-economic factors with economic ones. Each model has its advantages and disadvantages. In the following sections, the three types of prediction models that have been used in the course of this research are presented.
1.3.1.1 Reserve to production models (R/P) models
The simplest models for predicting future oil availability are reserve to production (R/P) models. These models calculate the number of years until exhaustion by dividing an estimate of current reserves by
current production (Brandt, 2010). R/P models are simple to understand and simple to explain and they provide an initial indication of resource availability and the level of scarcity. The BP Statistical Review (BP, 2011) utilizes R/P values as the indicator for predicting the future availability of fossil resources.
1.3.1.2 Hubbert’s logistic model, and other curve-fitting models
Curve fitting models predict the future of production and prices by fitting mathematical curves to historical data. In 1956, Hubbert predicted that US oil production would peak between 1965 and 1970. This prediction, initially a hypothesis (Deffeyes, 2009), was translated into mathematical terms in 1959: he fitted the logistic function to cumulative oil discoveries, he extrapolated the curve to find the asymptote of cumulative discoveries. A variety of Hubbert-like, curve-fitting models exist, and have been used to predict the production of fossil resources globally (Brandt, 2010). In Greene’s model (Greene, 2003), prices are modeled as a logistic function of depletion in which an increase in production costs occur as a consequence of the resource becoming more scarce. The benefit of curve-fitting models is their simplicity. Due to this simplicity, curve-curve-fitting models are a useful tool for first order projections of future production and prices (Brandt, 2010).
1.3.1.3 Energy simulation models
Energy simulation models predict the future of energy production and prices by taking into account both the economic and physical factors of energy production. We do not live in a substitution or depletion world, but a substitution and depletion world. By segregating the energy economy into sectors (such as residential, transportation, industrial, commercial, electricity) these models take into account the functions provided by energy carriers, allowing for substitution between energy carriers that provide similar functions. Simulation models offer another very appealing feature: they do not impose exogenous requirements on the shape of the production over time, but instead allow the curve to be generated through the interaction of economic and physical factors of energy production. They are used for various purposes, from forming policy to studying the effects of introducing new energy resources to the market (USEIA, 2011). Simulation models are used frequently to make medium to long-term energy projections both regionally and globally. They are used to produce energy outlooks, which are forecasts made by various agencies and companies for the future of energy (USEIA, 2011, IEA, 2011, BP, 2011). Examples of energy simulation models include World Energy Model (WEM) developed by the International Energy Agency (IEA, 2011), Prospective Outlook on Long-term Energy Systems model (POLES) developed by the Institute of Energy Policy and Economy (Enerdata, 2009),
and World Energy Projection System Plus (WEPS+) developed by the United States Energy Information Administration (USEIA, 2011). WEPS+, the model used in this research, is explored further in the subsection below. The reasons for choosing WEPS+ are explained in the methodology section.
World Energy Projection System Plus (WEPS+)
The World Energy Projection System Plus (WEPS+) is an energy modeling system, produced by the United States Energy Information Administration (USEIA), and used to produce their annual International Energy Outlook report (USEIA, 2011). WEPS+ uses a database of energy data, energy models that represent the various sector-demand, sector transformation and sector supply projection, and a control system that keeps track of the models and data and executes the models . The core models used in WEPS+ are presented in Table 7. WEPS+ uses an integrated iterative process that allows for the convergence of consumption and prices.
Table 7 - WEPS+ Core Models
Type of Activity WEPS+ Model
1. Macroeconomic Model Demand Models 2. Residential Model
3. Commercial Model 4. World Industrial Model
5. International Transportation Model Transformation Models 6. World Electricity Model
7. District Heat Model Supply Models 8. Petroleum Model
9. Natural Gas Model 10. Coal Model
11. Refinery
12. Greenhouse Gas Model 13. Main Model
The flowchart presented in Figure 1 presents the sequence in which the core models are run. Each of the core models is run independently, but reads and writes to a common shared database in order to communicate with the other models. Each model completes its execution before the next model in sequence. At the end of the run, if the system does not converge, it begins another iteration. If it does converge, it ends by report writing.
WEPS+ produces projections for 16 regions of the world, including North America, OECD Europe, OECD Asia, Africa, Russia, other non-OECD Europe and Eurasia, China, India, other non-OECD Asia, Brazil, and the remaining Central and South American countries. The projections extend to 2035. The WEPS+ platform is designed to allow the various individual models to communicate with each other through a common, shared database and provides a comprehensive series of output reports for analysis. In WEPS+, the end-use demand models (residential, commercial, industrial and transportation) project consumption of the key primary energy sources. For more information on how the WEPS+ model operates, the reader is referred to the documentation available on the WEPS+ model (USEIA, 2011).
1.3.2 Tools and Indicators for the assessment of the environmental impacts of
fossil resource extraction and use
In order to assess the environmental impacts associated with the depletion of fossil resources, a series of indicators have been developed and used by environmental experts. Material flow accounting and
analysis (MFA) is an approach which focuses on the concept of material and energy balancing, and
calculates the domestic extraction of resources, as well as physical imports and exports (Graedel, 2003). It is used at a global, national, or regional scale. Using MFA, indicators such as mass units related to GDP (Steinberger et al., 2010), domestic material consumption (DMC), and total material consumption (TMC) (OECD, 2008) are calculated for economies, already used by the EU to calculate indicators for "Sustainable Consumption and Production" (EUROSTAT, 2007).
The concept of "Material Input per service unit" (MIPS), developed by the Wuppertal Institute for Climate, Environment and Energy (Ritthoff et al., 2002) aims at illustrating the direct and indirect energy, material, water and air inputs required along the whole life cycle of a product, from cradle to grave, to be used as a measure for resource productivity, in the effort of dematerializing the economy. Life cycle assessment (LCA) is a standardized method that allows the assessment of the direct and indirect environmental impacts along a product's life cycle from cradle to grave (ISO, 2005a, 2005b). Since the development of LCA in the early 1990s, the impacts from resource use have been an integral part of LCA (Udo de Haes, 2006). For resources, the LCA model allows the user to determine all of the natural resources that are used throughout the lifecycle of a product or service, from extraction to production throughout use and disposal. Using life cycle impact assessment (LCIA) which is an
integral part of LCA, one can identify the impacts associated with the depletion of natural resources. LCA is further explored in the following section.
1.4 Life cycle assessment (LCA)
Life Cycle Assessment (LCA) is a tool for assessing the potential environmental impacts throughout a product's life cycle, from raw material acquisition through production, to use, to end-of-life treatment and disposal (i.e. cradle-to-grave) (Finnveden et al., 2009). Life cycle assessment is still a young science, mainly developed from the mid-1980s until present day. In the 1990s, through consecutive international workshops, LCA was well-developed and a consensus was reached on the framework, leading to ISO standardization (ISO, 2005a, 2005b).
There are four phases in an LCA study: The goal and scope definition phase, the inventory analysis phase, the impact assessment phase and the interpretation phase. The four phases are displayed in Figure 5 and explained below using ISO standards definitions (ISO, 2005a, 2005b).
Figure 2 – Phases of LCA (ISO, 2005a, 2005b)
The first phase, goal and scope definition, serves to define the purpose and extent of the study, and contains a description of the system studied. At this stage, an important parameter is defined which is used as the basis for the comparison of different systems: the functional unit of a product or the services delivered. The second phase of LCA, inventory analysis, involves data collection and analysis. Data on the environmental interventions (such as emissions, land use, resource use) connected to each process in the life cycle are collected, often guided by a process flowchart. Data are obtained from producers, suppliers, and LCA databases. Data are then processed to produce an inventory of
environmental interventions per functional unit. This procedure is not always straightforward. For example, for processes that have more than one output, decisions must be made about how to allocate environmental burdens to each output.
The third phase, life cycle impact assessment (LCIA), aims to evaluate the impacts of the environmental loads which were quantified in the inventory analysis phase. According to ISO 14044 (ISO, 2005b), there are two mandatory elements in this phase, namely classification and
characterization, and three optional elements: normalization, grouping, and weighting.
The fourth phase of LCA, interpretation, evaluates the study in order to provide recommendations and conclusions. LCA is seen as an iterative process and interpretation can often times lead to an adjustment of the goal and scope or to further investigations of the inventory and associated impacts (ISO, 2005a).
Attributional versus consequential LCA
The methodological consensus on LCA is defined in the ISO standards and often referred to in the literature as attributional LCA (ALCA). ALCA accounts for all the impacts exerted on the environment within the life cycle of a product. ALCA therefore only describes the physical flows associated with the potential environmental impacts that are directly linked to the product system (Ekvall & Weidema, 2004).
It should be noted that certain environmental impacts caused by product changes may occur outside the product life cycle. For this reason, a new form of LCA, referred to as consequential LCA (CLCA), has been developed (Ekvall & Weidema, 2004; Earles & Halog, 2011). Unlike ALCA, consequential LCA (CLCA) describes the impacts of a decision and all processes and material flows that are directly or indirectly affected by a marginal change in the output of a product through market effects, substitution, use of constrained resources, etc. Additionally, allocation is avoided by system expansion. CLCA is a more complete type of assessment, since it takes more than the studied life cycle into account and examines how the environmental impacts are affected when the state is changed. CLCA considers the market effects of a product’s production and consumption and has broader applications than ALCA, such as public policy making, social action plans and product development.
While CLCA began with simple economic tools, increasingly sophisticated methods have been developed (Ekvall & Weidema, 2004; Baumann & Tillman, 2004). Initial efforts have relied on simple
partial equilibrium models for predicting affected technologies and more recent models have incorporated sophisticated economic models for this purpose. As an example, the Global Trade Analysis Project (GTAP) has been used to determine the affected technologies across the global economy (Dandres et al., 2012). While global economy models such as GTAP provide a more comprehensive output with respect to the number of regions and sectors included, they have been criticized for their low product sector resolution (Earles & Halog, 2011).
1.5 Life Cycle Impact Assessment (LCIA)
As the focus of this research is on LCIA, it is further explored in the section below. In this section, the state-of-the-art methods for LCIA of fossil resources, and their strengths and weaknesses are explored.
Life cycle impact assessment (LCIA), aims to evaluate the impacts of the environmental loads which
were quantified in the inventory analysis phase of an LCA. The main purpose of the LCIA is thus to turn the inventory results into more environmentally relevant information, i.e. information on the impacts to the environment, rather than just information on emissions and resource use. Another purpose, perhaps often less stated, is to aggregate the information from the life cycle inventory (LCI) into fewer parameters (Baumann & Tillman, 2004)
According to ISO 14044, there are 2 mandatory elements, namely classification and characterization, and 3 optional elements, normalization, grouping, and weighting (ISO, 2005b).
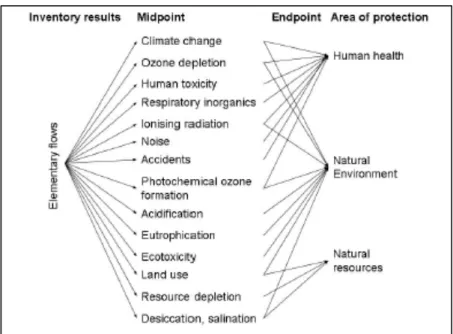
In Classification, the elementary flows, which are flows directly to or from the natural environment (including resource consumption, emissions to air, water and land, etc.) are assigned to impact categories according to each flow’s ability to contribute to the different environmental impacts. In Figure 3, the impact categories recommended by the ILCD handbook (ILCD 2010a, 2010b) are presented.
In characterization, the impact of each elementary flow is modeled quantitatively according to the environmental mechanism. An impact pathway, which is a series of phenomena that link the elementary flows to impacts on the Areas of Protection (AoPs) is defined. An indicator is chosen to represent the impact caused by the elementary flow. According to ISO 14044, this indicator can be chosen anywhere along the impact pathway. Midpoint indicators are parameters that indicate the impacts somewhere along, but before the end of, the impact pathway. Endpoint indicators are
parameters representative of the impacts all the way to the end of the impact pathway, and on the Areas of Protection (AoPs) (Bare et al., 2002).
In order to convert environmental interventions into impacts, characterization factors (CFs) are used. Characterization factors are estimated using characterization models which are simplified mathematical representations of the biophysical processes which occur throughout the impact pathway.
Figure 3- Framework of impact categories for characterization at midpoint and endpoint (Area of Protection) levels.
LCIA is a discipline undergoing active development. Several LCIA methods are available and there is not always an obvious choice between them. In spite of the resemblance between some of the methods, there can be important differences in their results each produces, that can lead to conclusions which vary depending on the choice of the LCIA method (Dreyer et al., 2003). In the following section, a review of the existing LCIA methods for fossil resource depletion is presented. Methods that are related to the scope of this research are explored in more detail.
1.5.1 A review of the existing LCIA methods on the characterization of fossil
resource depletion
While there hasn’t been a standardization attempt from ISO for LCIA methodologies to date, various studies have aimed at evaluating existing methods and making recommendations. The UNEP/SETAC life cycle initiative was an attempt to identify best practices for Life Cycle Assessment within the ISO
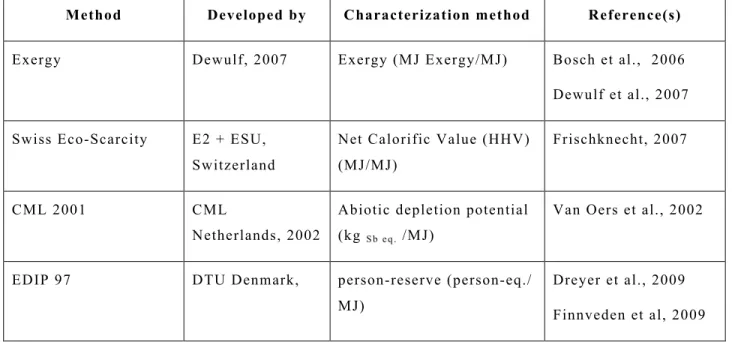
framework. These efforts led to a publication (SETAC, 2003) reporting on best practices. More recently, the European Commission, in consultation with several non-EU countries, has taken a major step in further facilitating the development of formal international recommendations for LCIA through the International Reference Life Cycle Data (ILCD) System, leading to three publications that analyze the existing LCIA methods, make recommendations, and provide evaluation criteria for future methods (ILCD 2010a, 2010b, 2011). The common impact pathway that is used by these methods is presented in Figure 4. The ILCD has divided existing LCIA methods for fossil resources depletion into three groups:
Figure 4 - Impact pathway used by existing LCIA methods for fossil resources depletion
Category I methods use an inherent property of the material (such as mass or exergy) as a basis for
characterization (Bosch et al., 2006; Dewulf et al, 2007). The most developed method in this category is exergy. Exergy is the potential of a system to cause change as it achieves equilibrium with its environment, with units of Joules. Exergy analysis is performed in industrial ecology to make energy use more efficient. In resource use characterization for LCA, a recent approach based on exergy is published by (Dewulf et al., 2007). This method quantifies the exergy values taken away from natural
ecosystems for numerous resources including fossil fuels, minerals, nuclear energy, land resources, renewable resource, atmospheric resources and water resources. Recent advancements have enhanced these approaches and the ILCD report considers the scope of the exergy method complete. The strength of this indicator its relatively low uncertainty levels (ILCD, 2011), however this method has been criticized for not reflecting the scarcity of the resources in LCA. Regardless of the scarcity of the resource, the exergy value remains the same (Stewart & Weidema, 2005; Finnveden et al, 2009).
Category II methods address resource scarcity and decreased availability. This group of methods
focus on measures of deposits and consumption rates. They have a higher environmental relevance, but also have the potential to have a higher uncertainty compared to the first group. Methods that fall into this category include EDIP (Dreyer et al., 2009; Finnveden et al., 2009 ) and CML 2001 (Van Oers et al., 2002).
Category III methods describe the endpoints, aiming to cover the entire environmental mechanism.
Methods in this category include EcoIndicator 99, Impact 2002+, ReCiPe, and EPS 2000.
The LCIA methods presented in Figure 4 are listed in table 8. In this table, the origin of the methods and the characterization method is presented. The references for further reading for each LCIA method are also presented.
Table 8 - LCIA methods for fossil resource depletion mentioned in the ILCD reports
Method Developed by Characterization method Reference(s)
Exergy Dewulf, 2007 Exergy (MJ Exergy/MJ) Bosch et al., 2006 Dewulf et al., 2007 Swiss Eco-Scarcity E2 + ESU,
Switzerland
Net Calorific Value (HHV) (MJ/MJ)
Frischknecht, 2007
CML 2001 CML
Netherlands, 2002
Abiotic depletion potential (kg S b e q . /MJ)
Van Oers et al., 2002
EDIP 97 DTU Denmark, person-reserve (person-eq./ MJ)
Dreyer et al., 2009 Finnveden et al, 2009
EcoIndicator 99 Pré Consultants, Netherlands Surplus energy (MJ surplus/MJ) Goedkoop & Spriensma, 2000 Impact 2002+ EPFL Switzerland Surplus Energy (MJ/MJ) Jolliet et al., 2003 ReCiPe RUN + Pré +
CML + RIVM Netherlands
Total Additional Costs ($/MJ) Goedkoop et al., 2009 EPS Chalmers University, Sweden Willingness to pay (ELU/person) Steen, 1999
In the sections below, a selection of methods both related to the scope of this research and which are recommended by the ILCD handbook are further explored.
1.5.1.1 CML 2002
CML 2002 is an LCIA methodology based on the work of Guinee and Heijungs (1995). CML 2002 characterizes the impacts associated with the depletion of fossil resources using the abiotic depletion potential (in MJ fossil energy).
In their methodology, Guinee and Heijungs (1995) suggest that the ultimately extractable reserve is the only relevant reserve parameter in terms of depletion. However since data on this type of reserve is unavailable and dependent on future technology, it is proposed to use the ultimate reserves. Ultimate reserves are estimated by multiplying the average concentrations of chemical elements in the earth’s crust by the mass of the crust. For fossil fuels, a rough estimate of the ultimate reserves is made on the basis of the fossil carbon content of the earth’s crust.
In CML 97 the above values for ultimate reserves are used to calculate the abiotic depletion potential (ADP) separately for each fossil fuel. In CML 2002 however, fossil fuels are assumed to be full substitutes (both as energy carriers and as materials), so their abiotic depletion potential (ADP) is taken as the same in terms of total energy reserve. The abiotic depletion potential is defined as:
!"#!"##$% !"!#$% = !"#$$%&%'#()*+ !"#$!"##$% !"!#$% !"#$%&#' !"#"!$"!"##$% !"!#$% ! ×
!"#$%&#' !"#"!$"!"#$%&"' ! !"#$$%&%'#()*+ !"#$!"#$%&"'
where the ADP is the abiotic depletion potential of fossil fuels (in kg antimony eq./MJ fossil energy), the ultimate reserve of fossil fuels is in MJ, the de-accumulation, or fossil energy production is in MJ/yr. The ultimate reserve of antimony, the reference resource, is presented in kgs. The de-accumulation of antimony, the reference resource is in kg/yr.
Fossil resource Characterization factor Unit
Energy from coal 4.57E-04 kg sb eq./MJ
Energy from natural gas 5.34E-04 kg sb eq./MJ
Energy from petroleum 4.90E-04 kg sb eq./MJ
1.5.1.2 EDIP 97
EDIP 97 assesses the impacts for resources at midpoint level by (1) multiplying extraction by the annual production and dividing the result by the economic reserve, and (2) dividing the result again by the annual production. Characterization factors are expressed in person-reserves. A person-reserve is the quantity of a resource available to the average world citizen if the world’s economic resources were equally shared by the world population. Economic reserves are defined as resources that can be extracted in an economically feasible way using today’s technology.
Fossil resource Characterization factor Unit
Energy from coal 4.56E-07 Person-reserve/MJ
Energy from natural gas 1.40E-06 Person-reserve/MJ
1.5.1.3 Criticism of Midpoint indicators
Although there are minor differences in the LCIA method for CML 2003 and EDIP 97, they share a similar approach by using a fraction of available reserves over production rates. As it was explained in section 2.2, reserves to production (R/P) rates are a simple way of explaining resource availability. As explained in section 1.2.3, although the market for petroleum can be considered global, coal and natural gas reserves are not completely shared by the world. Considering global values for reserves over production rates is not therefore a correct assumption. A more accurate characterization would be to look at each country’s supply mix of the resource and consider the scarcity in each country.
Considering the full substitutability of all fossil resources is not a correct assumption. Although for some applications, substitutability is possible (e.g. natural gas can replace coal in electricity production, subject to availability), for many applications, fossil fuels cannot be replaced e.g. coal will not be used for vehicle transportation because of low energy to weight ratio. When considering substitution, the application for which the fossil resource is being used for should be accounted.
The ultimate resource base (used as default in calculations of depletion in the CML 2002 method) is a relatively robust reference with low uncertainty, but its environmental relevance seems limited. It leads to problems with underestimating the severity of depletion. Using economic reserves has higher uncertainties because it is subject to change, but is more representative of the actuality of the available resources. The ILCD therefore recommends that these two extremes can be used as guides to assess the severity of the impacts associated with the use of a resource (ILCD, 2011).
1.5.1.4 ReCiPe
ReCiPe is an LCIA methodology that characterizes the impacts associated with using fossil resources at endpoint as the consequential reduction in the quality of remaining resources, resulting in increases in production costs as mankind will have to switch from conventional resources to unconventional resources (Goedkoop et al, 2009). At endpoint, ReCiPe characterizes the impacts based on the increase in cost of resource extraction as a consequence of depletion (marginal cost increase). The impact at endpoint is defined as the total additional costs that the society will have to bear in the future due to the marginal cost increase.