HAL Id: hal-00302410
https://hal.archives-ouvertes.fr/hal-00302410
Submitted on 12 Jan 2007HAL is a multi-disciplinary open access
archive for the deposit and dissemination of sci-entific research documents, whether they are pub-lished or not. The documents may come from teaching and research institutions in France or abroad, or from public or private research centers.
L’archive ouverte pluridisciplinaire HAL, est destinée au dépôt et à la diffusion de documents scientifiques de niveau recherche, publiés ou non, émanant des établissements d’enseignement et de recherche français ou étrangers, des laboratoires publics ou privés.
SCIAMACHY tropospheric NO2 over the Alpine region
and importance of pixel surface pressure for the column
retrieval
D. Schaub, K. F. Boersma, J. Keller, D. Folini, D. Brunner, B. Buchmann, H.
Berresheim, J. Staehelin
To cite this version:
D. Schaub, K. F. Boersma, J. Keller, D. Folini, D. Brunner, et al.. SCIAMACHY tropospheric NO2 over the Alpine region and importance of pixel surface pressure for the column retrieval. Atmospheric Chemistry and Physics Discussions, European Geosciences Union, 2007, 7 (1), pp.429-468. �hal-00302410�
ACPD
7, 429–468, 2007SCIAMACHY tropospheric NO2
over the Alpine region D. Schaub et al. Title Page Abstract Introduction Conclusions References Tables Figures ◭ ◮ ◭ ◮ Back Close
Full Screen / Esc
Printer-friendly Version
Interactive Discussion Atmos. Chem. Phys. Discuss., 7, 429–468, 2007
www.atmos-chem-phys-discuss.net/7/429/2007/ © Author(s) 2007. This work is licensed
under a Creative Commons License.
Atmospheric Chemistry and Physics Discussions
SCIAMACHY tropospheric NO
2
over the
Alpine region and importance of pixel
surface pressure for the column retrieval
D. Schaub1, K. F. Boersma2, J. Keller3, D. Folini1, D. Brunner1, B. Buchmann1, H. Berresheim4, and J. Staehelin5
1
Empa, Swiss Federal Laboratories for Materials Testing and Research, Ueberlandstrasse 129, CH-8600 Duebendorf, Switzerland
2
Division of Engineering and Applied Sciences, Harvard University, Cambridge, Massachusetts, USA
3
Paul Scherrer Institute (PSI), CH-5232 Villigen PSI, Switzerland
4
German National Meteorological Service, DWD/MOHp, 82383 Hohenpeissenberg, Germany
5
Swiss Federal Institute of Technology (ETH), Universit ¨atstrasse 16, CH-8092 Zurich, Switzerland
Received: 23 November 2006 – Accepted: 8 January 2007 – Published: 12 January 2007 Correspondence to: D. Brunner (dominik.brunner@empa.ch)
ACPD
7, 429–468, 2007SCIAMACHY tropospheric NO2
over the Alpine region D. Schaub et al. Title Page Abstract Introduction Conclusions References Tables Figures ◭ ◮ ◭ ◮ Back Close
Full Screen / Esc
Printer-friendly Version
Interactive Discussion
Abstract
This study evaluates NO2vertical tropospheric column densities (VTCs) retrieved from
measurements of the Scanning Imaging Absorption Spectrometer for Atmospheric Chartography (SCIAMACHY) above Switzerland and the Alpine region. A clear rela-tionship between a spatially and temporally highly resolved Swiss NOxemission inven-5
tory and SCIAMACHY NO2columns under anticyclonic meteorological conditions
sup-ports the general ability of SCIAMACHY to detect sources of NOxpollution in Switzer-land. Summertime NOx lifetime estimates derived from this relation agree reasonably
with values from literature. A further evaluation of the SCIAMACHY data is based on the comparison with NO2 VTCs retrieved from the Global Ozone Monitoring
Exper-10
iment (GOME). The annual mean NO2 VTCs calculated from both data sets clearly show the advantage of the improved SCIAMACHY pixel resolution for qualitatively esti-mating the NOxpollution distribution in a small country such as Switzerland. However,
a more quantitative comparison of seasonally averaged NO2VTCs gives evidence for SCIAMACHY NO2VTCs being systematically underestimated over the Swiss Plateau 15
during winter. A possible explanation for this problem (not reported in earlier literature) is the use of inaccurate satellite pixel surface pressures derived from coarsely resolved global models in the retrieval. The marked topography in the Alpine region can lead to deviations of several hundred meters between the assumed and the real mean surface height over a pixel. A sensitivity study based on selected clear sky SCIAMACHY NO2
20
VTCs over the Swiss Plateau and two fixed a priori NO2profile shapes indicates that
inaccurate pixel surface pressures have a considerable effect of up to 40% on the re-trieved NO2 columns. For retrievals in the UV-visible spectral range with a decreasing sensitivity towards the earth’s surface, this effect is of major importance when the NO2
resides close to the ground, which occurs most pronounced during the winter season.
25
ACPD
7, 429–468, 2007SCIAMACHY tropospheric NO2
over the Alpine region D. Schaub et al. Title Page Abstract Introduction Conclusions References Tables Figures ◭ ◮ ◭ ◮ Back Close
Full Screen / Esc
Printer-friendly Version
Interactive Discussion
1 Introduction
Nitrogen dioxide is an important air pollutant. It can affect human health and plays a major role in the production of tropospheric ozone (Seinfeld and Pandis, 1998; Finlayson-Pitts and Pitts, 2000). The bulk of NOx is emitted by the high-temperature combustion of fossil fuel in the highly industrialised continental regions in the
north-5
ern mid-latitudes. Important natural sources are biomass burning and the microbial production in soils of the non-polar continental surface. At higher altitudes in the tropo-sphere NOxis directly injected into the troposphere by lightning and aircraft emissions
(IPCC, 2001).
NOxis primarily emitted as NO which oxidises to NO2within a few minutes. The NO2
10
concentration is affected by the partitioning of NOxinto NO and NO2which depends on
the abundance of ozone and reactive organic compounds as well as on solar light in-tensity and temperature, and which therefore changes with altitude and with time of day in the troposphere. NOxis removed from the troposphere mainly by conversion to nitric
acid (HNO3). During daytime, HNO3 is formed through the reaction of NO2 with the 15
OH radical. At night, a two step reaction mechanism forms nitrogen pentoxide (N2O5) which further reacts on surfaces and aerosol to HNO3 (Dentener and Crutzen, 1993).
HNO3is finally removed by dry and wet deposition (Kramm et al., 1995). The resulting
NOx lifetime is highly variable with an annual average boundary layer lifetime of about one day (Warneck, 2000). However, due to the higher summertime abundance of OH,
20
much shorter lifetimes of a few hours prevail during photochemically active summer days. In this study, we infer NOx lifetimes from the combination of SCIAMACHY NO2 VTCs with a high-quality NOxemission inventory to check the reliability of SCIAMACHY
data. Generally, NOx lifetimes are essential to determine emissions from space-borne
data (e.g. Martin et al., 2003).
25
Although the NOx(≡ NO + NO2) concentration in Switzerland decreased during the
last 15 years the Swiss NO2annual ambient air quality standard of 30 µgm −3
(≈16 ppb) is still exceeded in polluted areas (FOEN, 2005). Monitoring of nitrogen oxides
ACPD
7, 429–468, 2007SCIAMACHY tropospheric NO2
over the Alpine region D. Schaub et al. Title Page Abstract Introduction Conclusions References Tables Figures ◭ ◮ ◭ ◮ Back Close
Full Screen / Esc
Printer-friendly Version
Interactive Discussion fore plays an important role for the assessment of reduction measures.
Complemen-tary to ground-based monitoring networks which provide detailed information of local near-surface air pollution, space-borne instruments such as the Global Ozone Moni-toring Experiment (GOME) (Burrows et al., 1999) and the Scanning Imaging Absorp-tion Spectrometer for Atmospheric Chartography (SCIAMACHY) (Bovensmann et al.,
5
1999) provide area-wide data of NO2 vertical tropospheric column densities (VTCs)
with global coverage within a few days. The improved resolution of space-borne NO2 VTCs (GOME pixel size: 320×40 km2, SCIAMACHY: 60×30 km2, Ozone Monitoring Instrument (OMI): 13× 24 km2) increasingly allows to detect NO2pollution features on
a regional scale. However, these space-borne data and their complex retrieval are
10
emerging techniques and validation is needed. Schaub et al. (2006) summarised dif-ferent validation campaigns of GOME and SCIAMACHY NO2 data and carried out a
detailed comparison of GOME NO2VTCs retrieved by KNMI (Royal Dutch
Meteorolog-ical Institute) and BIRA/IASB (Belgian Institute for Space Aeronomy) with NO2profiles derived from ground-based in situ measurements at different altitudes in the Alpine
15
region.
In this paper we evaluate SCIAMACHY NO2 VTCs over Switzerland and the Alpine region with regard to their use for air quality monitoring and modelling on a regional scale. For the first time, the focus is on the size of a small country such as Switzerland. The above mentioned GOME validation approach presented in Schaub et al. (2006)
20
can not be adopted for SCIAMACHY here. In that approach in situ measurements from a number of widely separated stations located at different altitudes in Switzerland and Southern Germany have been used to estimate vertical NO2 columns. The size of SCIAMACHY pixels, however, is too small to justify the combination of measurements that are spatially separated (the latter are only used for a qualitative comparison in this
25
study). We therefore first perform a qualitative evaluation by relating SCIAMACHY NO2 VTCs to a spatially and temporally highly resolved NOx emission inventory available
for Switzerland, showing the general ability of SCIAMACHY data to detect the NO2
pollution distribution on the scale of a small country. This comparison is then used to 432
ACPD
7, 429–468, 2007SCIAMACHY tropospheric NO2
over the Alpine region D. Schaub et al. Title Page Abstract Introduction Conclusions References Tables Figures ◭ ◮ ◭ ◮ Back Close
Full Screen / Esc
Printer-friendly Version
Interactive Discussion infer seasonal mean daytime NOxlifetimes that are subsequently compared to values
from literature.
Further, the SCIAMACHY NO2 VTCs are evaluated by a comparison with GOME
NO2 columns over Switzerland and a qualitative comparison with the seasonal varia-tion of NO2columns deduced from ground-based in situ measurements carried out at 5
different altitudes. Evidence is found for SCIAMACHY NO2VTCs being systematically
underestimated over the Swiss Plateau during the winter season. We will present a plausible reason contributing to this problem which is related to an inadequate repre-sentation of the surface topography in the NO2retrieval. This problem potentially affects
any region on the globe with a marked topography and becomes increasingly important
10
with improving pixel resolution when the retrieval is based on coarsely resolved input parameters, e.g. derived from global models.
2 Data
2.1 KNMI/BIRA GOME and SCIAMACHY tropospheric NO2observations
Nadir measurements from GOME on board ESA’s ERS-2 satellite and from
SCIA-15
MACHY on board ESA’s Envisat satellite are used in the present study. The GOME and SCIAMACHY observations are obtained at approximately 10:30 and 10:00 local time and individual pixels cover an area of 320×40 km2 and 60×30 km2, respectively. The GOME and SCIAMACHY measurement principles are described in Burrows et al. (1999) and Bovensmann et al. (1999), respectively. The NO2 VTCs studied in this 20
work are the product of a collaboration between KNMI and BIRA/IASB. Both GOME and SCIAMACHY NO2 data are publicly available on a day-by-day basis via ESA’s
TEMIS project (Tropospheric Emission Monitoring Internet Service, www.temis.nl). The first retrieval step is based on the Differential Optical Absorption Spectroscopy (DOAS) technique (Vandaele et al., 2005): a modelled spectrum is fitted to the
mea-25
sured reflectance spectrum in the spectral window from 426.3–451.3 nm. The modelled 433
ACPD
7, 429–468, 2007SCIAMACHY tropospheric NO2
over the Alpine region D. Schaub et al. Title Page Abstract Introduction Conclusions References Tables Figures ◭ ◮ ◭ ◮ Back Close
Full Screen / Esc
Printer-friendly Version
Interactive Discussion spectrum accounts for spectral absorption features of NO2, O3, O2-O2and H2O.
Scat-tering by clouds, aerosols, air molecules and the surface is described by a low-order polynomial. This first retrieval step results in the slant column density (SCD) of NO2,
which can be interpreted as the column integral of absorbing NO2molecules along the effective photon path from the sun through the atmosphere to the spectrometer.
5
The second retrieval step separates the stratospheric contribution from the total SCD (Boersma et al., 2004). For KNMI retrievals this is achieved with a data-assimilation approach using the global TM4 chemistry transport model (CTM) (Dentener et al., 2003). The tropospheric SCD (SCDtrop) results from the subtraction of the stratospheric
estimate from the total SCD.
10
In the third retrieval step, the SCDtrop is converted into a VTC by applying the tro-pospheric air mass factor (AMFtrop). Following Palmer et al. (2001) and Boersma et
al. (2004), the retrieved SCIAMACHY NO2VTC (XSCIA) is calculated as
XSCIA= Ntrop Mtrop(xa, b) = Ntrop·Plxa,l P lml(b) · xa,l (1)
where Ntrop denotes the tropospheric slant column density, Mtrop the tropospheric air
15
mass factor, xa,l the layer specific subcolumns from the a priori profile xa, and ml the altitude-dependent scattering weights. The latter are calculated with the Doubling Adding KNMI (DAK) radiative transfer model (Stammes, 2001) and best estimates for forward model parameters b, describing surface albedo, cloud parameters (fraction, height) and pixel surface pressure. The a priori NO2 profiles for every location and 20
all times are obtained from the TM4 CTM. Cloud fraction and height are taken from the Fast Retrieval Scheme for Clouds from the Oxygen A band (FRESCO) algorithm (Koelemeijer et al., 2001). Since the TM4 model is driven by meteorological data of the European Centre for Medium-Range Weather Forecasts (ECMWF) the surface pres-sures in TM4 are taken from the ECMWF model on the 2◦×3◦ resolution of the TM4
25
model. The surface pressure for an individual satellite pixel is linearly interpolated to the pixel location (hereafter ECMWF/TM4 surface pressure).
ACPD
7, 429–468, 2007SCIAMACHY tropospheric NO2
over the Alpine region D. Schaub et al. Title Page Abstract Introduction Conclusions References Tables Figures ◭ ◮ ◭ ◮ Back Close
Full Screen / Esc
Printer-friendly Version
Interactive Discussion Errors of GOME tropospheric NO2 retrievals have extensively been discussed in
Boersma et al. (2004). Based on this work, errors for both GOME and SCIAMACHY NO2 VTCs are estimated on a pixel-to-pixel basis and additionally provided in the
TEMIS data sets. Error propagation studies have shown SCIAMACHY NO2VTC errors to be similar to GOME errors. However, these studies have not included the effect of
5
surface pressure. The present work will show that, over a complex topography, this pa-rameter can be expected to lead to larger errors for the higher resolved SCIAMACHY data.
2.2 Swiss NOx emissions
Swiss NOx emissions mount up to 33.2 kt N/year with traffic, industry, agricul-10
ture/forestry and residential activities contributing 58%, 24%, 12% and 6%, respec-tively, for the year 2000 (FOEN, 2005). The present study employs an hourly resolved NOx emission inventory for Switzerland available on a 3×3 km
2
grid. It combines the following basic data sets:
– Road traffic emissions of NOx for the reference year 2000 with a spatial resolu-15
tion of 250 m were prepared by the consulting company INFRAS, Switzerland. An average diurnal variation is provided as well. Long-term trends of annual to-tals recently published in Keller and Zbinden (2004) were used to interpolate the emissions between 2000 and 2005.
– NOx emissions from residential activities, heating, industry, off-road traffic and 20
agriculture/forestry for the reference year 2000 with a spatial resolution of 200 m and accounting for seasonal variations were prepared by the Meteotest company, Switzerland. Data sets for other years of interest were calculated on the basis of trends provided by the Swiss Federal Office for the Environment (FOEN, 1995). Additional information on the emission inventory is summarised in Keller et al. (2005).
25
Total emission inventories are usually based on a large number of input variables. 435
ACPD
7, 429–468, 2007SCIAMACHY tropospheric NO2
over the Alpine region D. Schaub et al. Title Page Abstract Introduction Conclusions References Tables Figures ◭ ◮ ◭ ◮ Back Close
Full Screen / Esc
Printer-friendly Version
Interactive Discussion Each of these parameters – and, thus, also the resulting total emission inventory –
are affected by uncertainties. Their assessment is a challenging task which needs fur-ther assumptions (e.g. K ¨uhlwein and Friedrich, 2000). For the 3×3 km2 Swiss NOx
emission inventory an accuracy of ±15–20% is estimated in FOEN (1995). K ¨uhlwein (2004) further pointed out increasing errors in emission inventories for increasing
spa-5
tial resolutions. Thus, due to integration of the 3×3 km2 resolved emission data over the SCIAMACHY pixel size of 60×30 km2in the present work, the above given error of 20% is considered as a reasonable upper limit, which will be assumed in this study.
3 Methods
3.1 Comparison of SCIAMACHY NO2VTCs with a high resolution emission inventory 10
and estimation of mean NOxlifetimes
SCIAMACHY NO2VTCs located entirely within the Swiss boundaries are related to the high resolution Swiss NOx emission inventory presented in Sect. 2.2. NOx emission rates between 9:00 and 10:00 (alternatively between 6:00 and 10:00) UTC are summed up over the individual pixel footprints.
15
First, the qualitative relation between NO2 VTCs and collocated NOx emissions is discussed (Sect. 4.1.1). Then, neglecting any transport into or out of the column en-closed by the satellite pixel, seasonal NOx lifetimes are estimated simply as the ratio
between the observed column (in N-equivalents: g(N) km−2) and the emission rate (in g(N) km−2hr−1). In order to account for inaccuracies in both the observed columns and
20
the emission rates, the lifetime estimates are based on the calculation of a weighted or-thogonal regression (York, 1966). SCIAMACHY NO2VTC 1-sigma error estimates are taken from the TEMIS data file where error estimates are provided for each individual pixel (Boersma et al., 2004). For the NOxemission rates added up over the individual
SCIAMACHY pixels an error of 20% is assumed (Sect. 2.2).
25
SCIAMACHY NO2 VTCs are converted to NOx VTCs by employing representative
ACPD
7, 429–468, 2007SCIAMACHY tropospheric NO2
over the Alpine region D. Schaub et al. Title Page Abstract Introduction Conclusions References Tables Figures ◭ ◮ ◭ ◮ Back Close
Full Screen / Esc
Printer-friendly Version
Interactive Discussion values for the seasonal mean NO2/NO ratio. The latter depends on the abundance
of ozone and reactive organic compounds as well as on solar light intensity and tem-perature. Thus, the ratio varies both spatially (horizontally and vertically) and season-ally. For the United States and based on 106 NOx monitoring data sets measured at different distances from the predominant emission sources, Chu and Meyer (1991)
5
recommended a national default value for the NO2/NO ratio of 3. NOx measurements
operated since 1999 at a rural site at the edge of the Swiss Plateau (Rigi, 47◦04’ N, 8◦ 28’ E, 1030 m asl) using a standard chemiluminescence detector for the measurement of NO and a photolytic converter for the selective conversion of NO2to NO indicates a
seasonal variation of monthly mean NO2/NO ratios of between 1.6 (January) and 4.0
10
(August) for anticyclonic clear sky conditions and a time window between 10:00 and 12:00 UTC (Steinbacher, personal communication). Because the location of the mea-surement site on a mountain ridge roughly 500 m above the Swiss Plateau can lead to a decoupling from the near-ground Swiss Plateau air masses during winter and the NO2/NO ratio is decreasing with height (e.g. Nakamura et al., 2003), we suppose that 15
the wintertime ratio given above is rather low. Thus, for the present work, we assume seasonal mean NO2/NO ratios of 3, 4, 3 and 2 for the spring (MAM), summer (JJA), fall (SON) and winter (DJF) season, respectively. Due to the bulk of NOxresiding near the
ground in polluted regions we further assume these NO2/NO ratios to be representative
for the whole tropospheric column.
20
The NOxemissions taking place at the location of the column are considered as the
main flux of NOx into the column which, in an equilibrium state, is balanced by the
chemical and physical (i.e. deposition) losses in the column. Neglecting transport and assuming first order losses only and steady state, we can write
d M d t = E − k · M = 0 (2) 25 and hence M = 1 k·E = τ·E (3) 437
ACPD
7, 429–468, 2007SCIAMACHY tropospheric NO2
over the Alpine region D. Schaub et al. Title Page Abstract Introduction Conclusions References Tables Figures ◭ ◮ ◭ ◮ Back Close
Full Screen / Esc
Printer-friendly Version
Interactive Discussion with M the amount of NOx in the column, E the NOx emission rate (both converted
to N-equivalents) and τ the lifetime. The basic assumption of steady state has also been made by Leue et al. (2001), Beirle et al. (2003) and Kunhikrishnan et al. (2004). It disregards the horizontal NOx transport into and out of the column. This transport, however, leads to a smearing effect that is depending on the distribution of the NOx 5
emissions, the prevailing meteorology (e.g. wind speed and direction) and the chemical lifetime. For mapping isoprene emissions from space-borne data, Palmer et al. (2003) determined typical smearing length scales. For NOx lifetimes in the order of hours to
one day, this length scale is ∼100 km (Martin et al., 2003). This might be problematic regarding the SCIAMACHY pixel size of 60×30 km2. However, anticyclonic clear sky
10
conditions (which are the present focus) are known to be associated with low wind speeds, i.e. rather stagnant air, and fast photochemistry, which reduces the importance of horizontal transport in the boundary layer.
Significant transport over larger distances (e.g. from highly polluted regions in adja-cent countries to Switzerland as described in Schaub et al. (2005) for a frontal passage)
15
is considered to be unimportant for the anticyclonic days investigated here.
3.2 Sensitivity of SCIAMACHY NO2VTCs to varying pixel surface pressure
Following Sect. 2.1 the mean pixel surface pressure is one of the parameters used in the column retrieval. For both GOME and SCIAMACHY pixels with centre coordinates within the region of interest ROICH (Fig. 1) covering the whole Switzerland (6
◦
E –
20
10.5◦ E, 45.75◦ N – 47.75◦ N) the deviations between the ECMWF/TM4 mean surface pressures used in the retrieval (psurf) and the corresponding effective mean surface
pressures (peff) are determined and compared to each other. peffover the pixel exten-sion is determined from the aLMo (Alpine Model, the MeteoSwiss numerical weather prediction model) topography which better represents the real topography as the aLMo
25
resolution of 7×7 km2is much finer than the TM4 model grid (2◦×3◦, ∼220×240 km2). An estimate of the effect of inaccurate pixel surface pressure used in the retrieval is carried out for a subset of clear sky SCIAMACHY pixels. The AMFstropand NO2VTCs
ACPD
7, 429–468, 2007SCIAMACHY tropospheric NO2
over the Alpine region D. Schaub et al. Title Page Abstract Introduction Conclusions References Tables Figures ◭ ◮ ◭ ◮ Back Close
Full Screen / Esc
Printer-friendly Version
Interactive Discussion are first calculated for psurfas in the retrieval and then recalculated for the better surface
pressure estimate peff. The criteria for the pixel subset are i) anticyclonic clear sky meteorological conditions (Alpine Weather Statistics; MeteoSwiss, 1985), ii) pixel cloud fraction ≤0.1, and iii) a small standard deviation <65 m of the aLMo 7◦7 km2 grid cell heights enclosed within a SCIAMACHY pixel, the latter ensuring that the reprocessing
5
is done for pixels over a flat region in the vicinity of the Alps rather than over the complex Alpine topography. The resulting SCIAMACHY pixels are located above the north-eastern Swiss Plateau (Fig. 2).
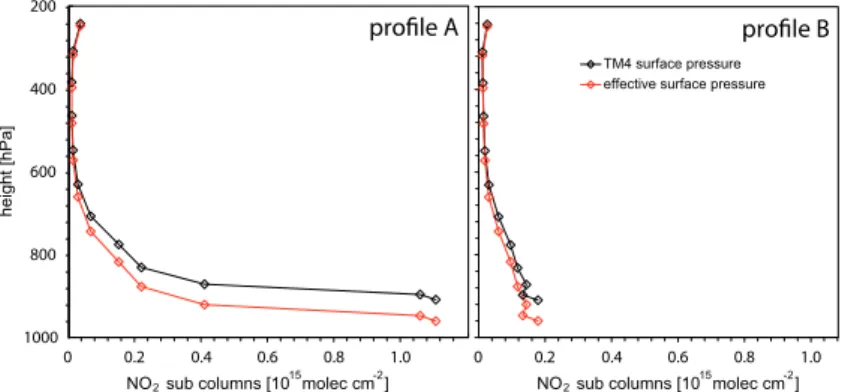
The sensitivity test is based on two characteristic (and fixed) CTM a priori NO2profile
shapes (Fig. 3). In a first profile (A), the bulk of the NO2 is residing near the ground. 10
Such profile shapes are expected to occur over polluted regions and most pronounced during the winter months when vertical mixing is generally weak or non-existing. A second profile (B) shows a much lower NO2abundance near the ground and can be
expected to represent either a remote profile or a summertime profile shape resulting from vertical mixing. As shown in Fig. 3 the use of a different surface pressure scales
15
the profile vertically. The other retrieval (or forward model) parameters including sur-face albedo, cloud fraction and height, solar zenith angle and so on are kept constant.
4 Results and discussion
4.1 SCIAMACHY NO2VTCs and NOx emissions in Switzerland
4.1.1 Qualitative comparison
20
Figure 4a shows the comparison between SCIAMACHY NO2 VTCs and the corre-sponding NOx emission rates for anticyclonic clear sky (pixel cloud fraction ≤0.1)
me-teorological conditions together with a simple linear regression (n=243). Anticyclonic conditions are deduced from the Alpine Weather Statistics (MeteoSwiss, 1985). Al-though (i) the present comparison does not include any vertical profile information, (ii)
25
ACPD
7, 429–468, 2007SCIAMACHY tropospheric NO2
over the Alpine region D. Schaub et al. Title Page Abstract Introduction Conclusions References Tables Figures ◭ ◮ ◭ ◮ Back Close
Full Screen / Esc
Printer-friendly Version
Interactive Discussion the smearing effect is not taken into account and (iii) different meteorological
condi-tions can be expected to lead to different relacondi-tions between the NO2 VTCs and the
corresponding emissions (due to different NO2/NO ratios and different NOx lifetimes),
the resulting correlation coefficient of R=0.72 indicates that the collocated emissions explain more than 50% of the variance in the NO2 VTCs. Thus, SCIAMACHY seems
5
to observe the sources of air pollution from space although its sensitivity is strongly decreasing towards the earth’s surface.
Figure 4b shows the correlation coefficient vs. the upper limit for the SCIAMACHY cloud fraction; i.e., SCIAMACHY pixels with cloud fractions lower than or equal to this limit have been taken into account. The comparison is carried out for all
meteorolog-10
ical conditions as well as for anticyclonic conditions only. We suppose that the better correlations under anticyclonic conditions are due to low wind speeds and rather homo-geneous air masses often prevailing during such conditions. Thus, the NO2columns
are more directly related to the collocated NOxemissions. Note that the stable values of the correlation coefficients for higher upper cloud fraction limits in Fig. 4b are mainly
15
due to the small number of cases that are additionally taken into account (denoted by the number of data points additionally shown in Fig. 4). The decreasing correlation co-efficients with increasing cloud fraction limits can be understood from clouds screening the NO2 below. In such situations, the retrieved column is strongly affected by the a
priori assumption on the vertical NO2distribution (Schaub et al., 2006).
20
4.1.2 Near-ground NOxlifetime under anticyclonic clear sky conditions
For estimating seasonal NOx lifetimes we define clear sky conditions to prevail for
SCIAMACHY pixels with a cloud fraction ≤ 0.2 (still yielding a correlation coefficient R > 0.5 in Fig. 4b). In this way the analysis can be based on a larger data set than available for a limit of 0.1. SCIAMACHY NO2 VTCs are converted to NOx VTCs as 25
described in Sect. 3.1.
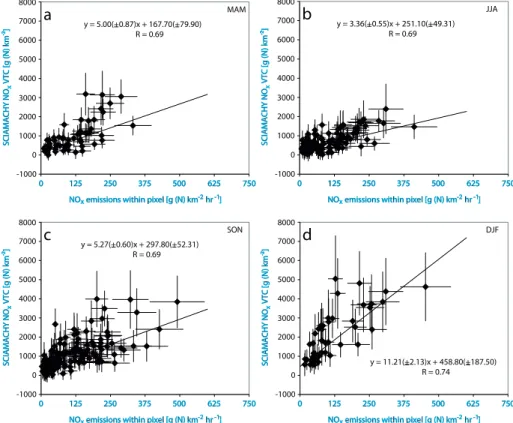
Figure 5 shows for each season the relationship between individual SCIAMACHY NOxcolumns located entirely within the Swiss boundaries and the corresponding NOx
ACPD
7, 429–468, 2007SCIAMACHY tropospheric NO2
over the Alpine region D. Schaub et al. Title Page Abstract Introduction Conclusions References Tables Figures ◭ ◮ ◭ ◮ Back Close
Full Screen / Esc
Printer-friendly Version
Interactive Discussion emission rates between 9:00 and 10:00 UTC. Additionally, the weighted orthogonal
re-gression output is given. The relatively small intercepts suggest that under anticyclonic conditions the background NOx plays a rather marginal role and the SCIAMACHY
ob-servations are dominated by the local NOxemissions. From the slopes the correspond-ing column-average NOx lifetimes for the spring, summer, fall and winter season are 5
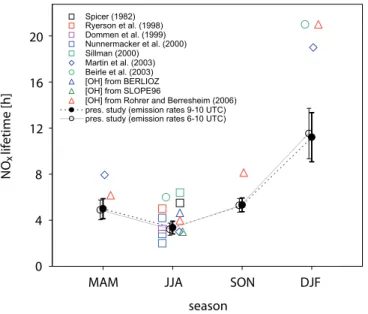
calculated as 5.00 ± 0.87, 3.36 ± 0.55, 5.27±0.60 and 11.21±2.13 h, respectively. An additional estimate is calculated using a different time window between 6:00 and 10:00 UTC for summing up the NOx emission rates. The resulting NOx lifetimes are
summarised in Table 1 and Fig. 6. The alternative time window used to derive the NOx
emission rates (6:00–10:00 UTC instead of 9:00–10:00 UTC) has only a very small
im-10
pact on the results even though NOxemission peaks due to morning traffic are included in this case.
Besides the NOx lifetimes estimated here, Fig. 6 denotes additional summertime
lifetime estimates from literature:
– from measurements in power plant plumes: 5 h (Ryerson et al., 1998), 2.8 and
15
4.2 h (Nunnermacker et al., 2000) and 6.4 h (Sillman, 2000),
– from measurements in urban plumes: Boston: 5.5 h (Spicer, 1982), Nashville:
2.0 h (Nunnermacker et al., 2000), Zurich: 3.2 h (Dommen et al., 1999),
– from GOME NO2VTCs above Germany: 6.0 h (Beirle et al., 2003) and
– zonal mean in the boundary layer (0–2 km) from the GEOS-CHEM CTM: 3.0 h
20
(Martin et al., 2003).
For spring, Martin et al. (2003) calculated a mid-latitude NOxlifetime from the
GEOS-CHEM model of 8 h. For the winter season, Martin et al. (2003) and Beirle et al. (2003) reported on NOxlifetimes of 19 and 21 h, respectively.
Additional NOxlifetimes are estimated here for the main NOxloss mechanism which 25
is the oxidation of NO2with OH to HNO3. These estimates are based on typical Swiss
ACPD
7, 429–468, 2007SCIAMACHY tropospheric NO2
over the Alpine region D. Schaub et al. Title Page Abstract Introduction Conclusions References Tables Figures ◭ ◮ ◭ ◮ Back Close
Full Screen / Esc
Printer-friendly Version
Interactive Discussion Plateau values of pressure (960 hPa) and temperature and on OH concentrations taken
from the BERLIOZ and the SLOPE96 campaigns as well as from long-term OH mea-surements carried out at Hohenpeissenberg. The BERLIOZ campaign took place at a distance of 50 km from Berlin; the SLOPE96 campaign focused on polluted air masses travelling from the city of Freiburg to the Schauinsland Mountain (south-western
Ger-5
many); the Hohenpeissenberg station is located in Southern Germany at an altitude of 985 m asl. From a pollution point of view, all regions are similar to the Swiss Plateau and surroundings. For an assumed temperature of 298 K and based on OH concentra-tions taken from the BERLIOZ and the SLOPE96 campaigns with noontime values of (4–8)×106cm−3(Volz-Thomas et al., 2003; Mihelcic et al., 2003) and (7–10)×106cm−3
10
(Volz-Thomas and Kolahgar, 2000), respectively, the resulting mean daytime NOx life-times in summer are estimated to be 4.6 h and 3.0 h. Seasonally averaged 9:00– 10:00 UTC OH concentrations determined from clear sky OH measurements at Ho-henpeissenberg carried out between 1999 and 2005 (Rohrer and Berresheim, 2006; Berresheim, unpublished data, 2006) are used together with assumed temperatures
15
for the summer, spring/fall and winter seasons of 298 K, 288 K and 278 K, respectively, to estimate NOx lifetimes of 6.1, 3.9, 8.2 and 21.0 h for the MAM, JJA, SON and DJF seasons, respectively (Fig. 6).
The comparison of our NOx lifetimes with estimates from literature shows that the
summertime values obtained here are reasonable. Our estimate is near the lower end
20
of the range of published values, but it is noteworthy that our values of 3.4 and 3.2 h (depending on the emission time window) perfectly agree with another study carried out in Switzerland by Dommen et al. (1999) yielding a lifetime of 3.2 h (Fig. 6). For spring and fall only few published values are available for comparison (Fig. 6). However, our result is still similar to these values for spring. For the fall season our estimate can only
25
be compared to a lifetime value deduced from Hohenpeissenberg OH measurements and a conclusive statement can not be given. A stronger disagreement is found for winter where our mean NOxlifetime values are nearly a factor of two smaller than the
literature values shown in Fig. 6.
ACPD
7, 429–468, 2007SCIAMACHY tropospheric NO2
over the Alpine region D. Schaub et al. Title Page Abstract Introduction Conclusions References Tables Figures ◭ ◮ ◭ ◮ Back Close
Full Screen / Esc
Printer-friendly Version
Interactive Discussion Our wintertime estimate could differ (i) due to the focus on a rather polluted region
(in contrast to the zonal mean value given by Martin et al. (2003)), (ii) due to additional wintertime NOxloss mechanisms besides the oxidation to HNO3 (which was the only
loss considered by Martin et al. (2003) and for calculating the NOxlifetime from the Ho-henpeissenberg OH data) or (iii) due to our approach focusing directly on the location
5
of the NOxemissions (in contrast to Beirle et al. (2003) who estimated the NOxlifetime
from GOME NO2 VTCs downwind of emitting regions in Germany). However, based on the fact that the very similar wintertime NOxlifetime estimates given by Martin et al.
(2003) and Beirle et al. (2003) and calculated from the Hohenpeissenberg OH mea-surements have been derived with independent methods, one could also argue that our
10
wintertime NOx lifetime estimate (and, possibly, less pronounced also the spring and fall estimates) are too low. The disregard of the horizontal transport (smearing effect) could partly explain our lower values. However, due to the focus on anticyclonic clear sky conditions with enhanced photochemical activity and generally low wind speeds the importance of the smearing effect decreases and we suppose that other reasons
15
could additionally play a role.
In our approach, a higher lifetime is associated with a steeper slope in Fig. 5, i.e. higher space-borne NO2 VTCs over highly emitting regions. We therefore explore
whether, most pronounced in winter, SCIAMACHY retrievals might underestimate the NO2VTCs over the polluted Swiss Plateau.
20
4.2 Comparing GOME and SCIAMACHY NO2VTCs over the Swiss Plateau
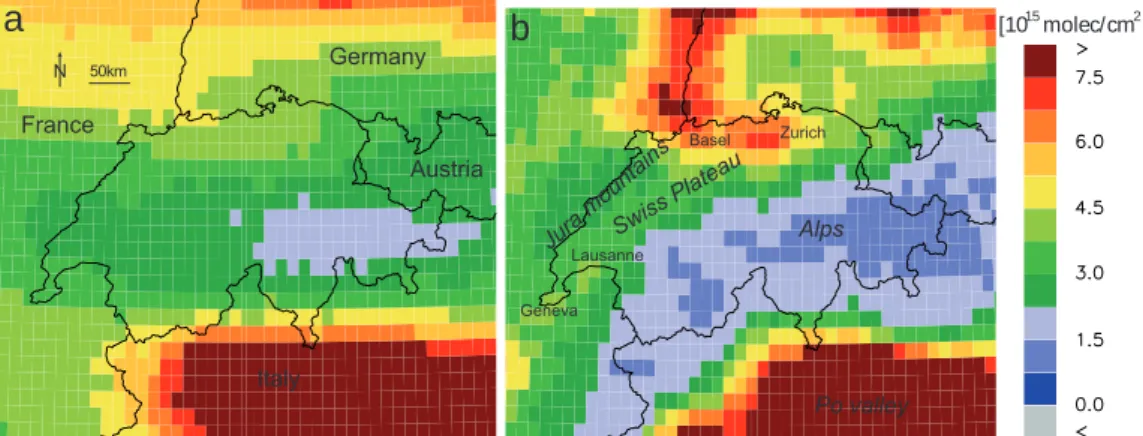
For a qualitative comparison of clear sky (pixel cloud fraction ≤0.1) GOME and SCIA-MACHY NO2 VTCs, the data are mapped onto a fine 0.125
◦
×0.125◦ grid covering Switzerland and surroundings. For each cell a mean VTC is computed by averaging over all SCIAMACHY (2003–2005) (Fig. 7a) or GOME (1996–2003) (Fig. 7b) pixels
25
covering the given cell. In contrast to the picture derived from the GOME columns, the higher resolved SCIAMACHY data clearly indicate individual population/industry cen-tres such as the areas of Zurich and Basel as well as the Alpine chain and the Jura
ACPD
7, 429–468, 2007SCIAMACHY tropospheric NO2
over the Alpine region D. Schaub et al. Title Page Abstract Introduction Conclusions References Tables Figures ◭ ◮ ◭ ◮ Back Close
Full Screen / Esc
Printer-friendly Version
Interactive Discussion Mountains.
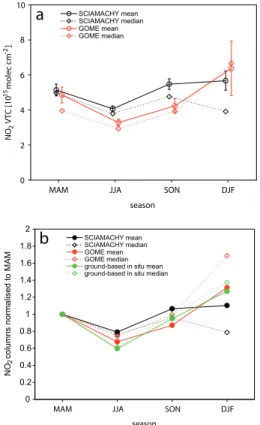
For a more quantitative comparison seasonally averaged GOME and SCIAMACHY NO2VTCs are calculated from all clear sky pixels with centre coordinates located within
the region ROISP (Fig. 1) covering the polluted regions of the Swiss Plateau (7 ◦
E – 9.5◦E, 47◦N – 47.75◦N) only. Similar to Schaub et al. (2006), the ROISP excludes the
5
complex Alpine terrain as far as possible. In Fig. 8a the resulting SCIAMACHY NO2
VTCs are on average higher than the GOME columns in spring, summer and autumn. This can be understood because the extended GOME pixels always include less pol-luted regions outside of the Swiss Plateau. Surprisingly, the wintertime SCIAMACHY NO2VTC values are lower than the ones from GOME.
10
Figure 8b shows the same comparison with the seasonal mean columns normalised to the spring (MAM) season. Additionally, seasonally averaged NO2columns estimated
from NO2data measured in situ between January 1997 and June 2003 at 15
ground-based sites at different altitudes in Switzerland and Southern Germany are shown. The elevated sites are assumed to detect NO2concentrations that are approximately rep-15
resentative for the appropriate height in the (free) troposphere over flat terrain. These measurements, together with boundary layer in situ measurements and an assumed mixing ratio of 0.02 ppb at 8 km, are used to construct NO2profiles. The latter are
sub-sequently integrated to tropospheric NO2columns. Details on the data set and method
of deriving vertical NO2profiles/columns can be found in Schaub et al. (2006). For the 20
present study, the ground-based in situ data set is restricted to all clear sky days as indicated by the sunshine and high fog parameters from the Alpine Weather Statistics (MeteoSwiss, 1985) and the columns reach down to an assumed mean Swiss Plateau height of 450 m asl. The normalised seasonal variation of the ground-based data again indicates the highest NO2 columns over the Swiss Plateau to occur during the winter 25
season, which is better reflected by the GOME columns and expected due to the higher NOxlifetime in winter. Moreover, the seasonal variation of space-borne NO2VTCs over industrialised regions with a distinct wintertime maximum has also been described by Petritoli et al. (2004), Richter et al. (2005), van der A et al. (2006) and Uno et al. (2006).
ACPD
7, 429–468, 2007SCIAMACHY tropospheric NO2
over the Alpine region D. Schaub et al. Title Page Abstract Introduction Conclusions References Tables Figures ◭ ◮ ◭ ◮ Back Close
Full Screen / Esc
Printer-friendly Version
Interactive Discussion Although in Fig. 8a SCIAMACHY and GOME have been sampled differently in space
and time and, thus, a perfect agreement is not expected, it seems likely that SCIA-MACHY values over the Swiss Plateau are underestimated in this season. A possible reason for this is discussed in the following section.
4.3 Inaccurate pixel surface pressure as a possible reason for too low wintertime
5
SCIAMACHY NO2VTC retrievals over the Swiss Plateau
4.3.1 GOME and SCIAMACHY pixel surface pressures
Richter and Burrows (2002) and Boersma et al. (2004) discussed errors of GOME NO2 VTC retrievals which in principle also apply to SCIAMACHY retrievals. They
re-ported on the following retrieval parameters inducing inaccuracies in the AMF
calcula-10
tion, which is the major error source for tropospheric retrievals over polluted regions: the a priori NO2 profile shape, the surface albedo, cloud characteristics (fraction and
height) and aerosol concentration. Here, we propose an additional source for sys-tematic errors of SCIAMACHY NO2 VTCs over the Swiss Plateau: the mean surface
pressure (or height) assumed for the retrieval of an individual pixel. This influence has
15
not been investigated in the literature so far. Note that for large parts of the world, the mean surface pressures taken from global models are accurate enough. Over the Alpine topography, however, mean surface pressures taken from a coarsely resolved model could be problematic, particularly for higher resolved satellite pixels. Figure 9 illustrates the situation over the Alpine region: in a coarsely resolved model (e.g. global
20
CTM used for the retrieval), the topography is averaged over extended grid elements, typically leading to an underestimation of the effective elevation of mountains and an overestimation of the effective ground height in the vicinity of the mountains. Due to the different horizontal extensions of GOME and SCIAMACHY pixels, it can be expected that the mean model heights calculated over the smaller SCIAMACHY pixels show a
25
larger deviation from the averaged real surface heights than the mean model heights calculated over the extension of a GOME pixel.
ACPD
7, 429–468, 2007SCIAMACHY tropospheric NO2
over the Alpine region D. Schaub et al. Title Page Abstract Introduction Conclusions References Tables Figures ◭ ◮ ◭ ◮ Back Close
Full Screen / Esc
Printer-friendly Version
Interactive Discussion For each GOME (1996–2003) and SCIAMACHY (2003–2005) pixel above ROICH
(Fig. 1) the original mean pixel surface pressure psurf derived from ECMWF/TM4 and
peff determined from the aLMo topography (Sect. 3.2) are converted to m asl based on pressure profiles derived from measurements at different altitudes in Switzerland. Figure 10 shows the resulting histogram distribution of ∆surf = hsurf−hefffor the GOME 5
(Fig. 10a) and SCIAMACHY (Fig. 10b) pixels and Fig. 11 indicates the pixel centre locations and corresponding values of ∆surf. The following conclusions can be drawn:
– Due to the smoothed topography in ECMWF/TM4, the surface heights of the
GOME and SCIAMACHY pixels are underestimated over the Alps and overes-timated over the Swiss Plateau (Fig. 11).
10
– Lower minimum and higher maximum for ∆surf are found for SCIAMACHY pixels
(Figs. 10 and 11). This can be expected due to the smaller pixel size of SCIA-MACHY compared to GOME (Fig. 9).
The above points confirm our expectation that certain parameters, such as the mean pixel surface pressure, can become increasingly inaccurate for better resolved satellite
15
data if the spatial resolution of the forward model parameters is not improved accord-ingly. In the following section, the effect of an inaccurate pixel surface pressure on the resulting NO2VTC is investigated for selected SCIAMACHY columns.
4.3.2 Effect of inaccurate pixel surface pressure on SCIAMACHY retrievals
Figure 12 illustrates the situation over the Swiss Plateau where hsurf>heff (for the Alps 20
the situation is reversed with hsurf<heff). Following Eq. (1) (Sect. 2.1) and the formu-lation for the AMFtrop given there, the following systematic errors due to inaccurate
surface heights are expected:
– For positive ∆surf (hsurf>heff; e.g. over the Swiss Plateau, Figs. 11 and 12) the
near-ground NO2pollution is in reality located at a lower level than assumed in the 25
ACPD
7, 429–468, 2007SCIAMACHY tropospheric NO2
over the Alpine region D. Schaub et al. Title Page Abstract Introduction Conclusions References Tables Figures ◭ ◮ ◭ ◮ Back Close
Full Screen / Esc
Printer-friendly Version
Interactive Discussion data retrieval. The retrieval therefore associates the high near-ground pollution
with a too high sensitivity. This leads to an overestimated AMFtrop and, thus, to an underestimated NO2VTC.
– For negative ∆surf (hsurf<heff, e.g. over the Alps, Fig. 11) we expect a tendency
towards overestimation of the NO2VTCs.
5
The effect of inaccurate pixel surface pressures is investigated following the method described in Sect. 3.2. Clear sky SCIAMACHY NO2VTCs are selected over the
north-eastern Swiss Plateau with a smooth topography (Fig. 2). Table 2 presents an overview over the SCIAMACHY pixel parameters and the (re-)processed AMFstrop. The
compar-ison of the surface pressures psurfand peffshows that in the region of the north-eastern 10
Swiss Plateau the surface pressures differ by about 50 hPa, which corresponds to ∼450 m.
The mean relative change in the AMFstropdue to the changing pixel surface pressure
is –27.2±1.3% and –11.7±1.8% for the profile shapes A and B (Fig. 3), respectively. The mean relative change in the resulting NO2VTCs is +37.5±2.4% and +13.3±2.4%, 15
respectively. Obviously, the changes in the AMFstropand the NO2VTCs due to changes
in the pixel surface pressure are strongly dependent on the NO2profile shape. Given the distinctly different shapes A and B, the 13–38% NO2VTC error range is a
reason-able first estimate of the effect of errors in the pixel surface pressure over a non-trivial topography.
20
The present sensitivity study is a first-order estimate of the effect of changing pixel surface pressure for a limited subset of SCIAMACHY pixels and based on assumed a priori profile shapes. Depending on the NOx emissions taking place at the pixel loca-tion, photochemical activity and prevailing meteorological conditions, real NO2 profile
shapes can differ from the shapes A and B used here. Nevertheless, we suggest
25
that inaccurate pixel surface pressures used for the NO2 retrieval over regions with a
marked topography can have a considerable effect on the resulting columns. For re-trievals in the UV-visible spectral range with a significant decrease of the sensitivity
ACPD
7, 429–468, 2007SCIAMACHY tropospheric NO2
over the Alpine region D. Schaub et al. Title Page Abstract Introduction Conclusions References Tables Figures ◭ ◮ ◭ ◮ Back Close
Full Screen / Esc
Printer-friendly Version
Interactive Discussion towards the earth’s surface, this effect is of major importance when the NO2 resides
close to the ground. This situation is most pronounced in winter. Thus, the tendency for underestimated wintertime SCIAMACHY NO2VTCs over the Swiss Plateau described
earlier could at least partly be explained by inaccuracies in the mean pixel surface pressure.
5
For GOME NO2 VTCs over heavily polluted regions (NO2
VTC>1.0×10¹⁵molec cm−2), Boersma et al. (2004) estimated mean AMFtrop
un-certainties of 15%, 2%, 15% and 9% due to inaccuracies in the cloud fraction, the cloud top height, the surface albedo and the a priori NO2 profile shape, respectively.
Even though GOME uncertainties can not directly be transferred to SCIAMACHY
10
retrievals, the orders of magnitude let us assume that the effect of an inaccurate pixel surface pressure on the AMFtrop of 12–27% is of equal importance as other types
of errors for tropospheric retrievals over regions with a marked topography such as Switzerland.
5 Summary and conclusions
15
This study has evaluated SCIAMACHY NO2 VTCs above Switzerland and the Alpine
region. The clear relationship between a spatially and temporally highly resolved Swiss NOx emission inventory and SCIAMACHY NO2 columns under anticyclonic
meteoro-logical conditions has demonstrated the ability of SCIAMACHY to detect the main NOx
pollution features in Switzerland. The decreasing correlation between the two
quan-20
tities when taking into account cloudy pixels indicates that SCIAMACHY is less likely to accurately detect sources of air pollution in cloudy situations. From the relation be-tween the SCIAMACHY data and the NOx emission inventory, seasonal NOx lifetime estimates have been derived. Summertime NOxlifetimes have been found to be 3.2–
3.4 h. These values agree well with lifetime estimates from literature. The plausibility of
25
the NOxlifetimes estimated for winter is difficult to assess because of the lack of such data in literature. The values found from two studies and calculated here based on
ACPD
7, 429–468, 2007SCIAMACHY tropospheric NO2
over the Alpine region D. Schaub et al. Title Page Abstract Introduction Conclusions References Tables Figures ◭ ◮ ◭ ◮ Back Close
Full Screen / Esc
Printer-friendly Version
Interactive Discussion OH concentration data are not necessarily representative for the study region.
Never-theless, an underestimation of the wintertime NOxlifetime based on the SCIAMACHY
measurements can not be ruled out.
A comparison of SCIAMACHY and GOME NO2VTCs has shown the improvement of better resolved space-borne data with regard to monitoring the NO2pollution distribu-5
tion on a regional scale. However, the quantitative comparison of seasonally averaged SCIAMACHY and GOME NO2 VTCs provides evidence for SCIAMACHY NO2 VTCs tending to systematically underestimate the tropospheric NO2columns over the Swiss
Plateau during winter. This is further supported by the seasonal variation of NO2
mea-sured at ground-based in situ sites that is better reflected in the GOME columns.
10
A possible explanation for underestimated SCIAMACHY NO2 VTCs over the Swiss Plateau is the use of inaccurate satellite pixel surface pressures derived from coarsely resolved global models in the retrieval. It has been found that the marked topography in the Alpine region can lead to deviations of several hundred meters between the assumed and the real mean surface height over a pixel, particularly pronounced for
15
the smaller sized SCIAMACHY pixels. The resulting effect has been estimated based on selected clear sky SCIAMACHY NO2VTCs over the Swiss Plateau and two fixed a priori NO2 profile shapes. An effect in the 10–40% range has been found for different
profile shapes. Although real NO2profile shapes can differ from the fixed profiles used
for the sensitivity study, the result suggests that inaccurate pixel surface pressures
20
have a considerable effect on the NO2column retrieval.
In general, for the air pollution monitoring on a regional scale, higher resolved space-borne data are strongly required and very useful. SCIAMACHY NO2VTCs have shown to be sensitive to the near-ground NO2 pollution in Switzerland. However, we further
conclude from this study that in order to fully exploit the potential of such data, the
25
retrieval should be done on a scale that better fits the satellite pixel size. This is of increasing importance with regard to the decreasing pixel sizes from 320×40 km2 (GOME) to 60×30 km2(SCIAMACHY) to 13×24 km2(OMI).
Acknowledgements. This work was funded by the Swiss Federal Office for the Environment 449
ACPD
7, 429–468, 2007SCIAMACHY tropospheric NO2
over the Alpine region D. Schaub et al. Title Page Abstract Introduction Conclusions References Tables Figures ◭ ◮ ◭ ◮ Back Close
Full Screen / Esc
Printer-friendly Version
Interactive Discussion (FOEN). For providing information on ground-based NO2 measurements in Switzerland we
acknowledge the Swiss National Air Pollution Monitoring Network (NABEL) and M. Steinbacher. Furthermore we thank I. DeSmedt and M. Van Roozendael (BIRA/IASB) and H. Eskes and R. van der A (KNMI) for their work on making available the TEMIS GOME and SCIAMACHY NO2data set used in this study.
5
References
Beirle, S., Platt, U., Wenig, M., and Wagner, T.: Weekly cycle of NO2by GOME measurements: a signature of anthropogenic sources, Atmos. Chem. Phys., 3, 2225–2232, 2003,
http://www.atmos-chem-phys.net/3/2225/2003/.
Beirle, S., Platt, U., Wenig, M., and Wagner, T.: Highly resolved global distribution of
tropo-10
spheric NO2 using GOME narrow swath mode data, Atmos. Chem. Phys., 4, 1913–1924, 2004,
http://www.atmos-chem-phys.net/4/1913/2004/.
Boersma, K. F., Eskes, H. J., and Brinksma, E. J.: Error analysis for tropospheric NO2retrieval from space, J. Geophys. Res., 109, art. no. 4311, 2004.
15
Bovensmann, H., Burrows, J. P., Buchwitz, M., Frerick, J., No ¨el, S., and Rozanov, V. V.: SCIA-MACHY: Mission objectives and measurement modes, J. Atmos. Sci., 56, 2, 127–150, 1999. Burrows, J. P., Weber, M., Buchwitz, M., Rozanov, V., Ladst ¨atter-Weissenmayer, A., Richter, A.,
DeBeek, R., Hoogen, R., Bramstedt, K., Eichmann, K. U., Eisinger, M., and Perner, D.: The global ozone monitoring experiment (GOME): Mission concept and first scientific results, J.
20
Atmos. Sci., 56, 151–175, 1999.
Chu, S. H. and Meyer, E. L.: Use of ambient ratios to estimate impact of NOx sources on annual NO2 concentrations, Proceedings, 84th Annual Meeting & Exhibition of the Air & Waste Management Association, Vancouver, B.C., 16–21 June 1991, 16 pp., 1991.
Dentener, F. J. and Crutzen, P. J.: Reaction of N2O5 on tropospheric aerosols: impact on the
25
global distributions of NOx, O3and OH, J. Geophys. Res., 98, 7149–7163, 1993.
Dentener, F. J., van Weele, M., Krol, M., Houweling, S., and van Velthoven, P.: Trends and inter-annual variability of methane emissions derived from 1979–1993 global CTM simulations, Atmos. Chem. Phys., 3, 73–88, 2003,
http://www.atmos-chem-phys.net/3/73/2003/.
30
ACPD
7, 429–468, 2007SCIAMACHY tropospheric NO2
over the Alpine region D. Schaub et al. Title Page Abstract Introduction Conclusions References Tables Figures ◭ ◮ ◭ ◮ Back Close
Full Screen / Esc
Printer-friendly Version
Interactive Discussion Dommen, J., Pr ´ev ˆot, A. S. H., Hering, A. M., Staffelbach, T., Kok, G. L., and Schillawski, R.
D.: Photochemical production and aging of an urban air mass, J. Geophys. Res., 104, D5, 5493–5509, 1999.
Eskes, H. J.: Combined retrieval, modeling and assimilation approach to GOME NO2, in GOA final report, European Commission 5th framework programme 1998–2002, EESD-ENV-99-2,
5
116–122, Eur. Comm., De Bilt, Netherlands, 2003.
Finlayson-Pitts, B. J. and Pitts, J. N.: Chemistry of the upper and lower Atmosphere - Theory, Experiments and Applications, Academic Press, San Diego, CA, 2000.
FOEN (Swiss Federal Office for the Environment, BAFU): Vom Menschen verursachte Luftschadstoffemissionen in der Schweiz von 1900 bis 2010, Schriftenreihe Umwelt Nr. 256,
10
1995.
FOEN (Swiss Federal Office for the Environment, BAFU): NABEL – Luftbelastung 2004, Schriftenreihe Umwelt Nr. 388, 2005.
IPCC, Climate Change 2001: The Scientific Basis. Contribution of Working Group I to the Third Assessment Report of the Intergovernmental Panel on Climate Change, Cambridge
15
University Press, Cambridge, UK and New York, USA, 2001.
Jaegl ´e, L., Jacob, D. J., Wang, Y., Weinheimer, A. J., Ridley, B. A., Campos, T. L., Sachse, G. W., and Hagen, D. E.: Sources and chemistry of NOx in the upper troposphere over the United States, Geophys. Res. Lett., 25, 1705–1708, 1998.
Keller, J., Andreani-Aksoyoglu, S., Tinguely, M., and Pr ´ev ˆot, A. S. H.: Emission Scenarios
20
1985–2010: Their Influence on Ozone in Switzerland, PSI Bericht Nr. 05-07, Paul Scherrer Institut, Villigen PSI, 2005.
Keller, M. and Zbinden, R.: Luftschadstoffemissionen des Strassenverkehrs 1980–2030, Schriftenreihe Umwelt Nr. 355, FOEN (Swiss Federal Office for the Environment), 2004. Koelemeijer, R. B. A., Stammes, P., Hovenier, J. W., and de Haan, J. F.: A fast method for
25
retrieval of cloud parameters using oxygen A-band measurements from Global Ozone Mon-itoring Experiment, J. Geophys. Res., 106, 3475–3490, 2001.
Kramm, G., Dlugi, R., Dollard, G. J., Foken, T., M ¨olders, N., M ¨uller, H., Seiler, W., and Sievering, H.: On the dry deposition of ozone and reactive nitrogen species, Atmos. Environ., 29, 3209– 3231, 1995.
30
K ¨uhlwein, J.: Uncertainties in the arithmetical determination of pollutant emissions from road traffic and demands on future models, PhD thesis, University of Stuttgart, 2004.
K ¨uhlwein, J. and Friedrich, R.: Uncertainties of modelling emissions from road transport, At-451
ACPD
7, 429–468, 2007SCIAMACHY tropospheric NO2
over the Alpine region D. Schaub et al. Title Page Abstract Introduction Conclusions References Tables Figures ◭ ◮ ◭ ◮ Back Close
Full Screen / Esc
Printer-friendly Version
Interactive Discussion mos. Environ., 34, 4603–4610, 2000.
Kunhikrishnan, T., Lawrence, M. G., von Kuhlmann, R., Richter, A., Ladst ¨atter-Weissenmayer, A., and Burrows, J. P.: Analysis of tropospheric NOx over Asia using the model of atmo-spheric transport and chemistry (MATCH-MPIC) and GOME-satellite observations, Atmos. Environ., 38, 581–596, 2004.
5
Leue, C., Wenig, M., Wagner, T., Klimm, O., Platt, U., and Jahne, B.: Quantitative analysis of NOx emissions from Global Ozone Monitoring Experiment satellite image sequences, J. Geophys. Res., 106, 5493–5505, 2001.
Martin, R. V., Jacob, D. J., Chance, K., Kurosu, T. P., Palmer, P. I., and Evans, M. J.: Global inventory of nitrogen oxide emissions constrained by space-based observations of
10
NO2columns, J. Geophys. Res., 108, D17, 4537, doi:10.1029/2003JD003453, 2003.
MeteoSwiss: Alpine Weather Statistics (Alpenwetterstatistik - Witterungskalender: Beschrei-bung der einzelnen Parameter), MeteoSwiss, Switzerland, 1985.
Mihelcic, D., Holland, F., Hofzumahaus, A., Hoppe, L., Konrad, S., M ¨usgen, P., P ¨atz, H.-W., Sch ¨afer, H.-J., Schmitz, T., Volz-Thomas, A., B ¨achmann, K., Schlomski, S., Platt, U.,
15
Geyer, A., Alicke, B., and Moortgat, G. K.: Peroxy radicals during BERLIOZ at Pabsttum: measurements, radical budgets and ozone production, J. Geophys. Res., 108, D4, 8254, doi:10.1029/2001JD001014, 2003.
Nakamura, K., Kondo, Y., Chen, G., Crawford, J. H., Takegawa, N., Koike, M., Kita, K., Miyazaki, Y., Shetter, R. E., Lefer, B. L., Avery, M., and Matsumoto, J.: Measurement of NO2by the
pho-20
tolysis conversion technique during the Transport and Chemical Evolution Over the Pacific (TRACE-P) campaign, J. Geophys. Res., 108, art. no. 4752, doi:10.1029/2003JD003712, 2003.
Nunnermacker, L. J., Kleinman, L. I., Imre, D., Daum, P. H., Lee, Y.-N., Lee, J. H., Springston, S. R., and Newman, L.: NOy lifetimes and O3 production efficiencies in urban and power
25
plant plumes: analysis of field data, J. Geophys. Res., 105, D7, 9165–9176, 2000.
Palmer, P. I., Jacob, D. J., Chance, K., Martin, R. V., Spurr, R. J. D., Kurosu, T. P., Bey, I., Yan-tosca, R., Fiore, A., and Li, Q.: Air mass factor formulation for spectroscopic measurements from satellites: Application to formaldehyde retrievals from the Global Ozone Monitoring Ex-periment, J. Geophys. Res., 106, 14 539–14 550, 2001.
30
Palmer, P. I., Jacob, D. J., Fiore, A. M., Martin, R. V., Chance, K., and Kurosu, T. P.: Map-ping isoprene emissions over North America using formaldehyde column observations from space, J. Geophys. Res., 108, D6, 4180, doi:10.1029/2002JD002153, 2003.
ACPD
7, 429–468, 2007SCIAMACHY tropospheric NO2
over the Alpine region D. Schaub et al. Title Page Abstract Introduction Conclusions References Tables Figures ◭ ◮ ◭ ◮ Back Close
Full Screen / Esc
Printer-friendly Version
Interactive Discussion Petritoli, A., Bonasoni, P, Giovanelli, G., Ravegnani, F., Kostadinov, I., Bortoli, D., Weiss, A.,
Schaub, D., Richter, A., and Fortezza, F.: First comparison between ground-based and satellite-borne measurements of tropospheric nitrogen dioxide in the Po basin, J. Geophys. Res., 109, D15307, doi:10.1029/2004JD004547, 2004.
Richter, A. and Burrows, J. P.: Tropospheric NO2from GOME measurements, Adv. Space Res.,
5
29, 1673–1683, 2002.
Richter, A., Burrows, J. P., N ¨uss, H., Granier, C., and Niemeier, U.: Increase in tropospheric nitrogen dioxide over China observed from space, Nature, 437, doi:10.1038/nature04092, 2005.
Rohrer, F. and Berresheim, H.: Strong correlation between levels of tropospheric hydroxyl
radi-10
cals and solar ultraviolet radiation, Nature, 442, 184–187, 2006.
Ryerson, T. B., Buhr, M. P., Frost, G. J., Goldan, P. D., Holloway, J. S., H ¨ubler, G., Jobson, B. T., Kuster, W. C., McKeen, S. A., Parrish, D. D., Roberts, J. M., Sueper, D. T., Trainer, M., Williams, J., and Fehsenfeld, F. C.: Emissions lifetimes and ozone formation in power plant plumes, J. Geophys. Res., 103, D17, 22 569–22 583, 1998.
15
Schaub, D., Boersma, K. F., Kaiser, J. W., Weiss, A. K., Eskes, H. J., and Buchmann, B.: Comparison of GOME tropospheric NO2 columns with NO2profiles deduced from ground-based in situ measurements, Atmos. Chem. Phys., 6, 3211–3229, 2006,
http://www.atmos-chem-phys.net/6/3211/2006/.
Schaub, D., Weiss, A. K., Kaiser, J. W., Petritoli, A., Richter, A., Buchmann, B., and Burrows, J.
20
P.: A transboundary transport episode of nitrogen dioxide as observed from GOME and its impact in the Alpine region, Atmos. Chem. Phys., 5, 23–37, 2005,
http://www.atmos-chem-phys.net/5/23/2005/.
Seinfeld, J. H. and Pandis, S. N.: Atmospheric chemistry and physics - from air pollution to climate change, John Wiley & Sons, New York, 1998.
25
Sillman, S.: Ozone production efficiency and loss of NOxin power plant plumes: photochemical
model and interpretation of measurements in Tennessee, J. Geophys. Res., 105, D7, 9189– 9202, 2000.
Solomon, S., Portmann, W., Sanders, R. W., Daniel, J. S., Madsen, W., Bartram, B., and Dutton, E. G.: On the role of nitrogen dioxide in the absorption of solar radiation, J. Geophys. Res.,
30
104, 12 047–12 058, 1999.
Spicer, C. W.: Nitrogen oxide reactions in the urban plume of Boston, Science, 215, 4536, 1095–1097, 1982.
ACPD
7, 429–468, 2007SCIAMACHY tropospheric NO2
over the Alpine region D. Schaub et al. Title Page Abstract Introduction Conclusions References Tables Figures ◭ ◮ ◭ ◮ Back Close
Full Screen / Esc
Printer-friendly Version
Interactive Discussion Stammes, P.: Spectral radiance modelling in the UV-Visible Range, in IRS 2000: Current
prob-lems in Atmospheric Radiation, Eds. W. L. Smith and Y. M. Timofeyev, A. Deepak Publ., Hampton (VA), 2001.
Uno, I., He, Y., Ohara, T., Yamaji, K., Kurokawa, J.-I., Katayama, M., Wang, Z., Noguchi, K., Hayashida, S., Richter, A., and Burrows, J. P.: Systematic analysis of interannual and
sea-5
sonal variations of model-simulated tropospheric NO2 in Asia and comparison with GOME-satellite data, Atmos. Chem. Phys. Disc., 6, 11 181–11 207, 2006.
Van der A, R. J., Peters, D. H. M. U., Eskes, H., Boersma, K. F., Van Roozendael, M., De Smedt, I., and Kelder, H. M.: Detection of the trend and seasonal variation in tropospheric NO2over China, J. Geophys. Res., 111, D12317, doi:10.1029/2005JD006594, 2006.
10
Vandaele, A. C., Fayt, C., Hendrick, F., et al.: An intercomparison campaign of ground-based UV-visible measurements of NO2, BrO, and OClO slant columns: Methods of analysis and results for NO2, J. Geophys. Res., 110, D08305, doi:10.1029/2004JD005423, 2005.
Volz-Thomas, A., Geiss, H., Hofzumahaus, A., and Becker, K.-H.: Introduction to spe-cial section: photochemistry experiment in BERLIOZ, J. Geophys. Res., 108, D4, 8252,
15
doi:10.1029/2001JD002029, 2003.
Volz-Thomas, A. and Kolahgar, B: On the budget of hydroxyl radicals at Schauinsland during the Schauinsland Ozone Precursor Experiment (SLOPE96), J. Geophys. Res., 105, D1, 1611–1622, 2000.
Warneck, P.: Chemistry of the natural atmosphere, second edition, Academic Press, London,
20
2000.
York, D.: Least-square fitting of a straight line, Can. J. Phys., 44, 1079–1086, 1966.
ACPD
7, 429–468, 2007SCIAMACHY tropospheric NO2
over the Alpine region D. Schaub et al. Title Page Abstract Introduction Conclusions References Tables Figures ◭ ◮ ◭ ◮ Back Close
Full Screen / Esc
Printer-friendly Version
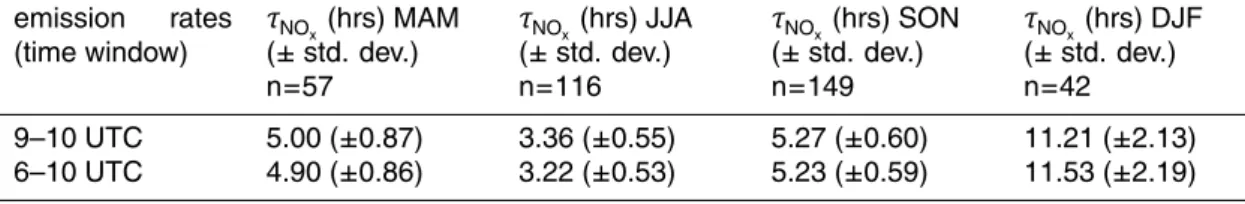
Interactive Discussion Table 1. Seasonal NOx lifetime estimates based on a weighted orthogonal regression for two
different time windows for averaging the emission rates over the SCIAMACHY pixels. The standard deviations are given by the standard deviations of the slopes of the regression lines.
emission rates (time window) τNO x(hrs) MAM (± std. dev.) n=57 τNO x(hrs) JJA (± std. dev.) n=116 τNO x(hrs) SON (± std. dev.) n=149 τNO x(hrs) DJF (± std. dev.) n=42 9–10 UTC 5.00 (±0.87) 3.36 (±0.55) 5.27 (±0.60) 11.21 (±2.13) 6–10 UTC 4.90 (±0.86) 3.22 (±0.53) 5.23 (±0.59) 11.53 (±2.19) 455
ACPD
7, 429–468, 2007SCIAMACHY tropospheric NO2
over the Alpine region D. Schaub et al. Title Page Abstract Introduction Conclusions References Tables Figures ◭ ◮ ◭ ◮ Back Close
Full Screen / Esc
Printer-friendly Version
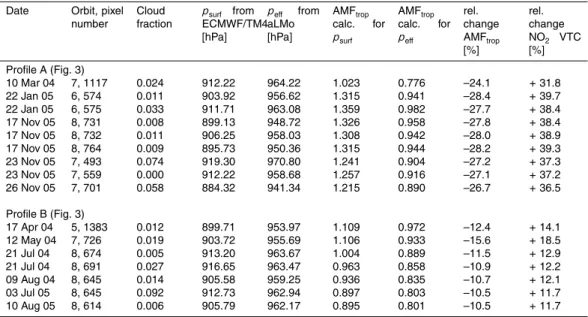
Interactive Discussion Table 2. Date, orbit/pixel number, cloud fraction, mean pixel specific ECMWF/TM4 surface
pressure psurf, mean pixel specific aLMo surface pressure peff, AMFtrop based on psurf and AMFtrop based on peff for the selected SCIAMACHY pixels. Further denoted are the resulting relative changes in both the AMFstropand the NO2VTCs.
Date Orbit, pixel number Cloud fraction psurf from ECMWF/TM4 [hPa] peff from aLMo [hPa] AMFtrop calc. for psurf AMFtrop calc. for peff rel. change AMFtrop [%] rel. change NO2 VTC [%] Profile A (Fig. 3) 10 Mar 04 7, 1117 0.024 912.22 964.22 1.023 0.776 –24.1 + 31.8 22 Jan 05 6, 574 0.011 903.92 956.62 1.315 0.941 –28.4 + 39.7 22 Jan 05 6, 575 0.033 911.71 963.08 1.359 0.982 –27.7 + 38.4 17 Nov 05 8, 731 0.008 899.13 948.72 1.326 0.958 –27.8 + 38.4 17 Nov 05 8, 732 0.011 906.25 958.03 1.308 0.942 –28.0 + 38.9 17 Nov 05 8, 764 0.009 895.73 950.36 1.315 0.944 –28.2 + 39.3 23 Nov 05 7, 493 0.074 919.30 970.80 1.241 0.904 –27.2 + 37.3 23 Nov 05 7, 559 0.000 912.22 958.68 1.257 0.916 –27.1 + 37.2 26 Nov 05 7, 701 0.058 884.32 941.34 1.215 0.890 –26.7 + 36.5 Profile B (Fig. 3) 17 Apr 04 5, 1383 0.012 899.71 953.97 1.109 0.972 –12.4 + 14.1 12 May 04 7, 726 0.019 903.72 955.69 1.106 0.933 –15.6 + 18.5 21 Jul 04 8, 674 0.005 913.20 963.67 1.004 0.889 –11.5 + 12.9 21 Jul 04 8, 691 0.027 916.65 963.47 0.963 0.858 –10.9 + 12.2 09 Aug 04 8, 645 0.014 905.58 959.25 0.936 0.835 –10.7 + 12.1 03 Jul 05 8, 645 0.092 912.73 962.94 0.897 0.803 –10.5 + 11.7 10 Aug 05 8, 614 0.006 905.79 962.17 0.895 0.801 –10.5 + 11.7 456
ACPD
7, 429–468, 2007SCIAMACHY tropospheric NO2
over the Alpine region D. Schaub et al. Title Page Abstract Introduction Conclusions References Tables Figures ◭ ◮ ◭ ◮ Back Close
Full Screen / Esc
Printer-friendly Version Interactive Discussion 100 km
ROI
ROI
CH SPSwiss Plat
eau
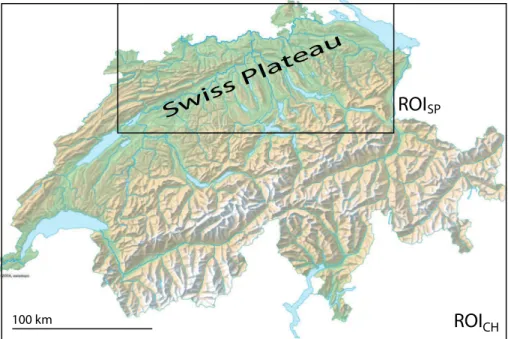
Fig. 1. Regions of interest used in this study covering the whole Switzerland (6◦E–10.5◦E, 45.75◦
N–47.75◦
N, ROICH) and the polluted Swiss Plateau (7◦
E–9.5◦
E, 47◦
N–47.75◦
N, ROISP). (Topographic map of Switzerland: © 2005 swisstopo).
ACPD
7, 429–468, 2007SCIAMACHY tropospheric NO2
over the Alpine region D. Schaub et al. Title Page Abstract Introduction Conclusions References Tables Figures ◭ ◮ ◭ ◮ Back Close
Full Screen / Esc
Printer-friendly Version
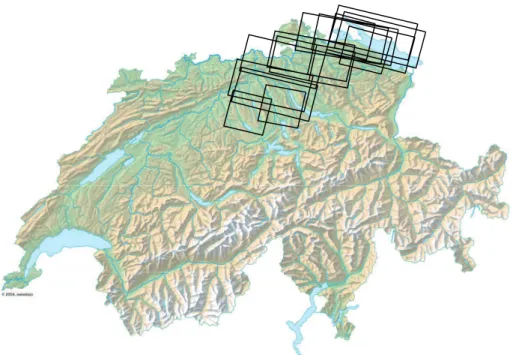
Interactive Discussion Fig. 2. Topographic map of Switzerland (© 2005 swisstopo) with the location of the
SCIA-MACHY pixels used for the pixel surface pressure sensitivity calculation.