Aeroelastic optimization of thin flapping structure
by
MASSAC]H'!SE11TINTEOFT N Y
Grace Swee See
Goon
JUL 1
1
2017
B.A., Cambridge University (2010)
M.Eng, Cambridge University (2011)
LIBRARIES
Submitted to the Department of Aeronautical and Astronautical
ARCHIVES
Engineering
in partial fulfillment of the requirements for the degree of
Master of Science in Aeronautical and Astronautical Engineering
at the
MASSACHUSETTS INSTITUTE OF TECHNOLOGY
June 2017
@
Massachusetts Institute of Technology 2017. All rights reserved.
Signature redacted
A uthor ...
...
Department of Aeronautical and Astronautical Engineering
Signature redacted
May
18, 2017C ertified by ...
...
Pedro M. Reis
Associate Professor of Mechanical Engineering and Civil and
Environmental Engineering
Thesis Supervisor
Accepted by...Signature
redacted
Youssef M. Marzouk
Associate Professor of Aeronautics and Astronautics
Chair, Graduate Program Committee
77 Massachusetts Avenue
Cambridge, MA 02139
M
ITLibranes
http://Iibraries.mit.edu/askDISCLAIMER NOTICE
Due to the condition of the original material, there are unavoidable flaws in this reproduction. We have made every effort possible to provide you with the best copy available.
Thank you.
The images contained in this document are of the best quality available.
Aeroelastic optimization of thin flapping structure by
Grace Swee See Goon
Submitted to the Department of Aeronautical and Astronautical Engineering on May 18, 2017, in partial fulfillment of the
requirements for the degree of
Master of Science in Aeronautical and Astronautical Engineering
Abstract
We study the flow generated when a handheld fan is waved. This fluid-structure in-teraction problem is investigated through precision experiments, using an oscillating semi-circular elastic plate as a reduced analog model. The aerodynamic performance of the fans is systematically characterized for a variety of geometric and material pa-rameters, as well as the amplitude of the periodic driving. We demonstrate that the bending stiffness of the structure can be tuned to maximize the output of the gener-ated airflow, while simultaneously minimizing the input power. A design guideline is established for this optimal conditions based on matching the driving and the natural frequencies of the plate. Closer to the handheld fans, we then consider a discrete analog model comprising an array of overlapping strips. Unlike homogeneous plates, these discrete designs deform passively into shapes with finite Gaussian curvature and further enhance the generated flow. Finally, we explored the effect of corrugation on the flapping plate and found that the fan employs the interesting mechanism of reversible buckling to simultaneously increase the velocity of the flow and reduce the load.
Thesis Supervisor: Pedro M. Reis
Title: Associate Professor of Mechanical Engineering and Civil and Environmental Engineering
Acknowledgments
Firstly, I would like to take this opportunity to thank my advisor, Professor Pedro Reis for his guidance throughout this work. I would also like to thank Joel Marthelot, with whom I collaborated with on this work. I am also grateful for the members of the EGS.Lab who are always willing to provide advice and assistance. Next, I want to thank everyone here at MIT (especially the GCF and SSS friends) who had encouraged me through this process. I am also grateful to my parents back at home for being supportive. Finally, to my husband, Sam Elder for his love and care. Soli Deo Gloria.
Contents
1 Introduction 11
1.1 Past Studies of Flapping Plates . . . . 13
1.2 The Hand Fan as an Analog Model to Study Flapping Structures . 15 1.3 Plate Bending and Vibration Theory . . . . 16
1.3.1 Orthotropic Plates . . . . 21
1.3.2 Anisotropy of the Hand Fan and the Effect on Natural Frequency 23 1.4 O utline of Thesis . . . . 24
2 Experimental Apparatus 25 2.1 Flow Generation Experiment . . . . 26
2.1.1 Control of the Flapping Motion . . . . 27
2.1.2 Measurement of Flow Generated by the Fans or Models . . . . 28
2.1.3 Torque Measurement . . . . 31
2.1.4 Strobe Still Photography . . . . 31
2.2 Measurement of Natural Frequency Using a Laser Vibrometer . . . . 34
2.3 Experimental Specimens . . . . 37
2.3.1 Materials and Structures of Spanish Hand Fans . . . . 37
2.3.2 Fabrication of Flat Semi-circular Plates . . . . 41
2.3.3 Fabrication and Design of Discrete Model Fans . . . . 43
2.3.4 Fabrication and Design of Corrugated Fans . . . .. 44
2.4 Flexural Stiffness Measurement of Hand Fans . . . . 46
3 Aeroelastic Behaviour of Flapping Flat Plates 3.1 Natural Frequency of the Flat Plates ...
3.2 Phase Averaged Velocity and Vortex Generation .
3.3 Placement of Hot-Wire Anemometer Probe . . . .
3.4 Flow Generation and Power Efficiency of Flapping 3.4.1 Velocity of Generated Flow . . . .
3.4.2 Power Efficiency of Flat Plate . . . .
3.5 Euler-Bernoulli Equation . . . . 3.5.1 Order of Magnitude of the Moment Terms
3.6 O utlook . . . .
Flat Plate.
4 Aeroelastic Behavior of Heterogeneous Plates
4.1 Aeroelastic Behavior of the Hand Fans . . . . 4.1.1 Mode Shape of Hand Fans . . . . 4.1.2 Natural Frequency of Hand Fans . . . . 4.1.3 Flow Generated by the Hand Fan . . . . 4.1.4 Power Efficiency of the Flapping Hand Fan . . . . 4.2 Aeroelastic Behavior of the Discrete Models . . . . 4.2.1 Natural Frequency and Flow Generated by the Discrete Models
4.2.2 Power Efficiency of the Flapping Discrete Models . . . . 4.3 Comparison of Instantaneous Deflection of Flat Plates, Hand Fans and D iscrete M odels . . . . 4.4 Outlook on Discrete Section Designs . . . . 4.5 Aeroelastic Behavior of Corrugated Plates . . . . 4.5.1 Mechanical Properties of Corrugated Plates . . . . 4.5.2 Flow Generation of Flapping Corrugated Fans . . . . 4.5.3 Power Efficiency of Flapping Corrugated Fans . . . . 4.6 Outlook of Corrugated Fan. . . . .
5 Conclusion 5.1 Summary of Findings . . . . 8 49 50 53 55 56 57 60 64 68 71 73 74 74 76 77 79 82 82 84 85 87 88 88 93 96 98 99 99
5.1.1 Homogeneous Semi-circular Plates . . . .
5.1.2 Commercially Available Spanish Handheld Fans .
5.1.3 Discrete Model Fans . . . . 5.1.4 Corrugated Plates . . . .
5.2 Application to Biomimetic Flapping Structures . . . . . 5.3 Future W ork . . . . 5.3.1 Optimizing Discrete Section Models . . . .
5.3.2 Visualization of Deformation and Optimization of Corrugated Plates . . . .
5.3.3 Venation Network . . . . 5.3.4 Porosity of the Flapping Structure . . . .
. . . . 100 . . . . 100 . . . . 101 . . . . 101 . . . . 102 . . . . 103 . . . . 103 . . . . 103 . . . . 104 . . . . 104
Chapter 1
Introduction
In nature, flapping plates structures are often exploited dynamically in the biolocomo-tion of flying insects, birds and fishes. The animals are not only required to generate lift equal to their weight but also sufficient lift for acceleration from rest [56]. Some flying animals such as bats and insects were found to be able to generate maximum lift of up to 5 times the body weight despite the small wing area and low flying speed [40, 64]. The ability of the wings to generate lift through flapping locomotion cannot be simply described using fixed wing aerodynamics, since large wing deforma-tion occurs over the flapping cycle [56].
Insects have evolved over the past 400 million years and the designs of their wings were optimized for flapping flights [16]. There are several studies that focused on the structural designs of insect wings: the vein thickness distribution on a dragonfly wing [28], the functionality of corrugation in dragonfly wings
[47]
and the venation network of various insect wings [16]. In particular, Combes and Dainel measured the flexural stiffness of the wings of different insect species and showed that stiffnesses of the wings depends on the cube of the span while the chordwise flexural stiffness to depend on the square of the chord length [12]. This result pointed towards a universal scaling and anisotropy of the wing designs, even though there is a wide variation in the venation networks across species of the insect [12, 16]. Combes and Daniel [13] also identified the thicker and stiffer veins along the leading edge as a common feature among insects, which is the main contributor to the anisotropy of the wings. On topof the overview of insect flexural stiffness, studies on specific features such as the effect of a vein joint on the flexibility and the aerodynamic force generated by the wings of a bumblebee
[44]
suggests that flapping wing structures can be optimized by exploiting unconventional structural designs.While studies of insect flight was of academic curiousity in the past, there is now great interest in the studies of the aeroelastic behavior of flapping wings due to the advancement in autonomous control, miniaturization of electronic components and interest in small scale flying vehicles [56, 61]. Micro Aerial Vehicles (MAVs), or a class of Unmanned Aerial Vehicles (UAVs) that are smaller than 15 cm in wing span, have become increasingly popular in military and commercial operations due to their ability to avoid detection and agility. Weight and size constraints motivates the optimization of every aspect of the flapping wing drones, including kinematics and structural designs. At the scale of the MAVs, flapping is the main mechanisms for propulsion
164]
and many research groups had turned to drawing inspiration from real insect wings. Examples of bio-inspired MAVs are the Nano hummingbird[311,
insect scale Microrobotic Fly [74] and DelFly [36]. Flexibility of the structure was found to have significant impact on the optimal thrust production of the wings and the structures undergo large deformation during the flapping [61].
A more common biomimetic object is the hand fan. It is used dynamically to
generate flow and used as a cooling device
[541
and its design was inspired by a bat's wing151].
In this thesis, we present a study of using the foldable hand fan as an analog model for flapping wings. We explored the effect of bending stiffness on the flow generation of planar homogeneous plates, followed by three different heterogeneous plates: commercial hand fans, discrete model fans and corrugated fans. Even though the specific geometry is different, the aim is to study the effect of discrete nature of the elements of the hand fan and the effect of corrugation.1.1
Past Studies of Flapping Plates
The optimization of flexural properties in fluid-structure couplings is ubiquitous in the engineering context of vortex-induced vibrations [73], and in biolocomotion [60]
(e.g., in bacterial flagella [35], fish fins [67] or insect wings [61]). More recently, the instabilities in flags had also been studied [19, 43] and proposed as a mechanism for power generation
[6].
While the influence of elasticity on the optimal locomotion of fish [20, 21, 68] and the resonance of insect wings [29, 42, 49, 52, 53, 57, 65] on the generation of thrust and lift have been widely explored as flat plates or foils, the effect of structural features on the performance of flapping wings remains elusive.The maximum and optimal thrust production was found to occur near the resonant frequency of the structure in a number of flapping plate studies [17, 22, 42, 49, 52]. For self propelled models, the optimal thrust production had occured at resonant frequency of as low as 0.41 of the natural frequency [29] to a range of 0.65-0.85 of the natural frequency [53, 65]. For comparison, the measurement of natural frequency of the dragonfly wings the flapping frequency is only at a fraction of the structural frequency [9]. The occurence of improved performance of plates at lower frequencies is thought to be due to the deformed shape being favorable to thrust production [53]. It was also observed that the system also simultaneously self-selects the conditions to achieve a Strouhal number of 0.25-0.35 [76], which are also exhibited by real
fishes [67, 63].
Many studies also showed that there is an intermediate flexibility at which the wings produce the optimal thrust [2, 4, 24, 25, 42, 46, 49, 50]. The study of the flexi-bility of the flapping structure can be largely classified into four categories: variation of flexibility through changing the thickness or material of the homogeneous flapping plate [65], in chordwise [2, 23, 42, 49, 50, 52], spanwise [4, 24, 32] and both chord and spanwise directions [25, 45, 46]. The chordwise case can be studied using two-dimensional [2, 42, 491 or quasi two-two-dimensional [17, 23] geometries. In a study, it was found that intermediate flexibility improved the thrust production by 1-2 times and doubles the efficiency [17]. The motion of the trailing edge of the airfoil was
also observed and foils with intermediate flexibility were found to produce favorable deflection that alters the effective angle of attack of the airfoil [4, 53]. Intermediate spanwise flexibility was found result in about a 50% increment in thrust and lower flexibility were found to cause the tip of the wing to move out of phase with the root, thus diminishing the thrust production [4, 24]. In a study that changes both the chord and spanwise direction, it was also found that increasing the flexibility of the leading edge structural member has a detrimental effect to the thrust produc-tion and increasing the flexibility of the wing relative to the leading edge improves thrust [46]. Most studies had relied on only changing the materials or thickness of thin homogeneous plates, while steering clear of more complicated structures. For studies that used composite wings [25], the studies again focused on the materials and little structural details were explored.
The flapping behavior is also studied using a modified versions of the Euler-Bernoulli beam theory and order of magnitude scaling of forces [17, 20, 29, 52, 651. Thiria and Godoy-Diana characterized the flexibility of the wing by the ratio of inertia to elastic force
[65].
Kang et al.. additionally scaled the added mass and aerodynam-ics term with non-dimensional numbers to derive the optimal thrust frequency[29].
While using order of magnitude scaling to study flapping motion is not new, most of the studies had focused on finding optimal frequency with few mention on effect of amplitude [49].While there are considerable efforts in the aeroelastic study of flapping structures, there are still a few open questions. In terms of operating conditions, many literature focused on the flapping frequency and only a few studies investigated the effect of linear flapping amplitude [76, 49]. How the angular flapping amplitude affect the thrust generation was not addressed by past studies. Flapping structures in nature have complicated features; the effects and functionalities of (1) corrugation, (2) stiff discrete members held together by compliant materials, (3) distribution of venation network of the insect wings, (4) porosity, and (5) aspect ratio of the wings on thrust production were not studied in detail. In this thesis, we will address our question on flapping amplitude and the effects of the first two structural designs. Finally,
Schnipper et al.
[58]
studied the vortex structure generated by a two dimensional foil flapping in a stationary soap film but otherwise, the work reported in the current thesis the first time the hand fan is studied in the context of aeroelasticity.1.2
The Hand Fan as an Analog Model to Study
Flapping Structures
Flexible handheld fans have been in existence since ancient Egypt and Assyria
[54j.
In Egypt, fans were symbols of wealth and power and divine items used in religious ceremonies. Because of the esteemed status of the fans, they were made with exotic materials such as ostrich feathers and embellished with precious stones and met-als [54]. The Japanese were credited for inventing the folding fan based on historical writings by Japanese and Chinese scholars[51].
A diagram depicting the different parts of a hand fans and terminology are shown
in Fig.1-1. The foldable fans typically comprise an array of discrete radial sticks that narrow to become ribs, themselves attached to the leaves. The sticks are pinned together at the head by a rivet which is the point of rotation for the sticks. The top and bottom sticks are called guards [41]. The sticks and ribs are traditionally made of wood, and the leaves are connected by fabric, threads or paper
[54].
Foldable fans with ribs that are connected by fabric leaves are known as the pleated fans while fans with ribs that are only connected at the tip with threads or ribbons are brisd fan[3].
Since the advent of the portable foldable fan, their use as an instrument to cool one down became increasingly popular. The to and fro axial motion about one's hand, displaces the air around the fan and generates vortices, thereby inducing flow. The foldable fans were introduced to Europe in the 16th century [3] and the craftsmanship of high-end artisanal fans has been passed down through generations; the geometry of the layout, together with materials, are careful selected to enhance the aerodynamic performance
[381.
rivet-sticks
head ribs or slips
guard
leaves DIAGRAM A
THE ANATOMY OF A FOLDING FAN
Figure 1-1: The parts and terminology of a pleated hand fan. Figure adopted from [41]
by the wings of a bat [51]. In fact, bats are not the only animals that possess a
stick-ribs-leaves structure. In marine biology, animals that use the fins for propulsion such as fishes
[34]
and seahorses[15]
have radial arrays of bony fin rays that form the surface called the fins [34].The wings of insects also have the stick-ribs-leaves structure. They consist of tubular veins spread out over the plane surface of the wings also known as the mem-brane. Even though the veins are made of similar materials as the wing membrane, the increased second moment of inertia of the tube causes an increased flexural stiff-ness [12]. For some species from the Lepidoptera (butterflies/moth) and Diptera (flies) order, the longitudinal veins form a radial pattern [14]. In the Odonata (dragonflies, laceflies) order, pleated structures were observed and the wings were observed to be able to carry very high loads and buckle reversibly [47]. Hence, the foldable hand fan is a good analog for these features in fish fins and insect wings.
1.3
Plate Bending and Vibration Theory
A plate is defined as a structural element where two of the dimensions are orders
of magnitudes larger than the third dimension. The plane formed by the two larger dimension defines the face of the plate and the third dimension is the thickness [66, 70].
The stress and deformation of a flat plate subjected to known loads or vibration are well described using the Kirchoff-Love plate theory, which is an extension of the Euler-Bernoulli beam theory [66, 70].
Assuming a characteristic length scale of a for the planar dimension and thickness
h, the way the plates carry load is highly dependent on the ratio of the thickness to the
planar dimensions a/h. Plates with a/h ~ 1 - 10
[70]
can be regarded as thick plates and the plate theory cannot be applied. For plates with a/h > 10, which is the case for all the results in this thesis, the plate theory can be used, and depending on the deflections relative to the thickness, the plate will either carry the load by bending or through membrane forces. Plate theory can only be applied to developable surfaces, or surfaces that have zero Gaussian curvature.The governing equation for plates under pure bending is given by the Kirchoff-Love plate theory:
+2 + =0, (1.1)
x94 &X2&y2 &x4
V2V2 = 0, (1.2)
where is the deflection and V2 is the Laplace operator. Under a transverse load
(perpendicular to the planar surface):
V2 -2 _q (1.3)
B
where q is the load per unit area and B is the flexural stiffness per unit length. For the case where the bending motion is independent in one of the dimension (say y), the Kirchoff-Love theory can be simplified to a form similar to the Euler-Bernoulli equation
04 q
- = - -- (1.4)
ax4 B
For plates under vibration, the governing equation is given by adding the D'Almebert forces to Eq. (1.3):
BV2
where pp is the density of the plate and P is the excitation given by P(x, y, t) = E fm(t)mn(X, y) m=1 n=1 w(x, y, t) = Fmn(t)Wmn(X, y) m=1 n=1 (1.6) (1.7)
where fmn is the forcing term, Fn is the response term, Wmn is the normalized mode shape, and m and n are the mode numbers. Assuming is sinusoidal in time,
-w2, where w is the natural frequency . For free vibration we have:
BV2V2Wmn - pphCnWmn = (1.8)
which is satisfied at every location on the plate. Hence, we have to integrate Eq. (1.8) over the entire plate
[30]
LL
J
BV 2Vg2Wmn - pyhw WmndA = 0 (1.9)and we define the modal mass Pnn and modal stiffness rmn (characteristic kinetic
energy and bending energy at mode shape mn) respectively:
Pmn = ph J Km = fW 2ndA (1.10)
J
BV2 V 2WmndAwhere A is the area of the plate. The natural frequency can be found using
'f=in"n (1.11)
Pmn
and we will now have to find expressions for Wmn by considering an estimate of the mode shape based on the boundary conditions.
shown in Fig. 1-2 with one fixed boundary (x = 0) and free boundary conditions on the other three sides, (x = a, y = 0, y = b). The boundary conditions are thus
a
b
x
Figure 1-2: x - y plane of a rectangular plate.
1. W =0, = 0 OX at x = 0 (1.12) 2. a [02W V
a=a+(2-VV Oy iy2 a2W 19X2I -0 at y=z0,b (1.13) =0 Vx= a ~0 2W aX2 at x =a (1.14)A way to estimate the natural frequency in Eq. (1.11) is to assume a mode shape that
satisfies the boundary conditions. A solution for W is given by
a2 W ay2 OW W = 01 =a 0 at x 0
a
2
w
2 0 at y = 0,b and = a OX2 (1.15) a2 W my = + a2W ax2 3. a2W a2wMX=
+ a9X2 v - +(2-v2WUsing a combination of sinusoidal and linear functions, we find that
n7ry ?Tr m7F 7y
W = sin sin " M ) - (M X) sin(b
)
(1.16)defines the mode shapes satisfies Eq. (1.15). Note that in order to satisfy the boundary conditions, m = Z+ and n = N. Since the plate is unconstrained in the y direction, we can assume a pure bending scenario, the surface is developable (Gaussian curvature
is zero)
15].
To have zero Gaussian curvature, we require n = 0:W -sin m((1.17)
To get the mode shape for the first mode, we substitute m = 1 into Eq. (1.17):
p = (27r 2 - 9) abph
2ab /r 4
r = B - (1.18)
7r a
The natural frequency can then be estimated by substituting Eq. (1.18) into Eq. (1.11):
7r 2 B B(
w 0.356 - = 3.51 (1.19)
a ph pha4
For a plate of similar deflection distribution but with different geometry, the nat-ural frequency can be expressed as
B
w=k B (1.20)
pha4
where a is a characteristic length scale of the plate and k is a dimensionless prefactor that depends on the geometry of the plate. We will use this expression in Chapter 3 to obtain the prefactor for a semi-circular plate. The experimentally obtained prefactor will then be used to estimate the natural frequency of plates beyond the limits of our instruments.
1.3.1
Orthotropic Plates
The heterogeneous plates in our study have regular linear or radial structural patterns (detailed descriptions of the heterogeneous plates can be found in Section 2.3). Even though there may be local variation or discontinuities in flexural properties, we can idealize the global behavior of the plates to be similar to an orthotropic plate. In solid mechanics, a material or structure is known as orthotropic when its properties have symmetry along three mutually orthogonal axis. The strain is related to the stress in an orthotropic material by
[7]
Ezz 'Yyz 1 ,xy-1 -M Ex 0 0 0 lEy Eyz -0 0 0 vz Ez 0 0 0 0 0 0 Gyz 0 0 0 0 0 0 1 Gxz 0 0 0 0 0 0 1 Gxy-o-XX o-yy o-ZZ cryZ cYXZ
For a plate, we consider the plane stress condition which makes the assumption
that the plate does not carry stress in the direction of the thickness: ozz = a =
cXZz = 0. Thus the stresses in a plates made with orthotropic material are
[37]:
1
o-yy-XV
where E, = vyEx = vxEy, vx and
Young's Modulus about the x or y
E, Ev 0 Exx
E E 0 eyy (1.21)
0 0 (1 - vxvy)Gxy yxy
vy are the Poisson ratio and Ex and Ey are the direction.
(1.22)
o-vZ G z 0 [j
o-yz- 0 GyZ - Yyz
Note that even though the stresses a-, and o-yz are assumed to be negligible in plate bending, vertical shear forces are required for the equilibrium of the plates
[70].
MX1
h/2
my = -h/2 Oxy, zdz (1.23)
i=
I
zdz (1.24)_QY
-h/l2 -Olyzwhere Mx, My and Mxy are the bending moments and
Qx
andQ,
are the shear force. For our application, we want to look at structurally orthotropic plates made with isotropic materials, such as corrugated plates or plates with stiffeners. To calculate the forces and moments, we can substitute Eq. (1.21) into Eq. (1.23) and (1.24), usingEx = Ey = E and vx = vy = v, and also using the strain curvature assumptions, we
obtain:
M -B,+ V!
MY = -By +Y vX (1.25)
MY By (1 - v)2W
where Bx, By and Bxy are the effective flexural stiffnesses relating moments to cur-vature.
For some cases such as plates with stiffeners, we can obtain the flexural stiffnesses through direct evaluation of the the integrals in Eq. (1.23) and (1.24). For corrugated plates, the flexural stiffness are dependent on the effective curvature and Castigliano's second theorem was used to derive the effective flexural stiffnesses proposed by Bri-assoulis
[8].
The equations for the effective flexural stiffnesses derived from the two different methods for corrugated plates are presented in Chapter 4.1.3.2
Anisotropy of the Hand Fan and the Effect on Natural
Frequency
The stiffer sticks/ribs of the hand fans are arranged in a radial fashion and the ribs are connected to adjacent ribs by compliant leaves. This radial arrangement resulted in different flexural stiffness in the radial and tangential direction and the hand fan is polar orthotropic. If we assume that the tangential flexural stiffness is negligible compared to the radial flexural stiffness, we can consider each stick/rib of the hand fans to behave like a beam and derive its characteristic natural frequency based on the flexural stiffness and the mass of the fans. For a cantilever beam the natural frequency is given by [30]
/#5
EIL2 pAb
#3 = 0.597-F
#= - (1.26)
where
j
is the mode number of the vibration and area Ab refers to the cross sectional area of the beam. For our hand fans, we can only experimentally measure their mass and we express the average mass per unit length, m = pA = f where M is the mass of the fans and R is the radius of the fan.For the hand fans, we will test our assumption that the hand fans are behaving like beams in Chapter 4 by using the following expression for the natural frequency of the hand fan:
W f E (1.27)
L2
pAb
where kf is a dimensionless prefactor. If the hand fans do vibrate like beams, we will find kf to be a constant.
1.4
Outline of Thesis
In the current introduction, we have provided a literature review and highlighted some of the relevant theory that will be used throughout this thesis. Chapter 2 describes the experimental apparatus used to conduct our studies, the process of choosing the hand fans and the fabrication of the model fans. Our study is divided into two main categories; flat homogeneous and heterogeneous plates. Our results for the homogeneous plates and theory to understand the scaling of flapping amplitude are reported in Chapter 3. In Chapter 4, we present the experimental results for the commercial hand fans, discrete model fans and corrugated fans. We will also contrast them with the corresponding values for the homogeneous plates. Finally, a summary of the outcomes of the thesis and areas of future work are provided in Chapter 5.
Chapter 2
Experimental Apparatus
In this chapter, we describe the setup and calibration for the experiments and method for the fabrication of the specimens. We designed and constructed an experiment set up that imposes the flapping motion of the fan, measure the flow generated by the fan and the torque required. The method for obtaining the instantaneous deflection of the fans during the flapping motion will also be presented. The chapter will also address the instruments and methods used to measure the natural frequency of the hand fan and plates. We then discuss the process of selecting the Spanish style of hand fans for this study and describe the structural elements of and materials used on the hand fans we acquired. Based on the design of the hand fans, we present the methods for making model fans that mimic two structural features of the hand fans. Semi-circular flat plate fan of various thicknesses were used as a baseline comparison and discrete model fans were designed to study the ribs-leaves feature of the hand fan. We also introduce corrugation to the thinner plates to study its effect. Finally, for our study we first evaluated the flexural stiffness of the hand fan by performing a precision load deflection test and the results for selected fans are also presented.
2.1
Flow Generation Experiment
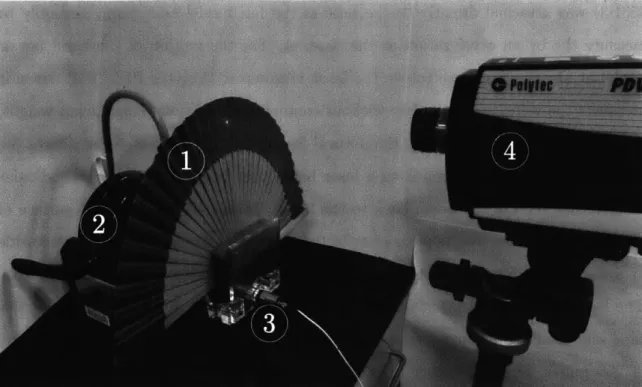
In order to study the effect of structure on flapping fan behavior we designed an ex-perimental set up that imitates the fan flapping motion (Section 2.1.1) and measure the flow output (Section 2.1.2). In Fig. 2-la, we present a photograph of the exper-imental apparatus used to measure the flow output and input torque of handheld fans or, their simplified analogue models. A motor is aligned horizontally with the shaft connected to the input shaft of the 1:5 step down gearbox. The output shaft of the 1:5 right-angle speed reducer is aligned vertically and the motion is transmitted
(a)
(b)
Figure 2-1: (a) A fan (1) is driven by a stepper motor (2), connected to 1:5 step down gearbox (3) followed by a torque sensor and encoder (4). The generated velocity is measured with an hot-wire anemometer (5). (b) A top down schematic indicating the flapping amplitude a and the angle between the hot-wire anemometer and the center line of the flapping motion. The red strip is on the x-y plate and on the same heigh as the symmetry line of the fan and indicates the range of positions the hot-wire anemometer.
through to a rotary torque sensor and encoder to a 6.35 mm diameter D-profile stain-less steel shaft. The D-profile prevents the connector clamps inserted from slipping and D-profile shaft collars were used to secure the connector clamps along the axis of rotation. There is a stainless steel shaft coupling between each piece of equipment. The couplings match the diameter of the connector shaft of each piece of equipment to ensure that all the connections are aligned properly and prevent relative slip.
The control and operation of the flapping motion set up is described in Sec-tion 2.1.1. For flow measurement, we used a TSI 1210 hot wire anemometer. Before using the hot wire anemometer, calibration was carried out for flows between 0.3-11 m/s. The calibration methods and set up are described in Section 2.1.2. In the exper-iment, the hot wire anemometer was placed such that it is always pointing towards the axis of rotation and in plane indicated in Fig. 2-1b. Finally, to determine the surface deflection of the fans or models during flapping, strobe-trigger method was used to capture still photograph explained in Section 2.1.4.
2.1.1
Control of the Flapping Motion
The rotary stepper motor (NEMA23) was controlled by a Copley Controls Stepnet stepper amplifier through an ethernet cable via a Kvaser CAN communication adap-tor. This allows us to program the motion using National Instrument LabView. We are able to control the stepper motor accurately to 0.5' and using a 1:5 right-angle speed reducer (Boston Gear) between the motor and the shaft, we improved the accuracy of the control to 0.10 and hence smoother flapping motion.
Using the manufacturer-provided motor control functions for the Copley amplifier for LabView, we programmed the motor to drive the motion for a series of amplitude at a fixed frequency. We imposed its angular position:
e(t)
= a sin(wt), where a is the angular amplitude (Fig. 2-1b), and t is time. The driving frequency was fixed at i = 2 Hz to match comfortable operation conditions of handheld fans and the angular2.1.2
Measurement of Flow Generated by the Fans or Models
Due to the transient nature of the flow generated by a flapping structure, we require a measurement instrument that has high acquisition rate. While pitot tubes are more accurate for steady flow, it can take up to a couple of seconds to stabilize. Assuming the comfortable flapping frequency for a person flapping a fan is -2 Hz and every complete oscillation passes through the middle of the flapping motion twice. generating a ~4 Hz signal and thus the minimum sampling rate required is -8 Hz. The hot-wire anemometer we used (TSI 1210) can handle transient responses up to
500 Hz, which is sufficient for our experiment.
Before using the hot wire anemometer, we have to calibrate the probe. For low speed, Ug we calibrated the probe by mounting it on a high precision linear posi-tioner (Parker Daedal model 404150XRMP-D2-H1L1) attached to a stepper motor and the motion of the stepper motor was controlled using LabView. As the hot wire anemometer moves together with the linear stage, the relative velocity of the air will be the speed of the movement. The linear stage was made to move at a speed of
Ug = 0.3-0.7 m/s and the output voltage from the hot-wire anemometer was recorded
using Logger Pro (Vernier Pro Software). For calibration at higher speed, the setup
anemometer anemometer holder axial adjustment horizontal
adjustment Pitot tube tip
anemometer vertical adjustment
clips
anemometer sensor slot
axial adjustment
Pitot tube mounts on
anemometer holde the NEAR side of the
anemometer
translation stage
Pitot tube base Pitot tube assembly
detachment point for removing Pitot tube
assembly
Figure 2-2: Photograph of the experimental setup for higher air flow Ug hot wire anemometer calibration and the pitot tube assembly. Figure adopted from [261.
in the 2.671 Instrumentation and Measurement lab shown in Fig. 2-2 was used. The flow is produced by releasing compressed air from a tank through a 100 mm inner diameter cylindrical tube. A pitot tube (Omega Engineering PX138-0.3D5V) and the hot wire anemometer were placed at the opening of the tube. They were positioned in the middle of the cylindrical tube opening to avoid significant boundary layer ef-fect. The output pressure P. ~ {300, 450, 600} kPa will typically produce a flow of
Ug = 4 - 12 m/s in the cylindrical tube. At each pressure setting, the pitot tube was first used to accurately determine the steady gas flow speed U in the cylinder. Then the output voltages of the hot wire anemometer probe for velocities of Ug = 5 - 11
m/s were obtained for our experiments. The constants from the calibration can then be found by fitting Vane, the voltage measured by the anemometer, and U9, the speed of the air, to the equation provided by the manufacturer Vie C1 + C2 U, as
shown in Fig. 2-3. 30 0 Data 25 Linear 20-15 10-00 0 (.5 1 1.5 2
V
Ug
2.5 3 3.5Figure 2-3: Plot of Ve against Uuse to derive
of the hot wire anemometer. The fit of the data
C1 = 6.73 0.6 and C2 = 7.06 t 1.3.
the constants for the calibration
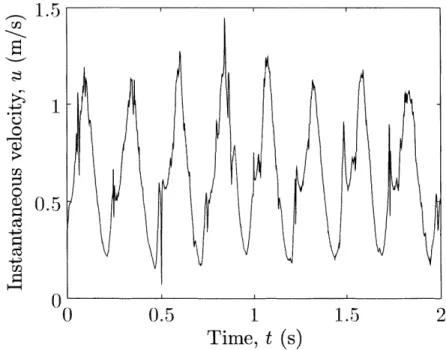
The calibrated hot-wire anemometer can now be used in the flow measurement experiment. The instantaneous velocity of the generated flow, u(t), was measured by setting the single point hot-wire anemometer perpendicular to the axis of rotation, at a distance d from the fan tip and an angle 0 from the mid point of the flapping tip motion, along the x-axis. Measurement of the velocity was carried out in the x-y plane on the same height as the symmetry line of the fan indicated by in Fig. 2-1, by having the center of the flapping motion be offset by an angle of 9, which allowed us to obtain the corresponding data without having to change the position of the hot-wire anemometer after every single data point. Based on the time average velocity field of velocity the final measurement location of d = 0.AR and 0 = 0' was selected. The specific results are presented in Section 3.3. For collection of data, the output of the hot-wire anemometer is collected via the National Instrument Data Acquisition device (USB-6002) and processed using LabView. In Fig 2-4, we present a 2 s sample of the instantaneous velocity, u(t), measured by the hot-wire anemometer using LabView. Note that the flapping frequency is set at 2 Hz, but there are four peaks every second. This is because there are two symmetrical passes
1.5 1- 1 0.5 0 0 0.5 1 1.5 2 Time, t (s)
Figure 2-4: A 2 s sample of velocity measured by the hot-wire anemometer. For this
of the fan in every complete oscillation when 0 = 0 and the hot-wire anemometer does not distinguish the direction of the flow. The peaks are of approximately the same height, indicating that the plate is flapping symmetrically.
2.1.3
Torque Measurement
We also want to know the torque required to impose the flapping motion, so that we can evaluate the input power. The instantaneous rotational input power can be computed using Pi = Te where r is the torque and 0 is the instantaneous rotational velocity. Hence, we added a rotatory torque sensor and encoder (Futek TRS 605) to our set up (Fig. 2-la) to measure the torque. The TRS605 measures torque up to
10 N/m with an uncertainty of 67 = +0.02 N/m and can measure the position of the fan up to 0.5'. The typical magnitude of torque is in the range of IT - 0.5 - 2
N/m. Due to taring procedures where we subtract the torque measurement without the fans from the overall torque measurement, the uncertainty is 26Tl/TI _ 2 - 8%.
Both sets of data were recorded simultaneously and we can then extract the phase data of the torque output. Again the output signal is collected using the
USB-6002 and processed using the same LabView program for the data collection of the
flow generation. This allows us to record both the torque T and angular position
e
together with the corresponding output flow, u(t) simultaneously. Finally, we can then extract the phase averaged flow velocity at each measurement location for a given fan position to obtain the phase averaged velocity field. The results and data analysis are presented in Section 3.2.2.1.4
Strobe Still Photography
Since we are interested in the effect of the geometry of the fans, we want to obtain the instantaneous deflection of the fans during flapping. The idea behind the technique is by controlling the amount of light in the environment, such that the camera only captures the instance when the lights are on. For that to work, the camera has to placed on long exposure mode in a dark room. The light strobe goes off at the the
specific time and the camera will capture a still image at the specific instance. In order to use the technique on our experiment, we need to make someni minor changes to the set up. A generic infrared beam-break sensor (it is a simple device constructed with infrared transmitter and receiver), shown in Fig. 2-5, is mounted next to the rotating shaft and a beam inserted into the rotating shaft such that every time the fan crosses the center line, the beam passes between the beam-break sensor. creating a gap in the signal collected by the receiver side of the beam-break sensor.
The sensor sends binary signals every 50 ms to a trigger kit (Cognisys Stop Shot) which we programmed to send a trigger to a photography strobe light every time a
gap is observed. The strobe light then produce a flash of light. We also programmed the trigger kit to send at most one pulse every second. Due to the frequency of the
signal, the time delay of the trigger is less than 50 ms which is significantly lower
than the frequency of the flapping motion of 2 Hz.
To collect our data, the specimen was first prepared by adding a regular array of points on the surface of the fan. We found that grids arranged in a rectangular
grid Fig. 2-6a or radial array Fig. 2-6b resulted in similar findings on the flat
semi-circular plate and thus opted to perform the test using a radial grid because of the geometry of the hand fans. A Nikon D600 camera is set up facing the face of the fan perpendicularly. The camera was set on the 0.5 s exposure mode and captured a still image at the instantaneous moment when the strobe light flashed. A photograph
(a) i;.-,
(b)
Figure 2-5: (a) Photograph of the mounted (1) infrared beam-break sensor and the
(a) ~(b) (c 40 20
B
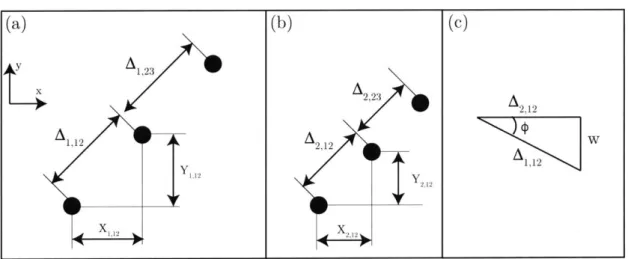
0 5 cmFigure 2-6: (a) Example of a grid of points on a semi-circular plate of R = 200 mm and h = 254 pm (b) Grid of points on Fan 1. (c) Example of the resultant deformation field. (a) 4 1,2 3 1,12 x 2 (b) 2,122 Y 21 xr, (c) A 21 w A112
Figure 2-7: Schematic showing the points on a (a) undeformed and (b) deformed surface. (c) Schematic showing the deflection of the relationship between deformed and undeformed planar length.
(C)
(a)
at the same angle is also obtained when the fan is not flapping and this will give us the undeformed configuration. Fig.2-7a and b are schematics of the undeformed and deformed grid array respectively. Considering the x-axis and y-axis to be aligned with the horizontal and vertical sides of the photo, we can find the coordinates of each of the points. The x and y distance between successive points are defined Xp,q, and Y},r where p = {1, 2} with 1 =undeformed and 2 =deformed and q and r are the identifier
for each of the points in the array. The distance between two successive points is
Ap,qr = X2 + Y2q,. Fig.2-7c shows a schematic of the relationship between the
undeformed and deformed distances. The slope angle is q = cos-1(A1,qr/A2,qr).
Deflection is then simply w = sin
4.
All the distances were computed based on pixellength and we will have to convert pixels into real distance. Note that we obtained
Ap,qr in pixels which is equivalent to real distance A*,qr = 20 mm.
2.2
Measurement of Natural Frequency Using a Laser
Vibrometer
Section 1.1 considered previous works that showed the first resonant frequency has considerable effect on the aerodynamic performance of flapping structure. We also need to compare the results and characterize the respective mechanical properties for the handheld fans and the homogeneous plates using the same metric. Thus we choose their natural frequency, w,, as the common mechanical property. This data will also help us better understand the effect of the change of structural features on the resonant frequency. The set up to measure the natural frequency of the fans and plate is shown in Fig 2-8.
The fan (or plate) is periodically excited from a frequency of
f
= 2-20 Hz with an electromagnetic shaker (Modal Shop 2075E). In order to find the natural frequency we need to be able to measure the response of the fan tip under vibration. The fan clamps (the respective clamps will be presented in Section 2.3) were connected directly at the base to the shaft of the shaker. An accelerometer (PCB PiezotronicsH
Figure 2-8: A fan (1) is driven by a electromagnetic shaker (2). The base acceleration is measured by an accerlerometer (3) and the velocity of the fan tip is measured with
an laser vibrometer (4). (a) 4 2 Q- 0 I) -4 0.5 Time, t (s) (b) 0.01. 0.005 0 -(0.005 -0.01 1 0.5 Time, t (s)
Figure 2-9: Example of signal (blue line) from (a) laser vibrometer and (b) accelerom-eter. The signal is fitted to a sinusoidal function (red line) using least root mean square. The specimen is a semi-circular flat plate R = 200mm, h = 762pm, vibrating at f=7Hz.
353B3) was attached directly to the base of the fan/model and clamp assembly to
measure the by an acceleration at the base, ab. For the motion of the hand fan or model at the tip, we chose to use the laser vibrometer (Polytec PDV 100), since it measures the velocity of a surface without contact and addition of significant weight, thus it would not interfere with the natural frequency. The vibrometer measures the velocity of a surface by producing a laser beam that is directed to a perpendicular surface that reflects the beam back to the laser vibrometer. To make the surface of the fan/model reflective, a piece of reflective tape was attached on to the face side at a distance of 5 mm from the tip and along the symmetry line of the semi-circle. The laser vibrometer was set up such that the laser points directly at the reflective tape and clear signals are obtained. The laser vibrometer is also limited to velocity of 250 mm/s, and the shaker amplitude was kept low. The laser vibrometer can work for frequencies up up 22 Hz accurately and we rejected results from models with natural frequencies higher than 22 Hz. Again the signals from the laser vibrometer and the accelerometer are digitized using the USB-6002 DAQ and recorded using a customized LabView program.
Fig. 2-9 shows an example of the signals obtain from the laser vibrometer and accelerometer. The signals from the DAQ and recorded in Labview are in voltages (V). The manufacturer provided conversion of the signal from the laser vibrometer to velocity is 1V= 125 mm/s while the manufacturer calibrated conversion of the signal from the accelerometer to acceleration is 0.0989V= 1g. The voltage signal from the laser vibrometer is Vtip while the voltage signal from the accelerometer is Vb.
The two sets of data are synchronous in time and the data was fitted to a sinusoidal function using Matlab. We then derived phase and amplitude by fitting the signal to a sinusoidal function such that Vip = Vma, sin(27rt +
#
1), V Vbma, sin(2irt - 2) and the phase difference is given by q = 1 -42,
which will be corrected to fall within0 <
#
< 27. Vma, and Vmax are converted to utmax, the amplitude of the velocityof the fan tip, and abmax, the amplitude of the acceleration of the base of the fan,
respectively. The maximum acceleration of the fan tip is then atmax = 2lrfUtmax. With
is simply given as A = atmax/abmax. In Section 3.1 and Section 4.1.2 presents the
measured natural frequency of the flat plates and, hand fans and models respectively
2.3
Experimental Specimens
We first conducted a search for various types of commercially available hand fans and observe the features of their designs, which we found to vary widely. In Section 2.3.1, we will rationalize our choice of using Spanish style hand fans for the study. Since we do not have control over the material properties and sizes of the hand fans, we want to fabricate model fans which we have control over those parameters. We fabricated three different types of model fans to understand the effect of structural features. In Section 2.3.2, we describe the fabrication procedure for the semi-circular flat plates, and its clamps, that will be used as simplified model systems for the hand fan. The mechanical feature we are exploring here is the effect of the thickness and hence the flexural stiffness of the fans. To study the ribs and leaves features found in foldable hand fan, we designed and fabricated a model fan made out of discrete flat sector-shaped plates described in Section 2.3.3. Finally, due to the foldable nature of the hand fans we can describe the folds as corrugation and we will describe the method we used to impose the geometry on the semi-circular plates in Section 2.3.4.
2.3.1
Materials and Structures of Spanish Hand Fans
As an initial screening process for the type of hand fans to be tested, we acquired a variety of commercial hand fans of different designs, almost all of them were of the foldable Chinese/ Japanese and Spanish style. Most of the fans we collected are constructed out of stiff structural members, known as the ribs, usually made of wood or plastic, connected at the fan tip with compliant thin materials, known as leaves, usually made with cloth, paper or thin plastic sheets. Besides the the materials used to construct the fans, angle of the fully opened fans is also of importance; the Chinese/ Japanese style of foldable hand fan when fully opened up forms a quadrant smaller than a semi-circle (e.g. Fig. 2-10a,c), which turns out to be another
param-(a) (b)
Figure 2-10: (a) A Chinese style plastic ribs and leaves hand fan with only seven ribs
(b) A Spanish style wood ribs and cloth leaves hand fan with overlapping ribs (c) A
Chinese style wood ribs hand fan without leaves with intricate through cuts on the ribs.
eter for consideration. The Spanish style fans on the other hand (e.g. Fig. 2-10b). though has the same ribs and leaves construction, open to a full semi-circular shape. eliminating the angle as a parameter. We will refer to the semi-circular surface side of the fully open hand fan as the face side.
The spacing between successive ribs and the size of the fold of the leaves is another factor to consider. If the number of ribs is small, the ribs are sparse circumferentially and thus the projected area of the fan changes significantly and difficult to estimate
(e.g. Fig. 2-10a). Spanish style of fan also tends to have higher number of sticks such
that each stick overlaps with adjacent ones, leaving the projected area of the fan to be exactly the same as a semi-circle (e.g. Fig 2-10b). Another common feature in some of the fans have intricate cuttings on the ribs both altering the projected area of the fan and the bending stiffness of the ribs (e.g. Fig. 2-10c) adding a problem of the effect of porosity, which is beyond the scope of this thesis.
The study began to focus on the Spanish style of fans and that brought the attention to a famous fan shop, Casa de Diego, in Madrid, Spain, that sells high quality and hand made Spanish style fans. From the conversation with the owner of the shop, we know that their collection of unembellished Spanish style hand fans is fabricated consistently and the source of materials for were also well documented. Even though the fans in the collection has very similar geometries, there are variations in terms of the size of the fans, choice of wood for the ribs and the thread counts for the leaves. The fan makers claimed that based on their experience, the "best" fans
Figure 2-11: Pictures of the seven fans obtained from Casa de Diego (face side).
of this series tend to be made with wood from fruit trees, such as orange or pear, as they are strong yet flexible and London plane tree wood is also often used. We found that the typical Young's modulus of wood from pear tree is indeed the lowest at 7.8 GPa, followed by London plane tree at 8.9 GPa and then orange tree at 11.6 GPa [551. High thread count cloth are also preferred as the threads are more closely weaved, thus reducing the effect of porosity, and was thought to be able to generate flow more efficiently.
Based on this information, we obtained a collection of seven fans shown in Fig 2-11 with their properties summarized in Table 2.3.1. Fans 1, 2 and 3 are of the same size with radii R = 212 mm. Fan 1 has 34 orange wood ribs and standard cloth leaves that only covers the outer 40 mm of the fan. The leaves section is half the length of the leaves of Fan 2 and 3. Fan 2 and 3 have the same geometry, but are made of different materials. The 24 ribs of Fan 2 are made out of wood from London Plane tree and the leaves out of standard thread count cloth. Fan 3 is made with pear wood
Table 2.1: Properties of commercial hand fans
Fan R (mm) Wood Cloth thread count Number of ribs
1 212 orange standard 34
2 212 London Plane standard 24
3 212 pear high 24
4 144 London Plane standard 24
5 137 pear standard 24
6 244 pear high 30
7 300 London Plane standard 20
and high thread count cloth. Fan 4 and 5 have smaller radii R = {144, 137} mm and both have standard cloth leaves. However, Fan 4 is made of 24 London Plane wood ribs and only has 15 mm of leaves while Fan 5 is made of 24 pear wood ribs and has 60 mm of leaves. Fan 6 has radius R = 244 mm, made with 30 pear wood ribs and high thread count cloth. Fan 7 has radius R = 300 mm and has 20 London Plane wood ribs and standard cloth. It seems that other than the materials used, the ratio of the length of leaves to the overall length of the hand fans may be another important feature. In our flow generation experiments, we focus on the first three hand fans, which are of the same size but have slight differences in their structure and materials.
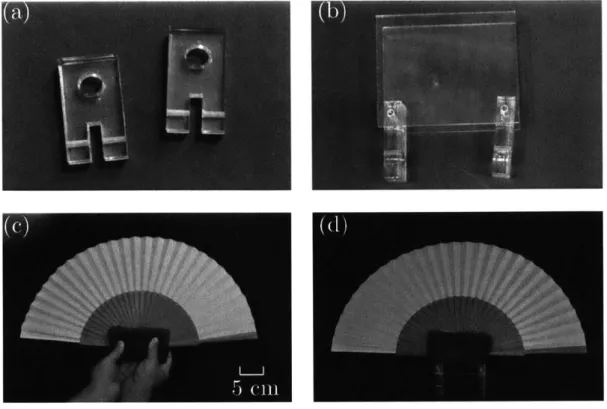
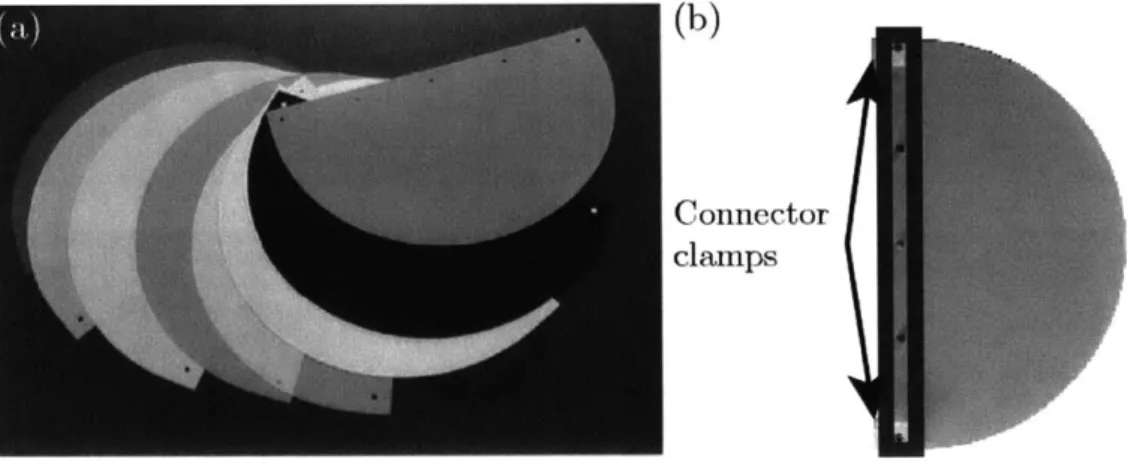
The geometry of the hand fan is rather complex, especially at the base of the fan. In order to test the fan we constructed a simple clamp that can hold the fan open, while not applying breaking them with excessive force. Rigid clamps fabricated through using 3-D printing require a high resolution 3-D CAD of the fan since they need to match the surfaces of the fan perfectly. Given the high number of ribs in Spanish style fans, it is unrealistic. The clamp (Fig.2-12b) is made by attaching two acrylic plates to two connecting clamps (Fig. 2-12a) to the shaft. The distance between the two acrylic plates is 63.5 mm, which is thicker than the hand fans. A compliant material that can conform to the shape of the fan is then required to fill up the space between the fans and the plates, but yet has sufficient stiffness to impose a fixed boundary condition at the root. Polyurethane foam sheets with Young's
Figure 2-12: (a) Connector clamps to the rotating shaft (b) Acrylic plates attached to the connector clamps (c) Polyurethane foam wrapped around the hand fan (d) Foam and fan inserted between the acrylic plates.
Modulus of approximately 4000 Pa were used to wrap around the fully opened fan (12c) before being inserted them between the acrylic plates, as shown in
Fig.2-12d. The foam becomes stiffer under compression and the fan remains in the same
position even after high amplitude oscillations.
2.3.2
Fabrication of Flat Semi-circular Plates
As a baseline for flow generation, we want to test fans that have constant thickness over the entire surface. The semi-circular shape is picked since that is the projection of the face side of the hand fans. We fabricated semi-circular flat plate out of acrylic and polyethylene terephthalate (PETG) by laser cutting them out from a larger sheet of material using a LaserPro Spirit laser printer at the fabrication lab in Civil and Environmental Engineering department in MIT. Plates of two plates radii were
fabri-cated, R =
{120,
200} mm where the later was chosen because of the similar relative size to Fan 1-3. The former was chosen to correspond in size to the smaller Fan 4 and 5.(b)
Connector clamps
Figure 2-13: (a) Photo of the 120 mm semi-circular fans made from PETG of a range of thicknesses. (b) Photograph of the face side of a semi-circular plate fan of thickness
h = 762 pm and R = 200 mm with acrylic strips (blue box) and the connector clamps attached at the holes on the two ends.
The bending stiffness of the plates can then be changed systematically by using
sheets of different thicknesses, since the flexural stiffness B = Eh3/12(1-V), where E
is the Young's Modulus of the material and h is the thickness of the plate. The plates with h = {1588, 3175} pm were made out of acrylic (E=3.5 GPa, pp= 1180 kg/M3) and
the plates with h ; 1016 pm were made out of PETG (E=z2.2 GPa, pp=1270 kg/m3). Plates of R = 120 mm (Fig. 2-13a) were made out of PETG plates of thicknesses h =
{50, 76, 102, 127, 191, 254, 281, 508, 762, 1016} ftm while plates of R = 200 mm were
made with both PETG and acrylic plates of thicknesses h = {102, 127,191, 254, 281,
508, 762, 1016, 1588, 3175} pm. An additional 2 cm was extruded at the base (flat)
side of the semi-circular plates and five equidistance holes were cut in the extruded section, as indicated in Fig. 2-13b . We also laser cut two acrylic strips of thickness
h = 3175 pm, corresponding to the shape of the extruded section and they were
fastened on each side of the plate with nut and bolt at the middle three holes. The two extreme holes were used to attach the fan to the connecting clamps.
![Figure 1-1: The parts and terminology of a pleated hand fan. Figure adopted from [41]](https://thumb-eu.123doks.com/thumbv2/123doknet/13895285.447737/17.917.185.709.118.401/figure-parts-terminology-pleated-hand-fan-figure-adopted.webp)